Stock Unusual Volume: How to Trade Breakouts with Confidence
When a stock's trading volume suddenly goes through the roof, it's a signal that demands your attention. This phenomenon, known as unusual volume, is when a stock trades far more shares than its daily average. It's one of the most powerful—yet often overlooked—clues the market gives us.
This surge in activity is a critical sign that something significant is happening, often foreshadowing a major price move. It’s the market’s way of whispering that big players are making their move.
Why Unusual Volume Is a Trader’s Secret Weapon
Think of it this way: price tells you what is happening, but volume tells you how much conviction is behind that move. It’s the market’s truth serum.
A stock inching higher on thin, anemic volume is one thing. But a stock exploding upward on 10 times its normal volume? That’s a whole different story. That’s the unmistakable footprint of institutions, hedge funds, and other informed traders piling in.
Ignoring these spikes is like hearing a smoke alarm and not checking for a fire. It’s a clear warning that something big is underway. As many professional traders know, trading volume is the ultimate confirmation tool for price action; high volume gives a price trend legitimacy. You can find more insights on unusual volume from MarketBeat to see how the pros use this data. When a stock suddenly trades with massive volume, it’s a glaring sign that the game has changed, and you need to pay attention.
The Story Behind the Spike
So, what causes these dramatic bursts of activity? Understanding the "why" is just as important as spotting the "what," as it helps separate real opportunities from mere noise.
- Breaking News and Catalysts: This is the big one. An unexpected earnings beat, a game-changing FDA approval for a biotech company, or juicy merger rumors can send volume into the stratosphere as traders scramble to react.
- Institutional Activity: When a massive fund decides to build a new position or dump an old one, they can't exactly be subtle about it. Their enormous orders create huge volume spikes that are impossible to hide, broadcasting their conviction to the entire market.
- Technical Breakouts: A stock smashing through a key resistance level on a surge of volume is a classic technical signal. This acts like a magnet for momentum traders, who jump on board and pour even more fuel on the fire.
The bottom line is simple: volume often precedes price. A significant jump in trading activity frequently occurs right before, or at the very beginning of, a major move. By learning to spot and interpret these signals, you can get in front of the crowd.
Not All Volume Is Created Equal
It's crucial to understand that not every volume increase is a buy signal. Context is everything. A stock trading at twice its average volume might just be having a busy day.
However, a stock trading at 20, 30, or even 50 times its average is screaming a much stronger message. This is where the concept of Relative Volume (RVOL) becomes so valuable—a metric we'll dig into later. It cuts through the noise by comparing current volume to its recent average, allowing you to instantly gauge the true significance of any spike.
This table gives a quick breakdown of how to think about different levels of relative volume.
Levels of Unusual Volume Significance
| Relative Volume (RVOL) | Significance Level | Potential Implication |
|---|---|---|
| 2x - 4x | Moderate | The stock is "in play." Worth watching, but not necessarily an urgent signal. |
| 5x - 9x | High | Significant interest is building. Often driven by news, rumors, or a technical event. |
| 10x - 19x | Very High | A major event is likely occurring. This is the footprint of institutional activity. |
| 20x+ | Extreme | Potentially transformative event. This could be a buyout, major clinical trial data, or a massive earnings surprise. |
Knowing how to differentiate between a slightly busy day and an institutional-level event is the foundation of a solid volume-based trading strategy. It helps you zero in on the moves that truly matter.
Building Your Ultimate Unusual Volume Scanner
Knowing the theory behind unusual volume is one thing, but actually finding these setups in real-time? That requires a powerful, fine-tuned scanner. This is where you develop a real edge as a trader—getting away from default settings to build a system that tips you off to big market moves before everyone else piles in.
Think of a good scanner as your eyes and ears in the market. It tirelessly sifts through thousands of stocks, flagging only the ones showing truly extraordinary activity. The whole point is to cut through the noise and zero in on stocks leaving an institutional footprint, giving you a head start on potential breakouts.
This flow chart nails the process. A stock is just trading normally, then some catalyst hits, and boom—unusual volume floods in.
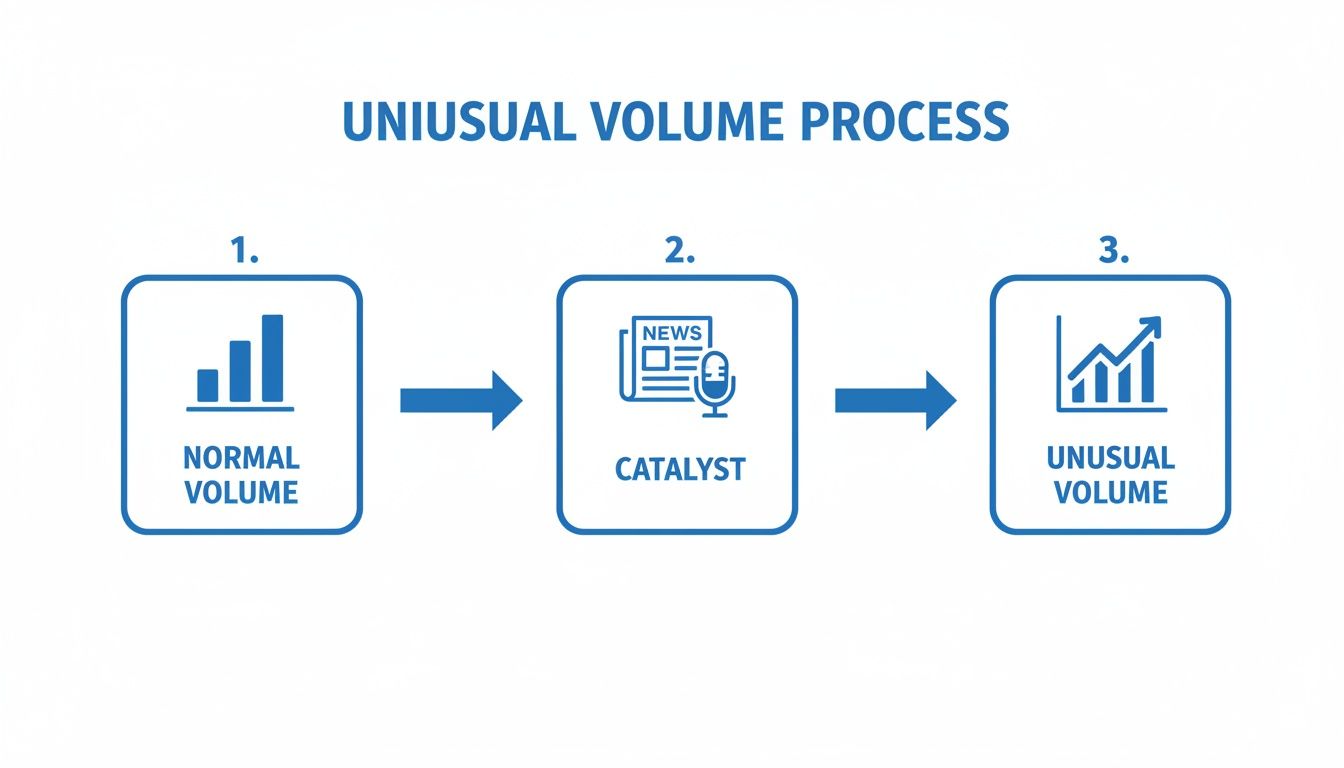
It’s a great reminder that these volume surges don't just happen out of nowhere. They are almost always a direct reaction to a meaningful event that has suddenly changed the stock's story.
Core Filters for Your Unusual Volume Scan
Putting together an effective scan starts with a few non-negotiable filters. These are the absolute foundation of your search, making sure you only see stocks that are both significant and, just as importantly, tradable. If you skip these, you’ll get swamped with junk signals from illiquid penny stocks.
Here are the essential parameters I always start with:
- Relative Volume (RVOL) > 3.0: This is your main filter. Setting RVOL above 3.0 means you’re only looking at stocks trading at least 300% of their normal volume for that specific time of day. This instantly cuts out stocks that are just a little "busy" and hones in on statistically significant events.
- Average Daily Volume > 500,000 shares: This is a crucial liquidity filter for risk management. It ensures you can get in and out of your trades without massive slippage. Anything with less volume is often too choppy and a nightmare to trade with any real size.
- Price > $5.00: Filtering for stocks above five bucks helps you steer clear of the most speculative, high-risk penny stocks. While there are opportunities down there, they're a completely different beast with a risk profile that doesn't fit a core volume strategy.
These basic settings will give you a high-quality pool of candidates to work with. From here, you can start layering on more specific criteria to match your trading style. For a much deeper dive into the nuts and bolts of scan building, check out our complete trader's guide to real-time stock scanning.
Configuring Your Scanner in ChartsWatcher
Putting these ideas into action is simple with a platform like ChartsWatcher. I like to build a dedicated "Unusual Volume" dashboard that pulls all the key data into one clean view. You'd just open a new toplist window and plug in the core filters we just covered.
The real power, though, comes from adding secondary filters that align with your specific strategy. For instance, you might want to add:
- Percent Change > +5%: This will narrow your results to stocks that are already moving up with conviction, confirming bullish momentum is present alongside the volume spike.
- Float < 100 Million Shares: I love this one. Stocks with a lower float (the number of shares available to the public) can make absolutely explosive moves on high volume simply because supply is so limited.
Once you have everything dialed in, save the settings as a preset. That way, you can load your custom scan with a single click at the start of every trading day, making sure you never miss a beat.
Pro Tip: Don't just scan—alert. The best traders I know set up audible or visual alerts tied to their scans. An alert that fires when a new stock hits your RVOL and price criteria means you can focus on managing your actual trades instead of staring at a list all day long.
Fine-Tuning for Your Personal Strategy
Your perfect scanner setup isn't something you set once and forget. It should evolve as you do. The filters that work for a pre-market momentum trader will look very different from what an end-of-day swing trader needs.
Get creative and experiment with other layers based on what works for you.
Maybe you only like to trade stocks hitting their 52-week high, or perhaps you have a knack for trading biotech stocks. By adding these custom rules, you turn a generic unusual volume scanner into a personalized trading weapon that consistently surfaces the exact setups you're best at trading.
Uncovering the Catalyst Driving the Volume
A scanner flagging a stock with 20x its normal volume is an exciting signal, but honestly, it's only half the story. Finding a volume spike is easy; the real edge comes from understanding why it’s happening. The volume tells you big money is making a move. The catalyst tells you if that move has legs.
Without a powerful reason behind it, a volume surge can fizzle out just as quickly as it started. That's why the very first thing you should do when an alert fires is to put on your detective hat. Your job is to immediately hunt down the fundamental reason driving all that institutional interest. This single step is what separates disciplined traders from everyone else chasing random, meaningless price action.
The Hunt for the "Why"
This investigation needs to be lightning-fast. In today's market, news travels in seconds, and that initial explosive move can be over in minutes. You don't have time to get lost in financial statements; you need a rapid-fire process to find the headline.
Most of the time, these massive volume surges are driven by a few key things:
- Earnings Reports: This is the classic. A company reports quarterly earnings that absolutely crush or completely miss expectations. Look for headlines with phrases like "record revenue," "raised guidance," or "unexpected loss."
- Clinical Trial Data & FDA News: For any biotech or pharmaceutical stock, this is everything. News of a successful Phase 3 trial or an FDA approval can fundamentally revalue a company overnight, triggering insane volume.
- Mergers and Acquisitions (M&A): An announcement that a company is being acquired—or even strong rumors of a buyout—will cause volume to explode as arbitrage players and speculators pile in.
- Analyst Upgrades or Downgrades: A major rating change from a well-respected firm can be enough to trigger a significant wave of buying or selling.
Your trading platform's news feed is your best friend here. Tools like ChartsWatcher are great because you can often link a news window directly to your scanner. When you click a ticker, all the relevant headlines pop up instantly. That kind of workflow is absolutely essential for speed.
Separating Signal from Noise
Once you find the catalyst, the real work begins. Not all news is created equal, and you have to learn how to quickly judge the quality and potential impact of the story. Is this a game-changing event for the company, or just a temporary, rumor-fueled frenzy?
A durable catalyst changes the company's story. Think an FDA approval that opens up a billion-dollar market, or an earnings report that proves a new business model is a home run. A weak catalyst is often a vague rumor or a minor analyst upgrade that won't have a lasting impact.
To figure out which is which, I always ask myself a few critical questions about the news:
- Is it official? Did the company put out a press release, or is this just chatter on social media? Official news carries far more weight.
- Is it a surprise? An expected earnings beat might cause a small pop. An unexpected, blowout quarter can ignite a multi-day rally. The element of surprise is a massive market mover.
- Does it affect the company's future earnings? This is the most important question of all. A new contract, a major product launch, or a regulatory green light directly impacts future revenue. That's what justifies a higher stock price.
This simple framework helps you sidestep the costly trap of chasing low-quality moves. By focusing only on stocks with powerful, story-changing news, you're aligning yourself with the institutional money that's driving the volume in the first place—and that dramatically increases your odds of catching a sustainable trend.
Executing High-Probability Volume Breakout Trades
Okay, so your scanner just lit up with a stock showing massive volume, and you've confirmed there's a real catalyst behind the move. Now what? This is the moment where you shift from analyst to operator, and having a plan is everything. It's how you remove emotion and guesswork from the equation.
Spotting the stock unusual volume is just the first step. Executing a trade based on a clear, repeatable plan is how you turn that signal into potential profit.
We're going to focus on two battle-tested patterns that I've seen work time and again in these high-momentum situations. The goal isn't just to chase a hot stock; it's to find a logical entry where your risk is defined and the odds of a continued move are stacked in your favor.
The High RVOL Opening Range Breakout
The first 30 to 60 minutes of the trading day—the opening range—can tell you so much. This period sets the initial high and low, creating a clear battlefield between buyers and sellers. When a stock is already trading on huge relative volume (RVOL), a break from this range can unleash an explosive, trend-following move.
This setup is so powerful because it marries the raw energy of the volume spike with a clean technical trigger. A great way to approach this is by mastering the opening range breakout trading strategy, which gives you a structured method for riding that early momentum. The idea is simple: let the initial chaos settle down, define the range, and then jump in as the price proves its directional bias.
Here’s the game plan:
- Entry Trigger: Set a buy-stop order just a few cents above the high of the opening range (say, the first 30 minutes). You only get pulled into the trade if the price breaks through that level with conviction—meaning volume is still strong.
- Stop-Loss Placement: A logical stop goes right below the midpoint or the absolute low of that same opening range. This defines your exact risk on the trade before you even get in.
- Profit Targets: For an initial target, I like to look for at least a 1.5:1 or 2:1 risk-to-reward ratio. For instance, if your stop-loss is $0.50 from your entry, your first target is $0.75 to $1.00 higher.
The beauty of this pattern is its objectivity. There's no guessing. The market either confirms the breakout by hitting your entry, or it doesn't, and you move on without a loss.
The Mid-Day Consolidation Break
Stocks that explode higher at the open rarely run straight up all day. They need to breathe. This pause often creates a tight consolidation or a "flag" pattern on an intraday chart, which is just a temporary truce between buyers and sellers.
This consolidation is your window of opportunity. The morning surge, fueled by the catalyst and massive volume, already proved that big money is interested. The consolidation is just the stock catching its breath before the next leg higher. A breakout from this pattern signals that the buyers have absorbed all the sellers at that level and are ready to push again.
For a deeper look at these types of setups, our guide on a breakout trading strategy to maximize gains covers more ground. https://chartswatcher.com/pages/blog/breakout-trading-strategy-to-maximize-gains
Trade Execution Plan:
- Identify the Consolidation: After the initial morning run, look for the stock to trade sideways in a tight channel for at least 30-60 minutes. Ideally, you want to see volume taper off during this time—a classic sign of healthy consolidation.
- Define the Breakout Level: Draw a line across the highs of the consolidation range. That's your trigger point.
- Set Your Entry and Stop: Place a buy-stop order a few cents above that resistance line. Your stop-loss goes below the low of the consolidation, keeping your risk clearly defined and contained.
- Manage the Trade: As the price breaks out, volume should surge again, confirming the move is for real. From there, you can use a trailing stop or pre-set price targets to lock in profits as the new trend develops.
Both of these setups give you a repeatable framework for trading these high-volume movers. By waiting for a clear technical pattern to emerge, you stop chasing extended stocks and start entering at strategic points where the odds are tilted in your favor.
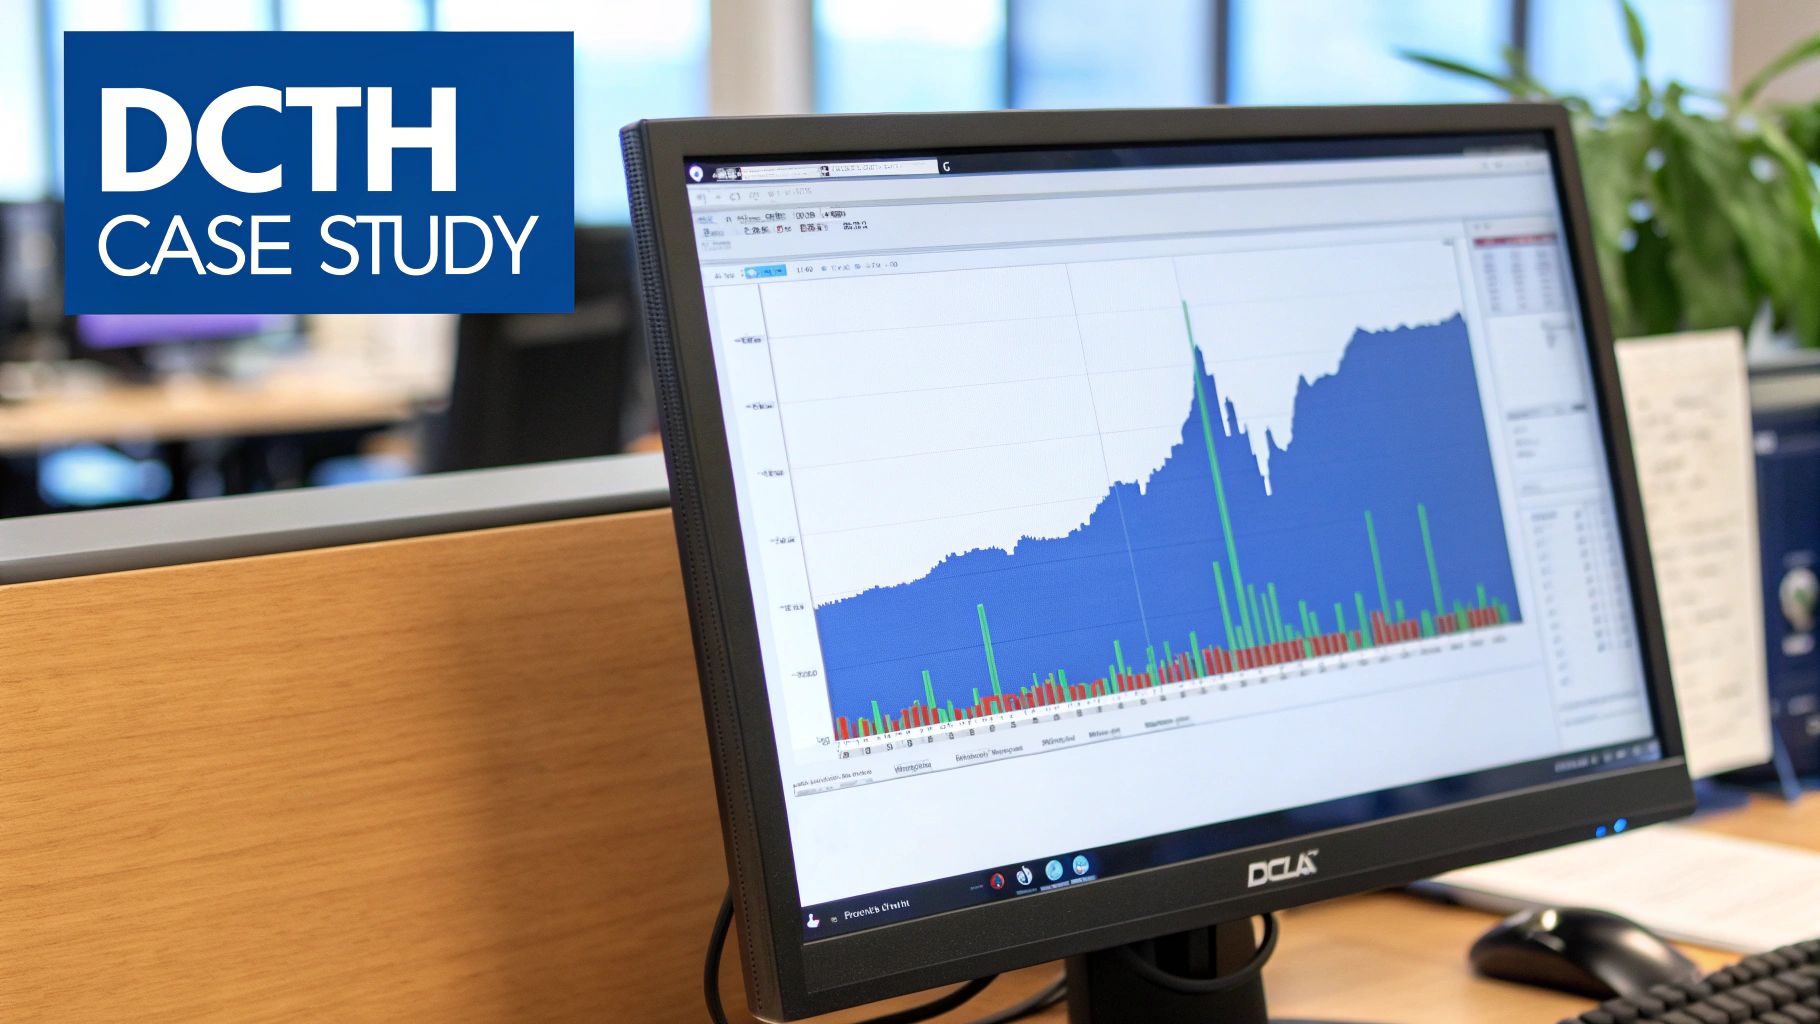
Anatomy of a Trade: The Delcath Systems 13,568% Volume Surge
Alright, let's move from theory to the trading floor. It's one thing to talk about scanner settings and chart patterns, but it's another thing entirely to see how they all come together in a real-world, explosive trade. This case study on Delcath Systems (DCTH) is a perfect breakdown of how this entire process clicks into place.
This isn't just a victory lap on a great trade. Think of it as a step-by-step replay, showing how a systematic approach to finding stock unusual volume can put you right in the path of a massive, news-driven move. We'll walk through the whole sequence: the alert, the catalyst, and the technical setup that turned it into an opportunity.
The Initial Signal
The day started out quietly, but a properly tuned scanner would have shattered that calm in an instant. Any trader running the scan we built earlier—filtering for RVOL > 3.0, price > $5, and average volume > 500k—would have seen DCTH practically jump off their screen.
The numbers were just staggering. In a single day, Delcath Systems saw a 13,568% tsunami of trading volume compared to its normal daily activity. This wasn't just "unusual"—it was a market-shaking event. The price action was just as dramatic, with the stock rocketing 91% on the exact same day. You can find more details on how regulatory events create volume surges on chartswatcher.com.
An alert this extreme is the market's equivalent of a flare gun going off in the dead of night. It’s an undeniable signal that something fundamental has just changed for this company, and it demands your immediate attention.
Uncovering the Catalyst
Once we knew what was happening (the volume surge), the next question was why. A quick glance at a news feed would have provided the game-changing answer almost instantly.
The U.S. Food and Drug Administration (FDA) had just granted full approval for the company's Hepzato Kit, a treatment for a specific type of ocular melanoma. For any biotech company, getting full FDA approval is one of the most powerful catalysts imaginable. It instantly transforms a company from a speculative R&D story into a commercial business with a real product to sell.
This wasn't some minor analyst upgrade or a fuzzy rumor. This was the ultimate story-changing news, and it checked all the boxes for a high-quality catalyst:
- It was official: The news came straight from the FDA and the company itself.
- It was significant: Full approval opens the floodgates for revenue and dramatically de-risks the company's future.
- It directly impacts earnings: The company could now start marketing and selling its product.
This is the perfect synergy we hunt for: an extreme volume spike directly backed by a top-tier, fundamental catalyst. The institutional footprint was massive, and the reason for it was crystal clear.
Executing the Trade Setup
The final piece of the puzzle was the technical entry. With a monster catalyst and huge institutional volume confirmed, the goal was to find a low-risk entry point to ride the new trend. Chasing that first insane spike is a classic rookie mistake; the professional approach is to wait patiently for a clean pattern to form.
After the initial explosion, DCTH began to pull back and consolidate, forming a tight intraday flag pattern. This pause was the perfect opportunity for a "Consolidation Break" setup. It showed that buyers were absorbing the early profit-takers, essentially coiling the spring for the next leg up.
Here’s how a trader could have managed the setup:
- Entry: A buy-stop order would be placed just above the high of that consolidation range.
- Stop-Loss: The stop-loss goes right below the lows of that same range, defining a clear and manageable amount of risk.
- Execution: As the price broke out of the pattern, volume surged again—the confirmation that the next move was starting. The trade triggers, and you're in.
This Delcath Systems trade is a masterclass in following a process. It perfectly illustrates how combining a robust scanner, quick catalyst analysis, and a patient, pattern-based entry can turn a stock with unusual volume into a high-probability trading opportunity.
Don't Get Burned: Mastering Risk in High-Volatility Scenarios
Trading stocks with unusual volume is a bit like playing with fire. It's powerful, sure, but one wrong move and you’re toast. This is exactly why getting a handle on risk management isn’t just some optional add-on; it’s the one skill that separates traders who make a living from those who blow up their accounts on a single bad trade.
When a stock is ripping higher, the fear of missing out (FOMO) kicks in hard. It's an almost irresistible urge that tempts you into the cardinal sin of trading: chasing a stock that’s already made a huge move. That's one of the lowest-probability entries you can possibly take. The only real defense against these emotional traps is a rock-solid, pre-defined risk management plan.
Size Your Positions Based on Volatility
One of the most common mistakes I see is traders risking the same dollar amount on every single trade, no matter what the stock is doing. Think about it—a stock that usually moves $0.20 a day is a completely different beast than one that’s suddenly swinging $2.00 every few minutes. They demand different approaches.
This is where the Average True Range (ATR) becomes your best friend.
ATR is a simple indicator that measures a stock's recent volatility. By basing your position size on the ATR, you can keep your risk consistent from one trade to the next. For example, you might decide to risk 1 ATR on every setup. For a sleepy, low-volatility stock, that could mean using a wider stop-loss with fewer shares. But for a wild, high-volatility stock, it means you'd use a much tighter stop and adjust your share size to keep the total dollar risk exactly the same.
Smart risk management isn't just about setting a stop-loss. It's about knowing exactly how much you stand to lose in dollars before you even click the 'buy' button. You adjust your position size so that no single trade can ever take you out of the game.
Force Your Own Discipline with Bracket Orders
In the heat of the moment, when a stock is flying, it’s incredibly easy to freeze up or start second-guessing your plan. Fast-moving markets are overwhelming, and trying to execute manually is just asking for trouble. This is precisely why professional traders rely on bracket orders to enforce discipline.
A bracket order is a three-part command you send to your broker all at once:
- The Entry: Your buy order at a specific price.
- The Profit Target: A limit order to automatically sell for a gain.
- The Stop-Loss: A stop order to automatically sell for a pre-defined loss.
The second your entry order gets filled, the profit target and stop-loss orders are instantly activated. This completely automates your trade management, forcing you to stick to the plan you made when you were calm and rational. It takes away the temptation to move your stop "just a little bit lower" or to get greedy and hold on past a perfectly good profit target. This mechanical approach is a lifesaver for navigating the chaotic price swings of unusual volume stocks, protecting both your capital and your sanity.
Common Questions About Trading Unusual Volume
When you start digging into volume-based strategies, a few key questions always pop up. Let's tackle the most common ones I hear from traders trying to get the hang of this.
How Do I Know if a Volume Spike Is a False Signal?
This is the big one. A volume spike without a real, verifiable catalyst is almost always a trap. If you can't find a significant press release, FDA news, or a major earnings beat within a few minutes of the spike, you should be extremely skeptical.
A true institutional move is almost always tied to a tangible event that fundamentally changes the stock's story.
Pay close attention to the price action that follows. Did the stock rocket up on huge volume only to give back all its gains almost immediately? That's a classic sign of a rumor-driven frenzy that fizzled out. Genuine, news-driven moves tend to hold their initial gains and begin to consolidate, setting up for the next leg higher.
Is Low-Float or High-Float Better for This Strategy?
Honestly, both can work, but they are completely different animals. You need to know what you're getting into.
- Low-Float Stocks (e.g., under 100 million shares): These are the lottery tickets. An unusual volume surge can create an intense bidding war because the supply of shares is so limited, leading to incredibly explosive moves. The reward potential is massive, but so is the risk and volatility. It's a much wilder ride.
- High-Float Stocks (e.g., large-cap names): Here, the moves are slower and more methodical. You're unlikely to see a 50% gain in a single day, but the trends that develop are often far more sustainable and predictable. This makes them a better fit for traders who can't stomach extreme price swings.
My advice for beginners? Start with higher-float stocks. They're more forgiving. They give you a chance to learn the nuances of volume setups without the risk of getting wiped out by the violent swings common in low-float names.
When Should I Take Profits on a Volume Breakout Trade?
You need to have your exit plan locked in before you even think about hitting the buy button. Don't make it up as you go.
A straightforward approach is using risk/reward multiples. For instance, if you set your stop-loss $0.50 below your entry price, your first profit target could be $1.00 above it. That's a solid 2:1 reward-to-risk ratio. A good practice is to sell a portion of your position there—maybe half—and then use a trailing stop on the rest to see if you can catch a bigger run.
And if you're really looking to build a solid foundation, diving into the best way to learn stock trading from video courses can be a huge help in mastering these kinds of planning skills.
Ready to build a scanner that finds these opportunities before the crowd? ChartsWatcher provides the powerful, real-time tools you need to detect unusual volume and act on it with confidence. Start your analysis at chartswatcher.com.
