Breakout Trading Strategy to Maximize Gains
The Psychology Behind Winning Breakout Trading Strategies
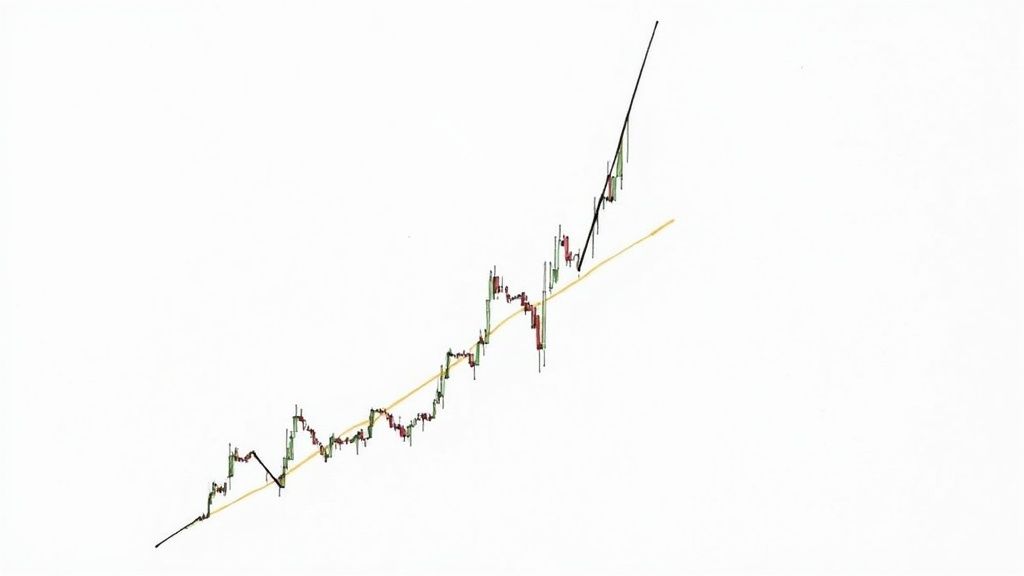
Breakout trading strategies focus on capitalizing on momentum when a stock's price moves beyond a pre-defined support or resistance level. These "breakout" moments happen due to shifts in market sentiment. A surge of buyers or sellers pushes the price past these key barriers, creating significant price swings and potential profit.
Imagine a stock trading within a defined range for several days. This consolidation period represents a balance between buyers and sellers. A positive news event or a shift in market sentiment can suddenly tip the scales. The influx of buyers creates upward pressure, possibly causing a breakout above the resistance level.
Understanding the Herd Mentality in Breakouts
This surge is often amplified by the herd mentality. Traders see others buying and jump in, fearing they'll miss out. This fuels the breakout's momentum, leading to rapid price increases. Breakout trading strategies aim to capture these powerful moves.
However, not all breakouts are equal. Understanding the psychology behind them is key for differentiating true breakouts from false signals. This requires analyzing the historical context of support and resistance levels and the volume accompanying the breakout.
Historically, breakout trading strategies have been effective. One example is the Opening Range Breakout (ORB) tactic. Developed by Arthur Merrill in the 1960s, the ORB strategy uses the initial price range of a trading session to predict potential price movements. Toby Crabel further popularized it in the 1990s, demonstrating its applicability across stock and forex markets. While the ORB's efficacy has diminished due to increased market awareness and competition, it remains a foundational strategy, showcasing the enduring appeal of breakout trading principles. Learn more at Quantified Strategies.
Identifying the Right Market Conditions
The broader market context also impacts breakout success. A breakout during high market volatility can be less reliable than one during relative calm. Volatile markets are prone to sudden price swings, increasing the likelihood of false breakouts.
The type of market participants involved also matters. A breakout driven by institutional investors is generally considered more robust than one driven by retail traders. Institutional investors trade larger volumes and hold positions longer, providing more support for the price move.
Understanding these aspects of market psychology is essential for maximizing success with breakout trading. This involves careful observation, technical analysis, and interpreting market sentiment. By combining these skills, traders can identify high-probability breakout setups and capitalize on the resulting momentum.
Building High-Probability Breakout Setups That Convert
A successful breakout trading strategy requires more than just identifying chart patterns. It demands understanding the factors driving true breakouts, separating them from misleading market fluctuations. This involves examining several elements, including volume confirmation and overall market structure.
Identifying High-Potential Consolidation Patterns
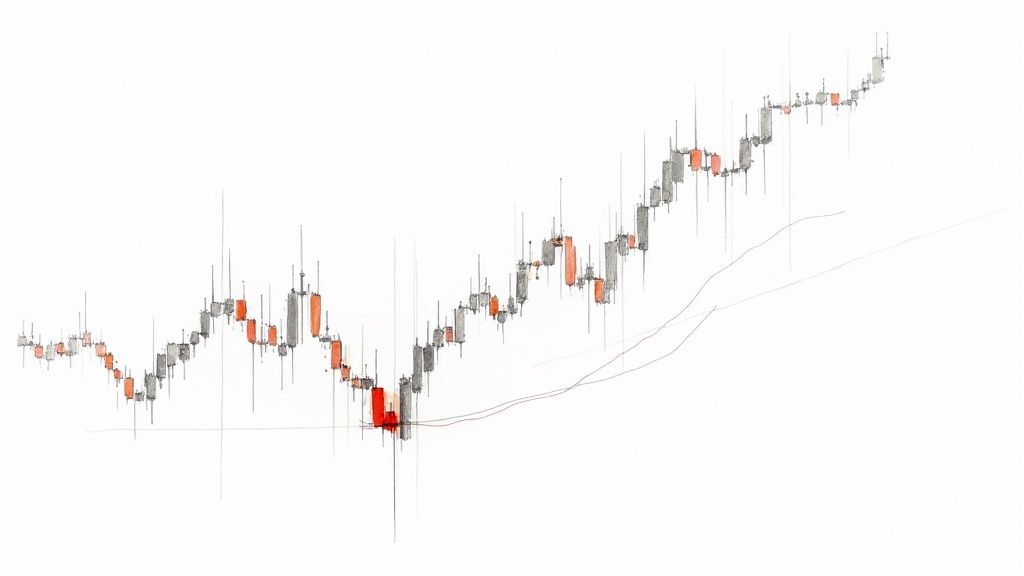
Before a breakout, an asset's price typically consolidates. Consolidation involves minor price swings within a specific range, showing a balance between buyers and sellers. Recognizing these patterns is key to anticipating breakouts.
Some common consolidation patterns include:
-
Triangles: These form from converging trend lines, showing narrowing price action. Breaking out from a triangle often leads to a significant price move in the trend's direction.
-
Rectangles: Defined by horizontal support and resistance lines, rectangles represent market indecision. A breakout often signals the previous trend resuming.
-
Flags and Pennants: Appearing after a sharp price move, these resemble small triangles or rectangles on the main trend, suggesting a pause before the trend continues.
The Role of Volume in Breakout Confirmation
Volume is crucial for confirming breakout validity. A breakout with significantly increased volume suggests strong conviction and a higher probability of continuation. Low-volume breakouts are often unreliable and can reverse.
This means traders should watch volume with price action to identify real breakouts from false breakouts, or "fakeouts." These fakeouts often trap less experienced traders. Elite traders use indicators like the Volume Weighted Moving Average (VWMA) and On-Balance Volume (OBV) to gauge the strength of price moves. A high-volume breakout suggests strong market participation and a higher chance of a sustained move. Low-volume breakouts often fail due to lack of commitment. This highlights the importance of market psychology in breakout strategies. Ithy offers further insights into elite breakout trading strategies.
To further illustrate the importance of volume analysis, let's examine a few key indicators:
Volume Indicators for Breakout Confirmation
| Indicator | Confirmation Method | Best Market Application | Signal Reliability |
|---|---|---|---|
| Volume Weighted Average Price (VWAP) | Price closing above VWAP with increasing volume | Intraday and short-term trading | Moderate |
| On-Balance Volume (OBV) | OBV rising alongside price during breakout | Trending markets | Moderate to High |
| Accumulation/Distribution Line (A/D) | A/D line confirming price breakout | All market conditions | High |
This table shows how different volume indicators can help confirm breakouts, highlighting their strengths and weaknesses. Using these indicators in conjunction with price action analysis can greatly enhance breakout trading accuracy.
Timeframe Considerations for Breakout Trading
Your chosen timeframe significantly affects reliability. Shorter timeframes (1-minute or 5-minute charts) are prone to noise and false breakouts. Longer timeframes (daily or weekly charts) offer clearer signals and more reliable breakouts.
However, longer timeframes require patience and larger stop-loss orders. Choose a timeframe matching your trading style, risk tolerance, and time commitment. Day traders might use hourly charts, while swing traders might prefer daily or weekly charts. Finding the right timeframe helps identify promising breakout opportunities and filter out unreliable signals. This is essential for a robust breakout trading strategy.
Pro-Level Breakout Trading Techniques That Outperform
While many traders grasp the basics of breakout trading, achieving consistent profits demands more advanced techniques. This involves moving beyond simply identifying support and resistance. It means integrating tools and strategies to gain a true advantage.
Multi-Timeframe Analysis for Breakout Confirmation
One crucial technique is multi-timeframe analysis. This involves studying price action across different chart timeframes to validate a breakout. For example, a breakout on a 1-hour chart gains credibility if confirmed by a similar breakout on a 4-hour or daily chart.
This alignment across multiple timeframes substantially increases the likelihood of a sustained price movement. Analyzing higher timeframes also reveals broader market trends and context, giving a more complete picture of potential breakout opportunities.
Order Flow Techniques to Identify Institutional Participation
Professional traders often employ order flow techniques to understand the market forces behind a breakout. Order flow analysis involves studying the actual buy and sell orders in the market. This provides a glimpse into the activities of large institutional investors.
A surge in buy orders at a key resistance level, for instance, could indicate substantial institutional buying pressure. This increases the chance of a successful breakout. This information is vital for anticipating breakouts and gauging their strength.
Combining Breakout Trading With Complementary Strategies
Combining breakout trading with other strategies can boost profitability. Incorporating momentum indicators, such as the Relative Strength Index (RSI), helps identify stocks with strong momentum, increasing the chances of a profitable breakout.
Similarly, using volume analysis can confirm breakout strength. High volume often suggests strong market participation. These combined approaches create a more robust and precise method for capitalizing on breakout opportunities.
Algorithmic breakout trading, using computer programs to automate trade identification and execution, is also growing in popularity. Traders utilize tools like Pandas and NumPy to analyze historical prices and find recurring patterns that suggest profitable breakouts. A moving average crossover, for example, can signal a potential breakout. This automated approach allows for quick execution and precise risk management. Learn more about breakout trading strategies here.
Adapting to Different Market Regimes
Successful breakout traders adapt their methods to varying market conditions. During periods of high volatility, breakouts can be less reliable, demanding tighter stop-loss orders and more cautious position sizing.
Conversely, calmer markets can allow for wider stop-loss orders and larger positions. Adaptability is key for long-term success.
Identifying Lesser-Known Breakout Patterns
Beyond familiar patterns like triangles and rectangles, experienced traders seek less common patterns that offer exceptional risk-reward ratios. These could include ascending triangles, descending triangles, or flags and pennants.
Early identification allows traders to profit from breakouts before they're widely recognized. This proactive approach allows for capturing more of the price move. Combining this proactive identification with the other techniques discussed elevates a breakout strategy, increasing the probability of consistent outperformance.
Risk Management Tactics That Protect Your Capital

Even the best breakout trading strategies require a careful approach to risk management. This is where discipline truly comes into play. By learning from experienced traders, we can explore practical ways to manage position sizing, improve stop-loss placement, and navigate the emotional complexities of breakout trading.
Position Sizing: Balancing Risk and Reward
Position sizing is essential for long-term trading success, especially in breakout trading. It involves deciding how much capital to risk on each trade, finding the right balance between potential profits and acceptable losses. The fixed-fractional method is a common technique. With this method, a trader risks a fixed percentage of their account on every trade, usually between 1% and 2%.
For instance, a trader with a $10,000 account and a 1% risk tolerance would risk a maximum of $100 on each trade. This approach limits potential losses while still allowing for substantial gains if the breakout is successful. It also safeguards capital during inevitable losing streaks, which happen even with the best strategies.
Advanced Stop Placement Techniques
Stop-loss orders are fundamental for limiting losses when a breakout fails. However, traditional fixed stop-losses can be problematic in volatile markets, often leading to early exits from potentially profitable trades. Dynamic stop-loss orders, which adjust based on market fluctuations, offer a more flexible solution.
One method involves setting the stop-loss just below the recent swing low prior to the breakout. Another strategy uses a multiple of the Average True Range (ATR), a standard volatility indicator. A trader might use a stop-loss of two times the ATR below the entry price, adjusting it as volatility changes. This adaptive approach provides better protection while minimizing unwanted exits. For more information, check out this resource: How to master day trading risk management.
Strategic Scaling for Entries and Exits
Scaling in and out of trades is another powerful technique used by professional traders. Scaling in means entering a position gradually as the breakout unfolds, confirming its strength while reducing risk on false breakouts. Scaling out involves taking profits at different price levels, locking in gains and reducing exposure to reversals.
This measured approach allows traders to adapt to the breakout's progression, optimizing both entry and exit points. It provides flexibility and control, crucial elements of sophisticated risk management.
Psychological Discipline in Breakout Trading
Breakout trading presents unique emotional challenges. The potential for large profits can tempt traders to overtrade and take excessive risks. Conversely, losing streaks can trigger fear and hesitation, causing missed opportunities. Maintaining psychological discipline is key.
This means developing a well-defined trading plan, setting realistic goals, and following predetermined risk management rules. Keeping a trading journal and regularly reviewing performance can help identify emotional biases and improve decision-making. This objective approach allows traders to navigate breakout trading with a rational mindset, maximizing their chances of long-term success.
This table outlines how to adjust risk parameters for breakout trades based on different market environments and volatility conditions.
| Market Type | Position Size | Stop Placement | Take Profit Strategy | Risk-Reward Ratio |
|---|---|---|---|---|
| Low Volatility | 1% of account | 1 ATR below entry | 2 ATR above entry | 2:1 |
| Medium Volatility | 1.5% of account | 1.5 ATR below entry | 3 ATR above entry | 2:1 |
| High Volatility | 2% of account | 2 ATR below entry | 4 ATR above entry | 2:1 |
The table above provides a framework for adjusting risk management parameters based on market volatility. Remember to adapt these guidelines to your specific trading style and risk tolerance. Disciplined risk management is crucial for long-term success in breakout trading.
Validating Your Breakout Trading Strategy Through Testing
A robust breakout trading strategy requires thorough testing. Successful traders validate their strategies before risking capital. This involves backtesting, establishing clear rules, and analyzing performance metrics.
Methodologies for Effective Backtesting
Backtesting helps you understand how your strategy would have performed historically. It reveals potential strengths and weaknesses. There are several approaches:
-
Manual Chart Analysis: This involves reviewing charts and manually applying your strategy's rules. It's time-consuming but offers a deep understanding of market interaction.
-
Automated Backtesting Software: Software like Trade Ideas automates backtesting, allowing you to test across larger datasets and diverse market conditions. This saves time and reduces human error. You might also be interested in: How to master backtesting your trading strategy.
-
Hybrid Approach: Combining manual analysis with automated tools offers a balanced approach. This allows for both in-depth examination and broad scenario testing.
Establishing Clear Rules and Eliminating Subjectivity
A well-defined strategy needs objective rules for entries, exits, and risk management. This removes emotional decision-making.
-
Entry Rules: Define specific entry criteria, such as price breaking above resistance with increased volume.
-
Exit Rules: Establish clear exit rules for profits and losses, like a target price or a trailing stop-loss order.
-
Risk Management Rules: Determine position size and maximum risk per trade, often using a fixed percentage of your account balance.
Performance Metrics That Truly Matter
Evaluating a strategy involves more than just the win rate. Other metrics provide a fuller picture.
-
Expectancy: This measures the average profit or loss per trade, considering both win rate and average profit/loss for wins and losses. A positive expectancy suggests long-term profitability.
-
Maximum Drawdown: This represents the largest peak-to-trough decline in your account balance, helping you assess potential risks.
-
Recovery Factor: This measures how quickly your account recovers from drawdowns. A higher factor suggests greater resilience.
Addressing Common Testing Pitfalls and Continual Refinement
Backtesting has limitations. Be mindful of potential pitfalls.
-
Over-optimization: Fitting your strategy too closely to historical data can create a false sense of security, leading to poor live trading performance.
-
Ignoring Market Regime Changes: Markets change. A historically successful strategy may not suit current conditions.
-
Lack of Forward Testing: Forward testing, applying your strategy to new data, is crucial for validating its robustness.
Continuously refine your strategy based on testing and market feedback. This allows adaptation to changing conditions and improves long-term performance. By incorporating these principles, you can develop a more robust breakout trading strategy.
Real-World Breakout Trades That Delivered Results
Moving from theory to practice, let's analyze real-world breakout trades across various markets. We'll examine specific examples from stocks, forex, and cryptocurrencies, breaking down each trade from setup to execution and management. This practical application will solidify the principles we've discussed.
Example 1: Stock Breakout in Tesla (TSLA)
Tesla is known for its price volatility, which often presents breakout opportunities. Imagine TSLA consolidating between $200 and $210 for several weeks. Then, a positive earnings report triggers a surge in buying volume, pushing the price above $210.
This breach of resistance, coupled with high volume, signals a potential breakout. A trader enters a long position at $212, placing a stop-loss order at $208, just below the previous resistance level, which now acts as support. The target price is set at $225, based on anticipated upward momentum. The stock reaches the target within days, resulting in a profitable trade.
Example 2: Forex Breakout in EUR/USD
The EUR/USD currency pair offers another illustrative example. Suppose the pair trades within a range of 1.1000 to 1.1050. A sudden shift in economic sentiment favors the Euro, leading to increased buying pressure. The pair breaks above 1.1050 with strong volume.
A trader, recognizing this breakout, enters a long position at 1.1060. A stop-loss order is placed at 1.1040, just below the newly established support level. With a target of 1.1100, the trade unfolds as predicted. The pair hits the target, demonstrating a classic forex breakout.
Example 3: Cryptocurrency Breakout in Bitcoin (BTC)
The cryptocurrency market, known for its inherent volatility, often presents breakout opportunities. Consider Bitcoin consolidating between $30,000 and $32,000. Positive news regarding institutional adoption fuels strong buying activity. BTC surges past $32,000 with significant volume.
A trader enters a long position at $32,500, anticipating further upward price action. A stop-loss is placed at $31,500 to mitigate potential losses. With a target price of $35,000, the trade captures a significant portion of the upward movement.
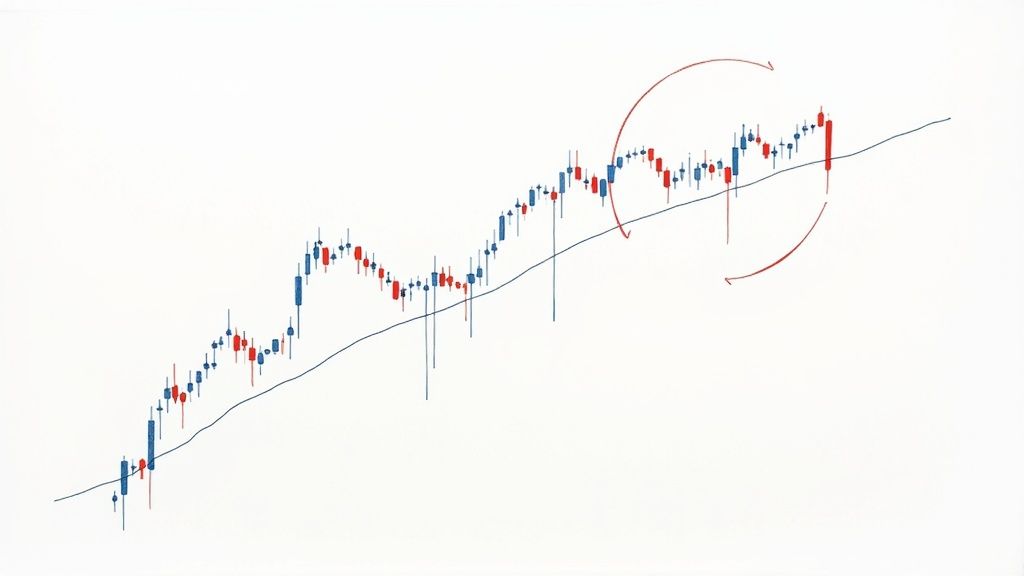
Analyzing False Breakouts: Learning From Mistakes
Not all breakouts lead to profits. A stock might break above resistance with initial volume, only to quickly reverse and fall back within the previous range. This false breakout can trap traders, triggering stop-loss orders. Analyzing these failures is crucial for learning and improving your breakout trading strategy.
A false breakout in a hypothetical stock XYZ, for example, might reveal insufficient buying volume or negative news released shortly after the initial price surge. Recognizing these patterns can help traders avoid similar situations in the future.
Adapting to Market Conditions: The Key to Consistent Results
Professional traders understand the importance of adapting to different market environments. During periods of high volatility, tighter stop-loss orders are essential to manage risk and protect against rapid price swings. Conversely, during periods of low volatility, wider stop-losses may be necessary to avoid being prematurely stopped out of potentially profitable trades.
Combining technical analysis with an understanding of the broader market context enhances the probability of successful breakout trades. This involves considering market trends, economic indicators, and news events that might influence specific assets. For example, a positive economic report could strengthen a breakout in a related stock, while negative news might weaken it.
By integrating these factors, traders can develop a more nuanced and adaptable approach to breakout trading, improving their likelihood of consistent success. These real-world examples and insights provide practical guidance for applying breakout trading strategies.
Ready to elevate your trading? Check out ChartsWatcher today! Discover the power of ChartsWatcher.
