Profit from Unusual Volume in Stocks
Decoding Unusual Volume: The Hidden Signal
Unusual volume in stocks can act as a significant alert for traders, hinting at potential market shifts. It's a key indicator that something important might be happening behind the scenes. But what exactly does this surge in trading activity tell us? This section explores the meaning behind unusual volume, examining how it offers insights into market psychology and the actions of institutional investors.
Understanding The Significance of Volume Spikes
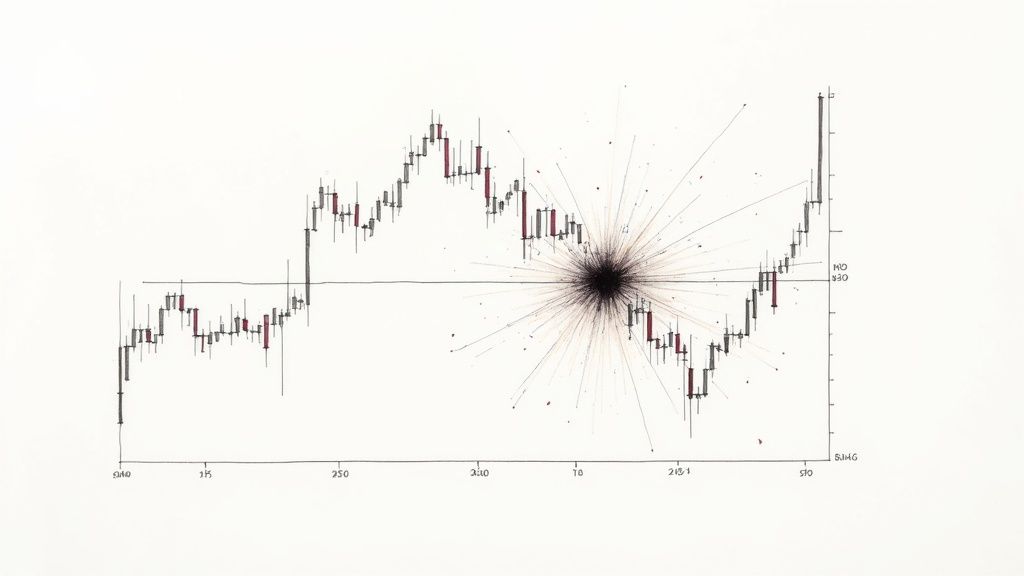
Volume spikes, or periods of unusual volume, represent a noticeable change from a stock's typical trading activity. This sudden rise in the number of shares traded often comes before major price movements. This means understanding and interpreting unusual volume can provide valuable clues about where the market might be headed. These spikes create opportunities that many retail investors miss. For instance, a quick surge in volume could signal that institutional investors are accumulating a stock, hinting at a possible upward trend.
Unusual volume often happens because of important events or news releases. As an example, Delcath Systems Inc. (NASDAQ: DCTH) saw a massive jump in trading volume, increasing by 13,568% in a single day after receiving FDA approval for its Hepzato Kit device. This approval led to a price jump of 91% that same day, showing how regulatory news can influence both unusual volume and stock prices. Events like this highlight the importance of keeping an eye on stock screeners and news sources to spot potential triggers for unusual volume. You can learn more about unusual volume stocks here.
Distinguishing Between Noise and True Signals
It's important to remember that not all volume spikes are equal. We need to separate meaningful volume changes from random market fluctuations. One way to do this is by looking at the relative volume ratio, which compares the current volume to the average volume over a set time. A high relative volume suggests unusual activity. Looking at benchmarks within a specific sector can also help figure out if a volume spike signals real interest or just normal price fluctuation.
Identifying Accumulation and Distribution Patterns
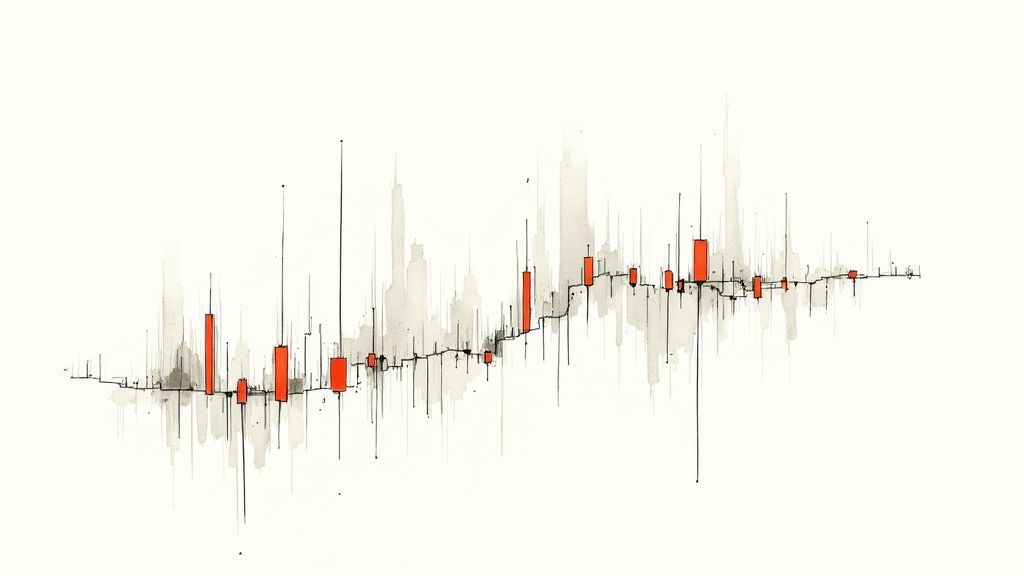
Experienced traders use volume patterns to decide when to buy and sell. Accumulation happens when institutions quietly purchase large amounts of a stock, often shown by increased volume along with a gradual price increase. On the other hand, distribution means institutions are selling their holdings, usually accompanied by high volume and falling prices. Recognizing these patterns is key to understanding unusual volume. For example, a stock with high volume but little price change might be in an accumulation phase, while a stock with high volume and a sharp price drop could be in distribution. Using tools like ChartsWatcher, traders can get a better understanding of these subtle volume cues and make more informed decisions.
Volume Catalysts: What Drives the Surge
While earnings announcements often drive unusual volume in stocks, they aren't the only factor. Many things can trigger these significant shifts in trading activity. Understanding these catalysts is key to identifying profitable trading opportunities. This involves understanding the psychology behind large-scale buying and how news events impact different market sectors.
News and Events: The Primary Drivers
Major news events often spark unusual volume. This can include anything from regulatory decisions and product announcements to mergers and acquisitions. For example, a pharmaceutical company receiving FDA approval for a new drug might experience a massive surge in trading volume. Unexpected geopolitical events or major economic shifts can also trigger substantial market reactions and unusual volume across various sectors.
Staying informed about current events and their potential impact on different stocks is essential. Powerful Market Maker Signals for Smart Trading offers further insights into this dynamic. Different news types impact specific market sectors differently. Regulatory changes in the biotech industry, for instance, will have different consequences than similar news affecting tech stocks.
Analyst Ratings and Upgrades: A Double-Edged Sword
Analyst upgrades and downgrades can also fuel unusual volume. However, the effects of these ratings can vary. Some analyst revisions generate sustained momentum, while others quickly fade. This is because the market assesses the analyst's credibility and track record, along with the company's fundamentals.
Understanding the context surrounding analyst ratings is crucial for interpreting unusual volume. A highly respected analyst upgrading a fundamentally sound company is more likely to create sustained buying pressure than a less credible analyst upgrading a struggling company. Combining careful analysis of analyst ratings with volume analysis can lead to better trading decisions.
Institutional Buying: The Whale in the Water
A primary driver of unusual volume is institutional buying. When large institutions like mutual funds or hedge funds accumulate a stock, their buying power can dramatically increase trading activity. Their impact on the market is substantial.
This institutional buying often creates a self-reinforcing cycle. As the price rises due to increased demand, it attracts more attention and investment, leading to even higher volume and price appreciation. Recognizing these patterns of institutional accumulation is key to capitalizing on unusual volume before the broader market reacts. Analyzing volume alongside other market indicators provides valuable insights into institutional behavior and potential market trends.
The following table summarizes some of the major catalysts for unusual volume, their typical impact on price and volume, and the expected duration of the effect.
Major Catalysts for Unusual Volume
This table presents the primary catalysts that trigger unusual volume in stocks and their typical impact on price and volume patterns
| Catalyst Type | Average Volume Increase | Typical Price Movement | Duration of Effect |
|---|---|---|---|
| Major News/Events (e.g., FDA approval, mergers) | Can range from 50% to over 200% depending on significance | Can be positive or negative, often sharp initial movement | Can last from a few days to several weeks |
| Analyst Upgrades/Downgrades | Typically 20% to 50% increase | Can be positive or negative, often less dramatic than news events | A few days to a week, unless reinforced by fundamentals |
| Institutional Buying | Gradual but substantial increases over time, can be 25% to 100% or more | Generally positive, creates sustained upward pressure | Weeks to months, can drive long-term trends |
This table illustrates how different catalysts can influence both volume and price. While news events often cause dramatic short-term spikes, institutional buying can lead to sustained trends. Analyzing these patterns helps traders understand market dynamics and identify potential opportunities.
Options Volume: Seeing Tomorrow's Moves Today
While stock charts offer a look at the past, options activity provides a glimpse into what might lie ahead. Unusual volume in stocks is helpful, but unusual options volume can be even more insightful, hinting at potential price swings. Analyzing this activity can offer a unique understanding of institutional positioning and possible market movements before they affect stock prices.
Decoding Call and Put Volume
Understanding the difference between call options and put options is crucial. Heavy call accumulation, meaning a large number of call options are purchased, often suggests bullish sentiment. Investors believe the underlying stock's price will go up. On the other hand, unusual put volume could signal bearish sentiment, pointing to an expected price decline.
For instance, a sudden surge in call options with a specific strike price (the price at which the option can be exercised) can indicate institutional investors believe the stock will climb above that level. Heavy put volume at a particular strike price might suggest the opposite – an expectation of a drop below that price.
Expiration Dates and Timing
The expiration date of options contracts matters when interpreting unusual volume. A significant volume of options expiring soon suggests traders are anticipating a price move within that timeframe. The shorter the time to expiry, the more immediate the anticipated price action. Studying the relationship between expiration dates and volume helps fine-tune market timing predictions.
The timing of unusual options volume relative to big market moves is also key. A surge in call volume just before a significant price jump supports the idea that options activity can be predictive. Conversely, heavy put volume before a price drop reinforces its bearish signal.
Hedging Vs. Speculative Positioning
Not every instance of unusual options volume predicts a price movement. Sometimes, it represents hedging activity, meant to protect existing investments. Separating hedging from speculative positioning is important for accurate interpretation. The volume-to-open-interest ratio is a useful metric here. A high ratio suggests speculative activity, while a lower ratio might indicate hedging. This is particularly important for understanding how institutions are managing their large portfolios. Unusual options volume offers potential trading opportunities. Platforms like Market Chameleon offer reports on this, highlighting stocks with unusually high options trading volume compared to their averages. This relative volume ratio helps identify stocks attracting significant interest, which can be tied to upcoming events like earnings announcements or mergers. For instance, if a stock's option volume doubles its average, this increased activity might indicate investor excitement or anticipation of a major news release. Analyzing both volume and open interest provides a detailed view of market sentiment.
Volume Detection Arsenal: Tools That Give You an Edge
Identifying unusual volume in stocks requires more than a quick glance at the charts. It demands the right tools to filter out the noise and identify real opportunities. This means access to platforms with real-time data, customizable alerts, and insightful analysis. This section explores the essential tools professional traders use to gain an edge.
Real-Time Scanners: The Heart of Volume Analysis
Real-time scanners are crucial for spotting unusual volume as it happens. They allow traders to react quickly to emerging opportunities. These tools constantly monitor the market. They deliver up-to-the-second data on volume and price changes. This immediacy is essential for taking advantage of fast-moving markets.
For example, a sudden volume spike could indicate a breakout. A real-time scanner lets traders enter a position before the move gains full momentum.
Not all “real-time” scanners are equal, however. Some free tools offer delayed data or infrequent updates. This can hinder your ability to react effectively. Professional traders often invest in premium platforms. These offer true real-time data and customizable alert settings.
Filtering the Noise: ETF Rebalancing and Dividends
Unusual volume isn’t always a sign of genuine market interest. Factors like ETF rebalancing and dividend capture strategies can create misleading signals. ETF rebalancing involves adjusting the holdings of an ETF to match its underlying index. This can lead to temporary volume spikes in certain stocks. Similarly, investors buying stocks before the ex-dividend date to capture the dividend can also create artificial volume increases.
Professional traders use advanced filtering techniques. These help to identify and disregard these false signals, allowing them to focus on genuine indicators of market sentiment. This might involve setting minimum volume thresholds. It could also mean excluding stocks with upcoming dividend payments from their scans.
Sector Rotation and Relative Volume Comparisons
Identifying sector rotation—where money flows from one sector to another—is another key application of volume analysis. Platforms that allow for relative volume comparisons between sectors can highlight emerging trends. This means comparing the current volume of a stock to its average volume. It also involves comparing the volume activity of different sectors. A surge in volume in one sector, combined with declining volume in another, could indicate a sector rotation in progress.
These insights allow traders to position themselves for potential gains. They can benefit as money flows into new market sectors. Learn more about sector rotation and other analysis techniques in our article about Top Stock Market Analysis Tools for Pro Traders.
Custom Alerts and Risk Tolerance
The best volume analysis tools allow for custom alerts. These alerts align with individual trading styles and risk tolerance. This might involve setting alerts for certain volume thresholds, price changes, or technical indicators.
For example, a day trader might set alerts for high relative volume combined with a breakout above a key resistance level. A longer-term investor might focus on sustained volume increases over several days or weeks. By configuring personalized alerts, traders can focus on the most relevant opportunities. They also filter out unnecessary distractions. This focused approach streamlines decision-making. It increases the probability of successful trades.
To help you choose the best platform for your needs, we’ve compiled a comparison of several popular volume scanning tools:
Volume Scanning Tools Comparison
A detailed comparison of the most effective tools for tracking unusual volume in stocks, including features, costs, and limitations
| Platform | Real-Time Capabilities | Customization Options | Cost | Best For |
|---|---|---|---|---|
| Scanz | Yes | Highly Customizable | Varies by plan | Day Traders, Swing Traders |
| Trade Ideas | Yes | AI-driven alerts, custom filters | Varies by plan | Active Traders |
| Benzinga Pro | Yes | Real-time news and alerts | Varies by plan | All Trading Levels |
| Stock Rover | Yes | 650+ metrics, historical data | Varies by plan | Professional Investors |
| TradingView | Yes (paid plans) | Customizable watchlists and alerts | Free to $49.95/month | Charting and Technical Analysis |
This table summarizes key features and costs to help you find a tool that matches your trading style and budget. Remember to research each platform thoroughly before making a decision. You might be interested in: How to master using stock scanners effectively. This customization allows traders to respond efficiently to market changes and maintain control over their portfolios.
Volume-Based Trading Strategies That Actually Work
Moving past basic volume analysis unlocks a world of more advanced trading strategies. These strategies consistently find profit in unusual stock volume. Professional traders use refined approaches suited to different market conditions. This section explores some of these techniques, providing insights into their mechanics and optimal application.
High-Volume Breakout Strategies
One of the most effective applications of volume analysis is identifying high-volume breakouts. This happens when a stock’s price moves through a key support or resistance level with unusually high trading volume. The increased volume acts as confirmation, suggesting real conviction behind the price action.
Imagine a stock trading within a set price range for several weeks. If the price suddenly jumps above the upper limit of the range (resistance) with a significant volume spike, this signals a possible breakout. The high volume suggests strong buying pressure, increasing the chance of continued upward movement.
Proper timing is everything. The ideal entry point for a breakout trade depends on the move's nature. In a trending market, entering shortly after the initial breakout can be advantageous. This confirms the breakout's legitimacy. However, in a countertrend move, waiting for a pullback after the initial spike and high volume offers a safer entry and a better risk-reward ratio.
Volume-Based Position Sizing
Many professional traders use volume to determine position size. This tactic, known as volume-based position sizing, connects the capital invested in a trade to the stock's trading volume. The core idea is to allocate more capital to high-volume, high-conviction trades and less to lower-volume trades with weaker signals.
This method involves calculating the stock’s average volume over a specific timeframe. A percentage of that average volume then determines the position size for a particular trade. This approach ensures appropriate sizing for trades in volatile stocks with unusual volume, managing risk effectively while maximizing profit potential.
Volume Profile Analysis in Trend Identification
The volume profile – a visual representation of trading activity at different price points – is a valuable tool. It offers a look into how volume shifts during trend continuation and exhaustion. This helps traders differentiate between a real opportunity and a potential trap.
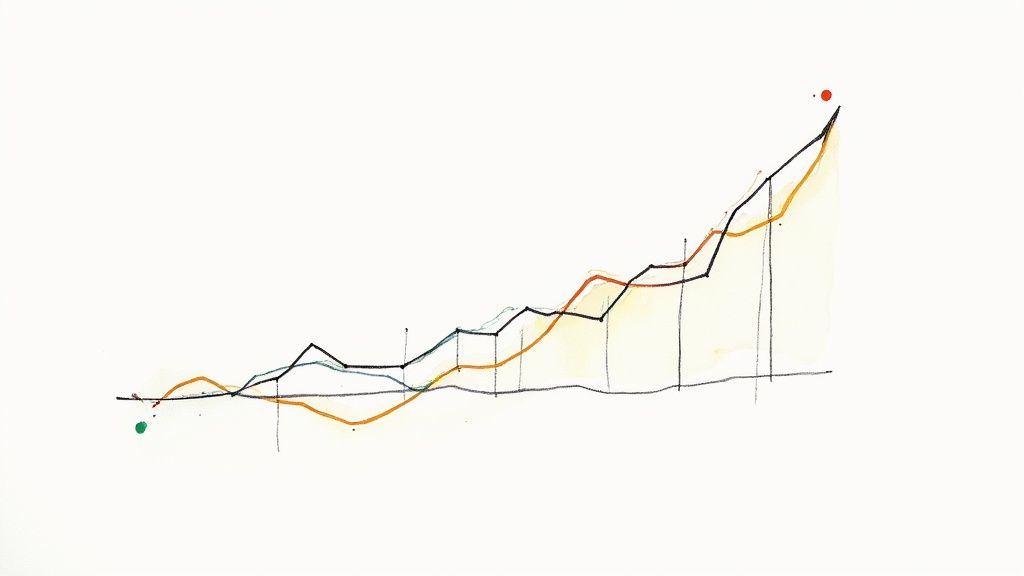
In a healthy uptrend, volume usually increases during rallies and decreases during pullbacks. However, a significant volume spike during a pullback might suggest accumulation, signaling potential trend continuation. Conversely, dwindling volume during upward price movement could mean weakening momentum and signal a potential trend reversal.
Specific indicators, like the On-Balance Volume (OBV), help identify these changes in volume patterns. OBV measures cumulative buying and selling pressure. It does this by adding or subtracting volume based on how the closing price relates to the previous day's close. Divergences between price and OBV can be early warnings of trend exhaustion. For example, if the price hits new highs but OBV doesn't, it might indicate underlying weakness despite the apparent upward momentum. These tools and techniques provide a more nuanced approach to understanding and leveraging unusual stock volume, helping traders refine strategies and boost their success rates.
Real Money Case Studies: Volume Signals in Action
Understanding unusual volume in stocks requires more than just theory. Examining real-world examples helps solidify the concepts and reveals the practical application of volume analysis. This section delves into recent unusual volume events, exploring how these spikes created significant profit opportunities (or resulted in losses).
Case Study 1: The Biotech Breakout
One recent example involves a small-cap biotech company that announced positive clinical trial results for a new cancer drug. The news triggered a massive surge in volume, with trading activity increasing five times its normal average.
This unusual volume preceded a substantial price jump of over 30% within just two days. A trader using a real-time scanner like ChartsWatcher, set to alert on high relative volume in the biotech sector, could have identified this opportunity early. Buying the stock at the first sign of unusual volume would have resulted in a significant profit.
Case Study 2: The Tech Trap
Not all unusual volume leads to profits. A large-cap tech company experienced a sudden volume spike after rumors of a potential acquisition. The volume surged, and the price initially jumped over 10%.
However, the acquisition fell through, and the price plummeted, erasing the initial gains and then some. This situation illustrates the importance of considering multiple factors, not just volume. Analyzing options activity might have revealed skepticism about the acquisition, hinting at the potential for a reversal.
Case Study 3: The Quiet Accumulation
In a less dramatic but equally profitable scenario, a mid-cap industrial company experienced a gradual increase in volume over several weeks, even though the price remained relatively stable. This subtle but sustained unusual volume signaled accumulation by institutional investors.
A trader using a tool like ChartsWatcher to track both volume and price could have spotted this accumulation phase. Entering a position during this period would have captured substantial profits as the stock price eventually broke out to the upside, fueled by continued institutional buying.
Comparing Different Market Scenarios
Unusual volume presents itself differently across various market conditions. In small-cap stocks, volume spikes tend to be more dramatic and volatile than in large-cap stocks. This is due to the lower liquidity and higher price sensitivity of smaller companies.
During bull markets, unusual volume often confirms upward momentum. However, in corrective markets, it can precede sharp declines as investors rush to sell.
Trading Parameters and Risk Management
Each of these case studies highlights the importance of well-defined trading parameters. This includes precise entry criteria, stop-loss orders, and profit-taking targets. Using specific scanner settings on a platform like ChartsWatcher can identify opportunities and help manage risk.
For instance, in the biotech breakout scenario, a trader might have set a stop-loss order just below the breakout point to limit potential losses if the move reversed. Similarly, profit-taking targets based on projected price movements or technical resistance levels would have helped secure profits.
Ready to turn unusual volume insights into profitable trades? Explore ChartsWatcher today and discover how our powerful scanning tools can help you identify real-time opportunities and stay ahead of the market. Visit ChartsWatcher now to learn more and start your free trial.
