Top Stock Market Analysis Tools for Pro Traders
Unlocking Market Insights
Successfully navigating the stock market’s complexities requires more than intuition. It demands well-informed decisions based on thorough analysis. The tools we use to analyze financial data, from predicting trends to evaluating individual stock performance, directly impact our success.
Understanding these analytical concepts and strategies is crucial for anyone serious about market participation. This holds true whether you're a seasoned professional at a large firm, a day trader using stock scanners and screeners, or an individual investor building a portfolio.
The Evolution of Stock Market Analysis
The evolution of stock market analysis tools reflects the market’s own evolution. From the basic charting techniques of early traders to today's sophisticated algorithms and AI-driven platforms, the pursuit of an advantage has consistently fueled innovation.
Historically, access to information was a key differentiator. However, in our current data-rich environment, effective analysis depends on the ability to filter, interpret, and apply that information strategically. The hallmark of a truly effective approach is its ability to combine robust data processing with insightful interpretation, resulting in actionable insights.
Exploring the Top Analysis Tools
In this guide, we'll explore the 10 best stock market analysis tools available in 2025, empowering you to gain valuable market insights and enhance your trading strategies. We will cover a variety of platforms, catering to different investment styles and levels of experience.
From fundamental analysis to technical indicators and beyond, we'll provide a comprehensive overview. By the end, you'll clearly understand each tool's strengths and weaknesses, enabling you to choose the perfect fit for your needs and maximize your potential for success.
ChartsWatcher: A Deep Dive Into A Powerful Trading Platform
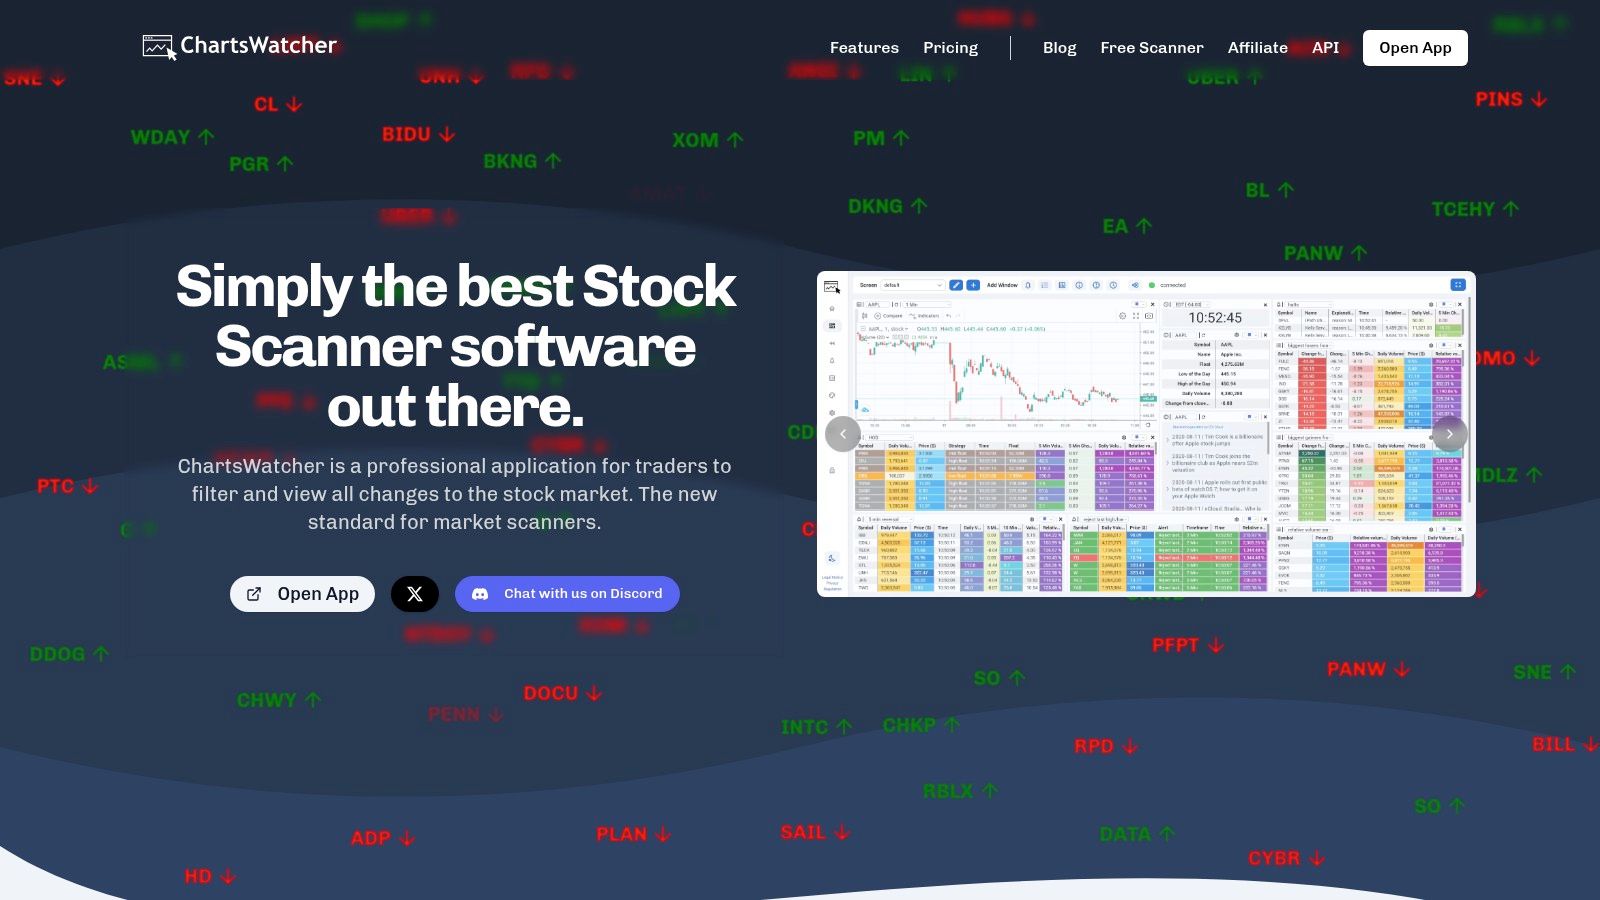
ChartsWatcher is a professional stock market scanning platform built for serious traders. It offers a highly customizable and dynamic approach to market analysis. This sophisticated suite of tools caters to professional traders, market analysts, financial institutions, and active day traders. ChartsWatcher's strength lies in its real-time data analysis, backtesting capabilities, and incredibly flexible user interface.
Imagine a trading dashboard displaying exactly the information you need, precisely when you need it. ChartsWatcher makes this a reality. Users can create multiple dashboards, each populated with customizable tiles. These tiles can display real-time charts, watchlists, news feeds, alerts, top lists, and key data insights. This level of granular control allows traders to monitor specific stocks, sectors, or broader market trends with laser focus.
For example, a day trader focused on momentum stocks could create a dashboard showing real-time price charts, Level 2 data, and news alerts related to their chosen stocks. A long-term investor might prefer a different dashboard. Theirs could focus on fundamental data, earnings reports, and analyst ratings.
Advanced Features For Serious Traders
Beyond customizable dashboards, ChartsWatcher offers advanced filtering and scanning tools. These tools help users sift through large amounts of market data and identify potential trading opportunities. The platform's backtesting feature lets traders test their strategies against historical data. This allows them to refine their approach before risking real capital. The ability to import and export configurations also facilitates collaboration and the sharing of successful trading setups.
Key Features & Benefits:
- Highly Customizable Dashboards: Tailor your workspace with drag-and-drop tiles displaying charts, alerts, news, and more.
- Advanced Scanning & Filtering: Uncover opportunities using over 50 customizable alerts and filters based on technical and fundamental indicators.
- Real-time Data & Backtesting: Access live market data and test trading strategies against historical performance.
- Multiple Watchlists & Alerts: Track multiple portfolios and receive instant notifications on price movements, news events, and indicator triggers.
- Flexible Pricing: Choose the plan that fits your needs, from a free basic package to a Pro Plan at $74.99/month (billed annually).
- Light & Dark Themes: Personalize your viewing experience for optimal comfort.
- Import/Export Configurations: Share and replicate successful trading setups effortlessly.
Weighing the Pros and Cons
Pros:
- Highly customizable dashboards and screen configurations for personalized market analysis.
- Advanced scanning tools with real-time data, backtesting, and detailed alerts.
- Flexible pricing plans including a free basic package.
- Robust, professional-grade features suited for both stock and currency trading.
- User-friendly themes (light and dark) and seamless import/export functionality.
Cons:
- The advanced functionalities might present a steep learning curve for beginners.
- The complex configuration options could be overwhelming for users new to professional trading software.
Getting Started with ChartsWatcher
Implementation Tips:
- Begin with the free version to familiarize yourself with the interface and core features.
- Explore the pre-built dashboard templates as a starting point for your own customizations.
- Use the extensive documentation and tutorials provided by ChartsWatcher to master the more advanced features.
Website: ChartsWatcher
ChartsWatcher's extensive features might seem daunting at first. However, its power and flexibility make it a valuable asset for serious traders. Those who demand a truly customized trading experience will appreciate its ability to transform real-time data into actionable insights, giving users a distinct advantage in today's dynamic markets.
TradingView
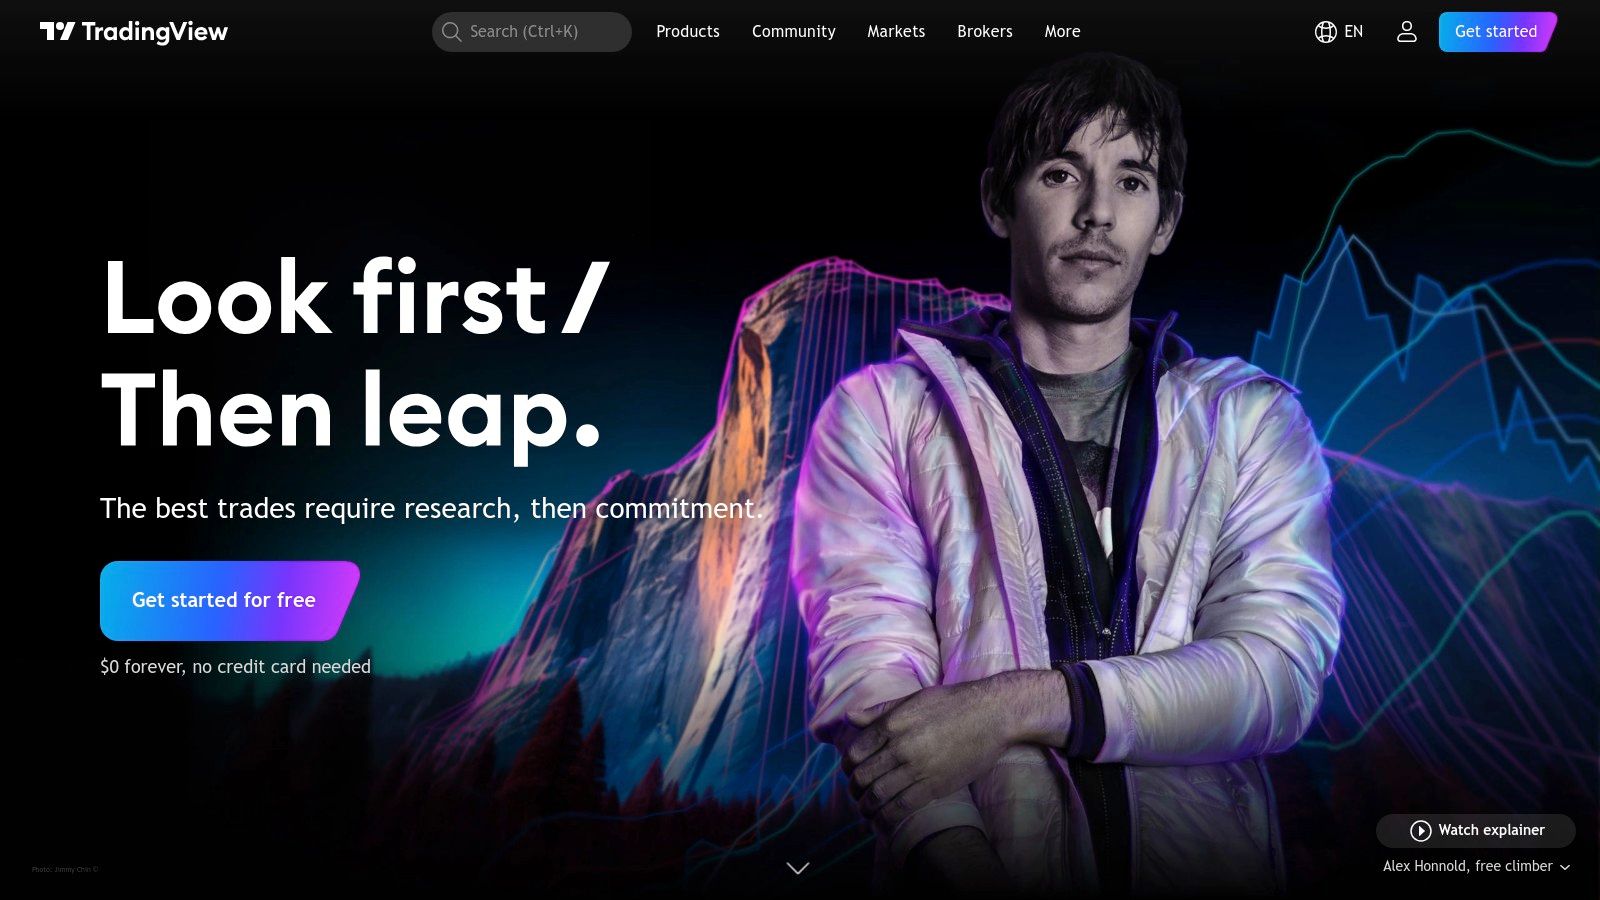
TradingView is a popular stock market analysis platform known for its charting tools, real-time data, and social networking features. It caters to a wide audience, from seasoned traders and financial institutions to independent investors and educators. The platform's customizable charts and extensive library of over 100 technical indicators allow for in-depth technical analysis across multiple timeframes. TradingView’s social aspect is a key differentiator, fostering a community where traders can connect and share insights.
TradingView’s interface is generally user-friendly, accommodating both beginners and experienced traders. However, the breadth of features can initially seem overwhelming to those completely new to trading. The platform is web-based, accessible through any browser, eliminating the need for downloads. A free plan with basic features further enhances accessibility, letting users explore the platform before opting for a paid subscription.
Key Features and Benefits
Some of TradingView's standout features include:
- An advanced charting platform with customizable indicators
- Pine Script for creating custom indicators
- A social network specifically for traders
- Multi-timeframe analysis capabilities
- Watchlists and alerts for staying informed
These tools enable in-depth market analysis, strategy backtesting, and staying up-to-date on market movements. While the free plan offers a solid foundation, access to advanced features, such as real-time data for certain exchanges, requires a paid subscription. For those wanting to delve deeper into technical analysis, you might find this helpful: Our guide on Technical Analysis Indicators.
Pros and Cons
Here's a quick breakdown of the advantages and disadvantages:
Pros:
- User-friendly interface suitable for all skill levels
- Active community for sharing trading ideas
- Web-based platform; no downloads needed
- Free plan available
Cons:
- Advanced features require a paid subscription
- Real-time data for some exchanges requires a premium plan
- Initial learning curve can be steep for beginners
Pricing and Technical Requirements
TradingView offers a free plan, while paid plans provide additional features and data access. The platform is compatible with any modern web browser.
Comparison With Other Platforms
While platforms like MetaTrader 4 are primarily focused on forex trading, TradingView offers a broader range of instruments, including stocks, futures, and cryptocurrencies, along with its powerful charting and social features. This makes TradingView a versatile option for analysts and traders across different markets.
Implementation Tip
Start with the free version to get familiar with the platform. Explore the charting tools, community features, and available indicators. As your needs grow, consider upgrading to a paid plan to access advanced features like real-time data and custom indicators.
Website: TradingView
Bloomberg Terminal
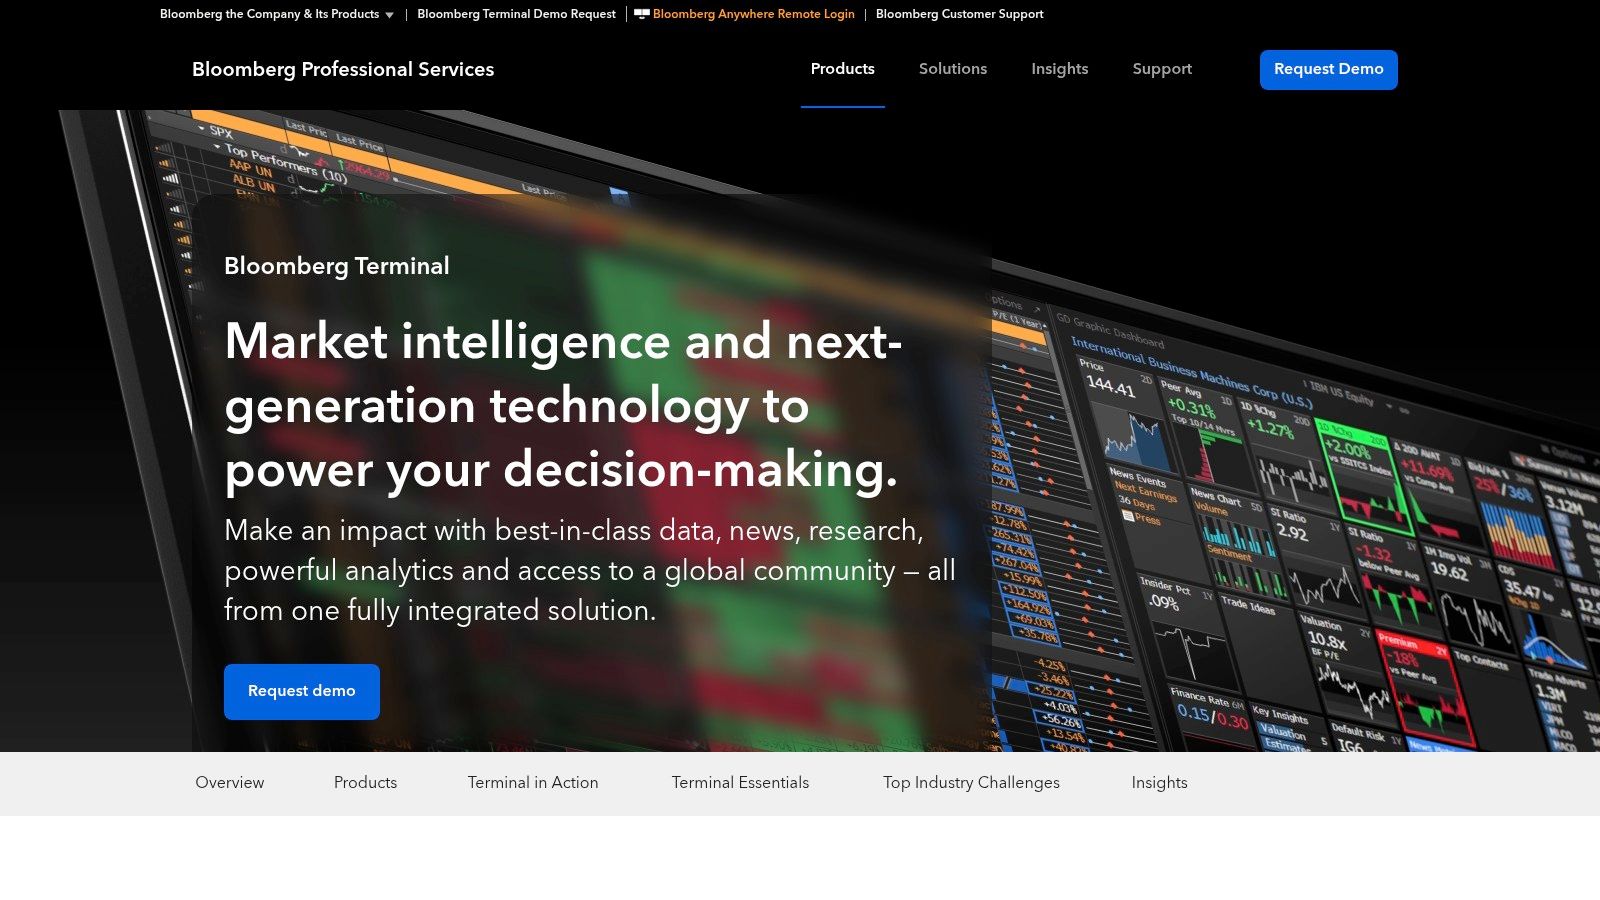
The Bloomberg Terminal is considered the gold standard for professional stock market analysis. Its high cost makes it inaccessible for most individual investors. However, for financial institutions, professional traders, and serious stock market analysts, its comprehensive data, robust analytics, and integrated communication tools make it an essential resource. Its presence on this list is justified: the Bloomberg Terminal showcases the pinnacle of market analysis tools, setting the industry benchmark.
What makes this platform so powerful? It comes down to breadth and depth. The Terminal provides a centralized hub for financial activities, encompassing everything from real-time market data (across all asset classes) to sophisticated portfolio management and risk assessment tools.
Imagine analyzing historical and projected economic indicators, executing trades across multiple exchanges, and communicating with colleagues and clients — all within one platform. This is the power of the Bloomberg Terminal.
Practical Applications and Use Cases
Here are some key applications of the Bloomberg Terminal:
-
Equity Research: Perform deep dives into company financials, access analyst estimates, and research industry trends to inform investment decisions. The Terminal’s charting and technical analysis features enable advanced charting and pattern recognition.
-
Fixed Income Analysis: Access vital information for bond traders and portfolio managers, including bond pricing, yields, credit ratings, and other fixed-income data.
-
Portfolio Management: Track portfolios in real-time, perform risk analysis, and conduct performance attribution.
-
Trading: Execute trades swiftly across various asset classes via direct access to electronic trading platforms.
-
News and Communication: Stay informed about market-moving events with the integrated newsfeed and leverage the built-in messaging system to communicate seamlessly within the financial community.
Features
- Real-time market data from global markets
- Advanced analytics and data visualization tools
- Proprietary communication network for finance professionals
- Portfolio and risk analysis tools
- Economic research and news updates
Pros and Cons
Here’s a quick look at the advantages and disadvantages:
| Pros | Cons |
|---|---|
| Most comprehensive financial data available | Extremely expensive (approximately $24,000/year) |
| Trusted by professional investors | Steep learning curve |
| Excellent customer support | Overkill for individual investors |
| Integrated messaging system | May require dedicated hardware (though web access is increasing) |
Pricing and Technical Requirements
The Bloomberg Terminal costs roughly $24,000 per year per user. While traditionally requiring dedicated hardware, Bloomberg now offers web-based access for increased flexibility.
Comparison With Similar Tools
Refinitiv Eikon and FactSet offer comparable features. However, the Bloomberg Terminal is often preferred for its wider market coverage, more extensive datasets, and the network effect of its large user base. These alternatives may provide a more cost-effective solution for smaller firms or those with niche requirements.
Implementation/Setup Tips
For those with access, dedicated training is essential. Bloomberg provides comprehensive training resources. Given the vast amount of information available, it's best to start with specific tasks and gradually expand your knowledge.
Bloomberg Terminal
MetaStock
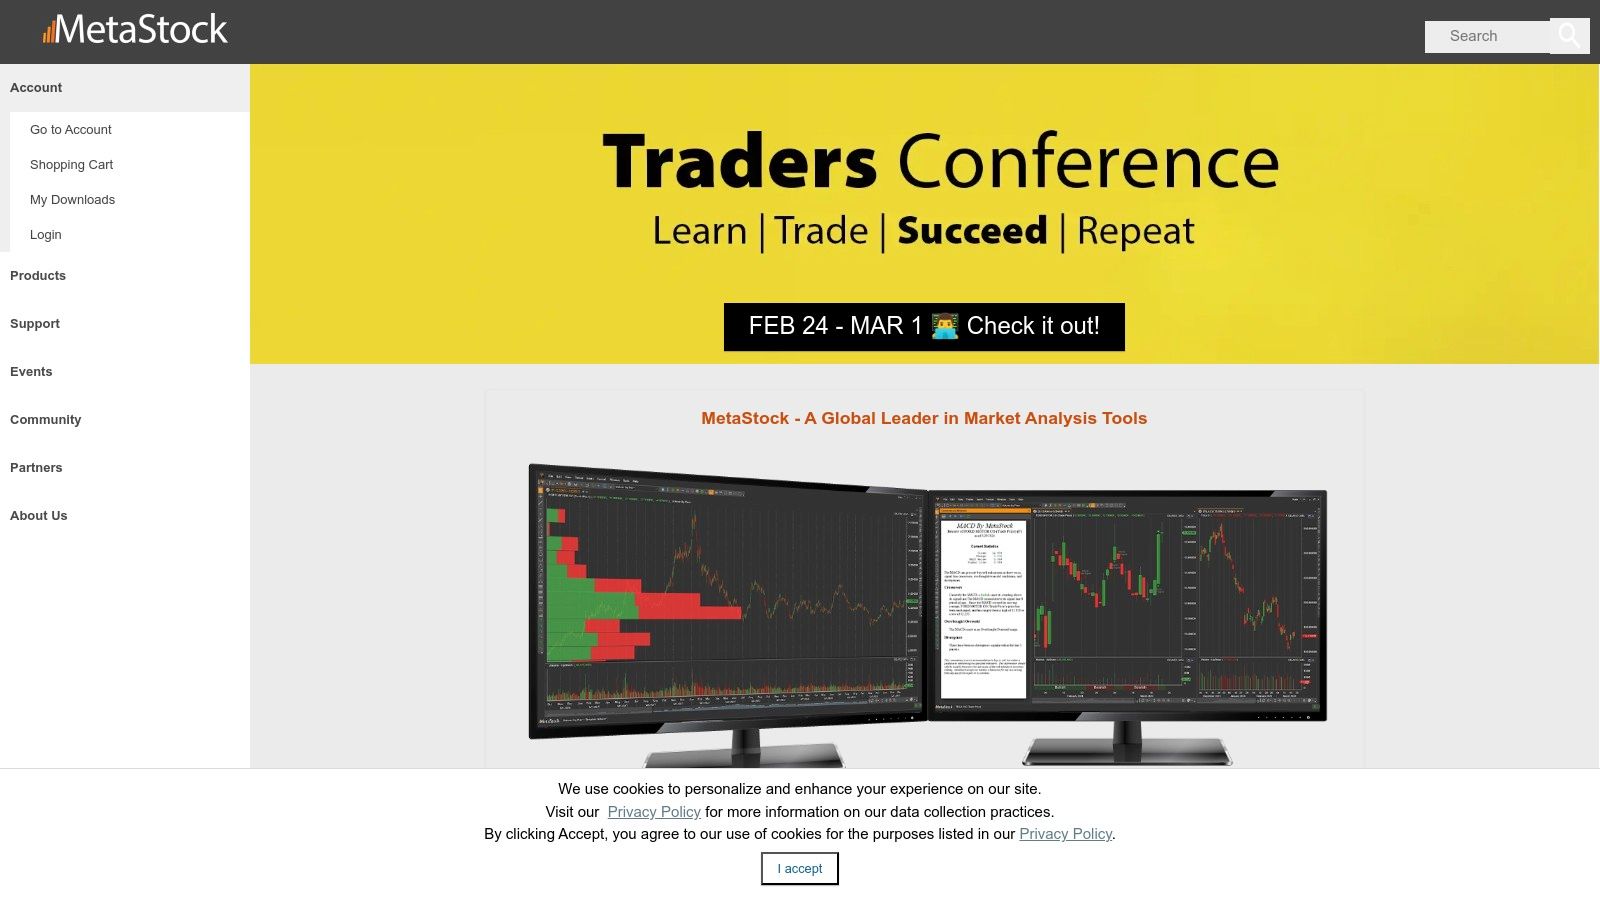
MetaStock is a technical analysis software platform designed for serious investors, financial institutions, and experienced traders. It offers advanced charting, screening, and backtesting capabilities, making it a valuable tool for in-depth market analysis. Unlike basic web-based charting platforms, MetaStock provides a comprehensive suite of tools for developing, testing, and refining sophisticated trading strategies using historical and real-time data.
Key Features and Benefits for Professionals
MetaStock offers a powerful toolkit for professional traders, featuring a library of over 300 technical indicators, advanced pattern recognition tools, and a robust backtesting engine. This allows for rigorous analysis of complex trading strategies. Imagine testing an options strategy against 20 years of historical data, optimizing entry and exit points for peak performance. MetaStock makes this possible.
Financial analysts working within institutions will find value in the global market data coverage and the ability to create custom formulas for proprietary indicators. This offers a distinct advantage in market forecasting. For independent investors, MetaStock’s sophisticated charting and drawing tools help identify potential trading opportunities, while educators can use the platform to illustrate complex concepts.
Backtesting and Screening: Refining Your Strategy
One of MetaStock's core strengths lies in its comprehensive backtesting functionality. This allows users to simulate trades based on historical data, adjusting parameters and assessing the potential profitability and risk of various strategies. This feature is essential for developing robust trading systems and minimizing potential losses. A day trader, for instance, could backtest a moving average crossover strategy with high-frequency data to optimize parameters for maximum profit within their risk tolerance.
Furthermore, MetaStock's powerful filtering capabilities allow for efficient stock scanning and screening. Traders can quickly identify stocks that meet specific technical criteria, streamlining their search for investment opportunities.
Features:
- Comprehensive technical analysis with 300+ indicators
- Advanced pattern recognition tools
- Powerful backtesting engine
- Custom formula tools
- Global market data coverage
Pros:
- Sophisticated analysis tools designed for experienced traders
- Extensive historical data
- Robust backtesting capabilities
- High degree of customization
Cons:
- Steep learning curve for new users
- Higher price point compared to web-based alternatives. (Pricing depends on the chosen data feed and package; consult the MetaStock website for current pricing.)
- Requires installation and updates as a desktop software. (System requirements depend on the software version; check the MetaStock website for details.)
- Limited fundamental analysis tools.
Implementation/Setup Tips:
- Invest time in learning the software through tutorials and available resources.
- Begin with a trial version to assess suitability for your individual needs.
- Clearly define your trading strategies and objectives before customizing the platform.
MetaStock vs. Web-Based Platforms
Compared to web-based platforms like TradingView or StockCharts, MetaStock offers deeper analytical capabilities. However, this comes with a higher cost and steeper learning curve. While web-based platforms prioritize convenience and ease of use, MetaStock delivers the power and customization serious traders often require.
Website: MetaStock
Thinkorswim By TD Ameritrade
Thinkorswim by TD Ameritrade is a professional-level trading platform. It offers advanced charting, technical analysis, and trading capabilities, making it a powerful tool for serious investors. Thinkorswim provides real-time data and customizable charts with hundreds of technical studies. It also includes screeners and robust strategy backtesting capabilities.
This platform stands out for its comprehensive options analysis tools and extensive educational resources. It caters to both seasoned traders and those looking to expand their knowledge. Thinkorswim is free to use with a TD Ameritrade account. This puts professional-grade tools within reach of retail investors.
Key Features and Benefits
From advanced charting with hundreds of technical indicators to sophisticated options analysis tools, Thinkorswim provides a comprehensive suite for analyzing the market.
- In-Depth Options Analysis: The platform allows for in-depth analysis of options strategies, including complex multi-leg options.
- Customizable Screeners: Customizable screeners and scanners help you identify trading opportunities based on specific criteria, saving valuable time and effort.
- Real-Time Data: Real-time news and market data ensure you stay informed and can react quickly to changing market conditions.
- Backtesting Capabilities: You might be interested in backtesting your strategies to maximize the platform's potential.
Beyond analysis, Thinkorswim facilitates paper trading. This allows users to practice strategies and refine their approach risk-free. This feature is particularly valuable for beginners or those testing new trading ideas. The platform also boasts a strong mobile application, extending its functionality to traders on the go.
Potential Drawbacks
While Thinkorswim offers a wealth of features, it does have a steep learning curve. Beginners might find the interface cluttered and overwhelming initially. The platform can also be resource-intensive, potentially requiring a more powerful computer for optimal performance. Access to some features may also require active trading on your TD Ameritrade account.
Pros and Cons Summary
| Feature | Pro | Con |
|---|---|---|
| Cost | Free with a TD Ameritrade account | Some features require active trading |
| Tools | Professional-grade | Steep learning curve for beginners |
| Resources | Excellent educational resources | Resource-intensive on some computers |
| Mobile Access | Strong mobile platform | Interface can be cluttered |
| Options | Advanced analysis capabilities |
Thinkorswim earns its place on this list by offering a comprehensive and powerful suite of tools for stock market analysis. Its depth of features, combined with being free with a TD Ameritrade account, makes it a compelling choice. It is well-suited for active traders, options traders, and investors seeking advanced analytical capabilities. It particularly caters to professional traders, stock market analysts, financial institutions, independent investors, stock trading educators, and those looking for robust stock screening and scanning tools for day trading.
Finviz: Market Visualization and Screening Powerhouse
Finviz (Financial Visualizations) stands out for its powerful combination of stock screening, market visualization, and fundamental analysis tools, all packaged in a user-friendly interface. Whether you’re a seasoned trader, a financial institution, or an individual investor, Finviz can significantly bolster your market analysis capabilities.

Imagine pinpointing undervalued tech stocks with positive earnings growth in mere minutes. Finviz’s robust stock screener empowers you to set filters for specific sectors, financial metrics (like P/E ratio and EPS growth), and technical indicators (such as RSI or moving averages). This allows you to quickly identify potential investment opportunities aligned with your strategy, eliminating hours of manual research.
Finviz’s visual heatmaps provide an instant overview of market sector performance. You can quickly spot trending sectors and identify potential outperformers or laggards. This feature is invaluable for both day traders seeking short-term plays and long-term investors evaluating overall market sentiment.
In-Depth Company Analysis
Beyond screening, Finviz offers tools for in-depth company analysis. You can access detailed fundamental data, interactive charts, and even insider trading information, all crucial for understanding a company's financial health and potential future performance. For instance, by comparing a company's valuation metrics against its industry peers using Finviz's correlation matrices, you can unearth hidden opportunities or identify overvalued stocks. Stock trading educators can also use Finviz's visualization tools to illustrate market dynamics and demonstrate practical applications of technical and fundamental analysis to their students.
Finviz Pricing and Access
Finviz offers a robust free version with significant functionality, making it readily accessible to individual investors. However, real-time data and advanced features like backtesting require a paid Elite subscription. While the pricing for the Elite subscription isn't publicly available, it offers valuable upgrades for active traders requiring up-to-the-minute market information.
Features
- Powerful stock screening with numerous filters
- Visual heatmaps of market sectors
- Technical and fundamental analysis tools
- Insider trading information
- Correlation matrices
Pros
- Free version offers substantial functionality
- User-friendly interface with visual representations
- Quick market overview capabilities
- No software installation required (web-based)
Cons
- Real-time data requires Elite subscription
- Advanced features locked behind paywall
- Limited customization in free version
- No direct trading capabilities
Comparison With Similar Tools
While Finviz shares similarities with screening platforms like TradingView or Stock Rover, it differentiates itself through its intuitive heatmaps and the wealth of information available in the free version. TradingView provides more advanced charting tools, while Stock Rover emphasizes fundamental analysis. Finviz effectively strikes a balance between the two.
Implementation Tip
Start with the free version to explore the platform and determine if the available features meet your investment needs. Experiment with different screening criteria and explore the visualization tools. If you find yourself requiring real-time data or the advanced backtesting capabilities, consider upgrading to the Elite subscription.
Website: Finviz
StockCharts.com: Charting and Education Combined
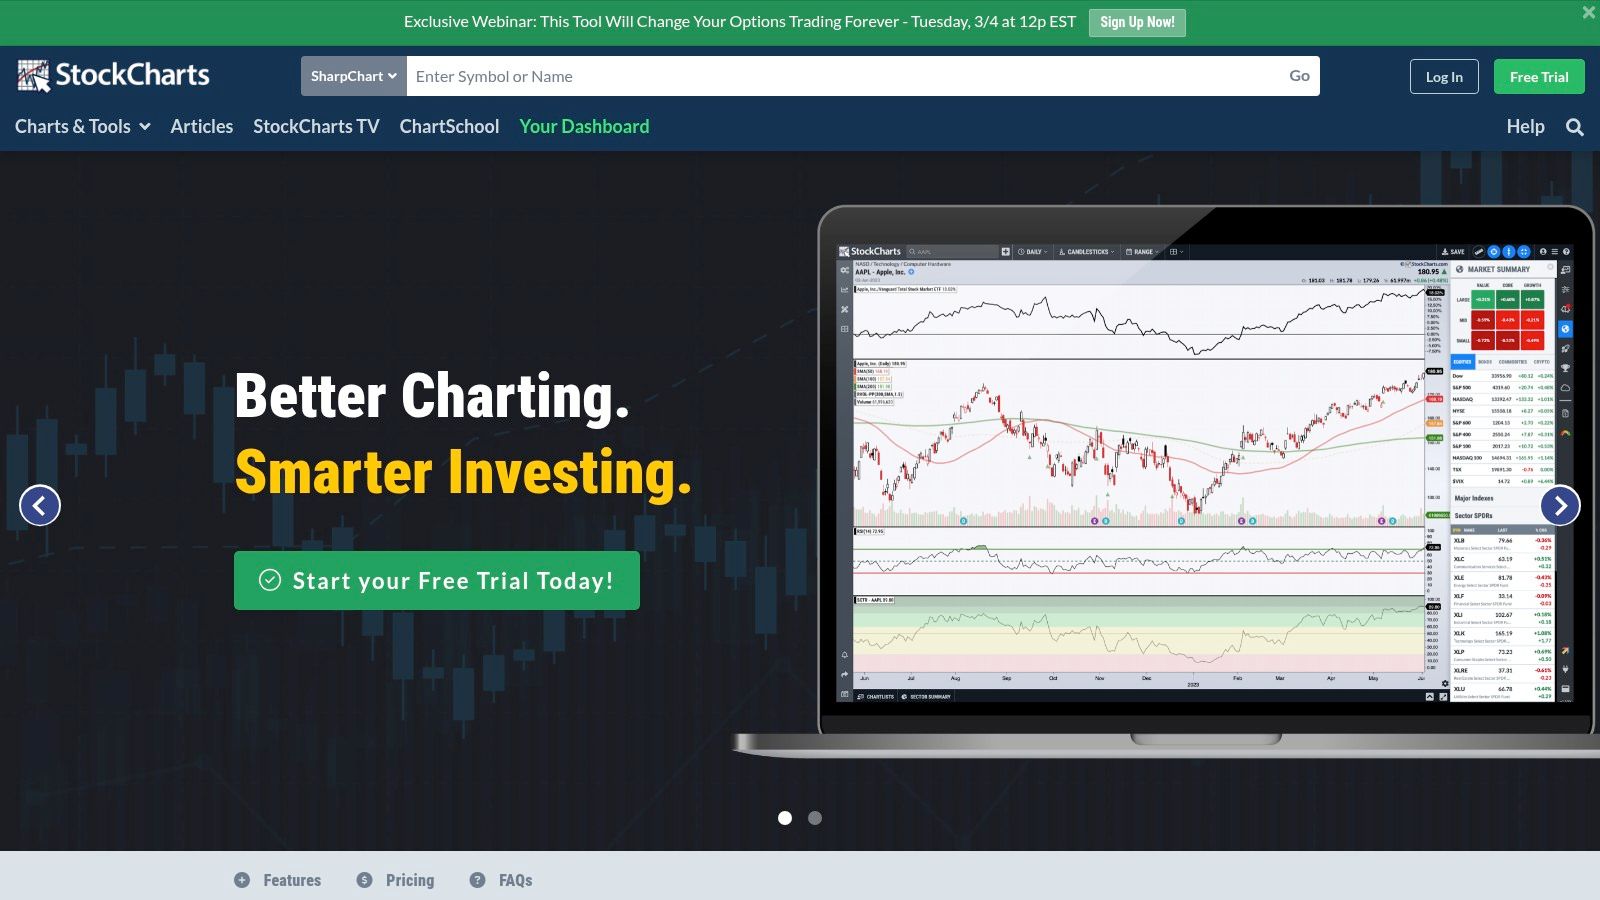
StockCharts.com is a powerful and user-friendly platform perfect for learning and applying technical analysis. It's a great resource for everyone from beginners to experienced professionals. While it may not have as much data as platforms like Bloomberg Terminal or FactSet, its clear charting, educational resources, and accessible scanning tools make it a valuable asset.
This web-based platform provides a solid set of tools for analyzing stocks, ETFs, mutual funds, and market indices. The intuitive charting interface and extensive library of technical indicators are its core strengths. Whether you're a day trader looking for quick candlestick pattern recognition or a long-term investor tracking moving averages and relative strength, StockCharts.com can support your analysis.
Key Features and Benefits
-
Interactive Charting: Customize charts with different timeframes, chart types (candlestick, OHLC, line, etc.), and drawing tools. This allows for detailed visual analysis and helps you spot potential trading opportunities.
-
SharpCharts: This tool lets you add technical indicators, overlays, and comparisons to your charts for sophisticated technical analysis. Experiment with different indicators to refine your trading strategies.
-
Scanning and Screening: Quickly find stocks that match your specific technical criteria using pre-built or custom scans. This is especially useful for traders looking for momentum plays, breakouts, or other technical setups. You could, for instance, create a scan to find stocks with a Relative Strength Index (RSI) above 70 and a positive moving average crossover.
-
Market Breadth Indicators: Analyze overall market health and sentiment using indicators like the Advance-Decline Line and the McClellan Oscillator. This helps identify potential market tops and bottoms, informing broader investment strategies.
-
Sector Rotation Model: Understand which sectors are performing well and which are lagging. This allows for strategic sector allocation and portfolio optimization.
-
Educational Resources: StockCharts.com provides a wealth of educational materials. Access webinars, articles, and even their own trading show, "ChartWatchers LIVE," to enhance your understanding of technical analysis.
Pros
- Strong Educational Resources: Perfect for beginners learning technical analysis.
- User-Friendly Interface: Easy to navigate, even for less experienced users.
- Excellent Scanning Tools: Efficiently find trading opportunities.
- Active Community of Traders: Connect and share insights with other users.
Cons
- Limited Free Options: A paid subscription is needed for most features.
- Less Comprehensive Data: Compared to professional platforms like Bloomberg Terminal.
- Occasional Slow Loading Times: Can occur with complex charts and indicators.
- Mobile Experience Needs Improvement: While usable, the desktop version is more powerful.
Pricing and Technical Requirements
StockCharts.com offers several subscription tiers, from basic charting packages to premium subscriptions with advanced features and data. Visit their website for current pricing. The platform is web-based and accessible through any modern web browser.
Implementation Tip
Start with the free resources and educational materials to learn the platform. Then, consider the different subscription options and choose the one that best fits your needs and trading style.
Website: StockCharts.com
StockCharts.com offers a good balance between basic charting tools and complex professional platforms. Its combination of user-friendliness, powerful features, and educational resources makes it an excellent choice for traders and investors of all levels looking to use technical analysis.
Yahoo Finance
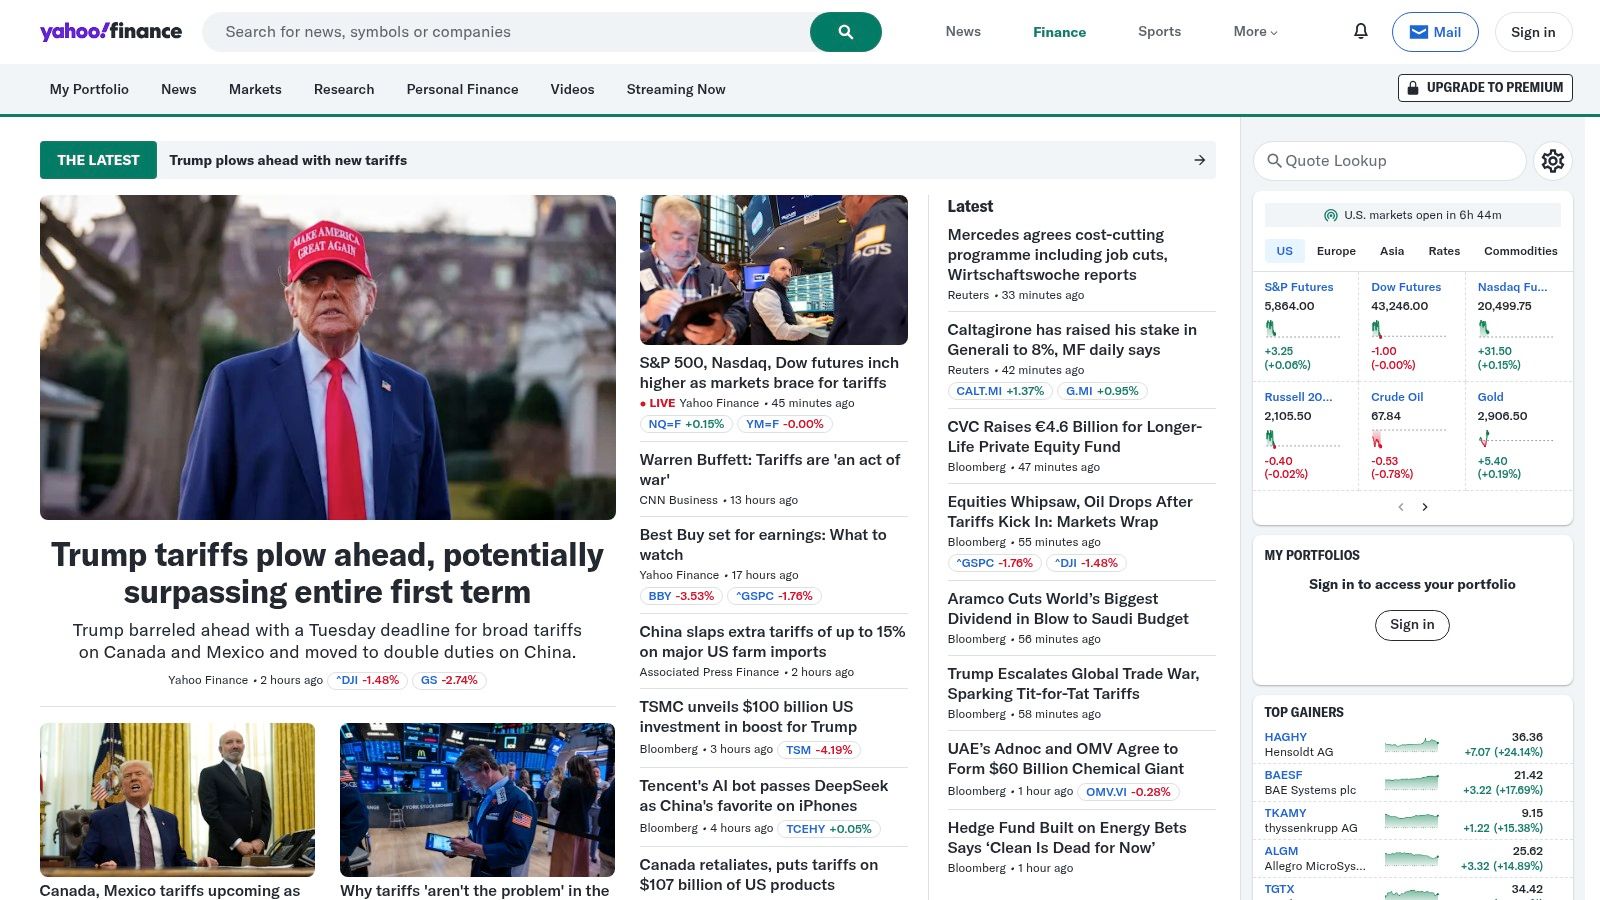
Yahoo Finance is a leading platform for free stock market analysis. It's a valuable tool for everyone from casual investors to seasoned professionals. Its wide range of features and easy accessibility make it a great resource for stock market research and portfolio management.
For professional traders, Yahoo Finance offers quick access to market conditions, real-time quotes, and relevant news. The portfolio tracking feature helps traders monitor their investments and create custom watchlists. While it may not offer the advanced charting of TradingView or Bloomberg Terminal, the basic charting with common technical indicators is still very helpful.
Stock market analysts and financial institutions can use Yahoo Finance to gather essential data. This includes financial statements, analyst ratings, and historical performance data for publicly traded companies. This data provides valuable context for in-depth research. Independent investors benefit from the platform's user-friendly design and comprehensive market coverage. They can stay informed and make sound investment decisions. Even educators can use Yahoo Finance for demonstrations and case studies.
Features and Benefits
-
Real-Time Quotes and Market Data: Get up-to-the-minute stock prices, indices, and other important market indicators.
-
Portfolio Tracking and Customizable Watchlists: Monitor your investments and track specific stocks with personalized watchlists.
-
Company Financial Data and Statements: Access important financial documents, such as income statements and balance sheets. This helps you understand a company's financial health.
-
News Integration and Market Commentary: Stay current with integrated news feeds and market analysis, all within the platform.
-
Basic Charting with Technical Indicators: Visualize price movements and apply common technical indicators like moving averages and RSI.
Pros
-
Free Basic Features: Access valuable information and tools without paying any subscription fees.
-
User-Friendly Interface: Easy to navigate, even for beginners new to stock market analysis.
-
Comprehensive Market Coverage: Track a wide array of stocks, indices, and other financial instruments.
-
Mobile App: Access data and manage your portfolio from anywhere.
Cons
-
Limited Advanced Tools: Doesn't offer the advanced charting and analysis features of specialized platforms.
-
Intrusive Ads: The free version has ads, which some users may find distracting.
-
Less Sophisticated Charts: Compared to platforms like TradingView, chart customization and indicator options are limited.
-
Potential Data Delays: Real-time quotes may experience slight delays compared to professional data feeds.
Website: Yahoo Finance
Implementation/Setup Tips
Getting started with Yahoo Finance is easy. Visit the website or download the mobile app. Create a free account to personalize your experience, set up watchlists, and track your portfolio. The basic features are sufficient for many users. However, you might consider other platforms if you need advanced charting, in-depth technical analysis, or real-time data feeds. Yahoo Finance is an excellent free platform. It's ideal for market overviews, basic analysis, and portfolio tracking, making it a valuable tool for any investor.
Stock Rover: Deep Dive Research For The Serious Investor
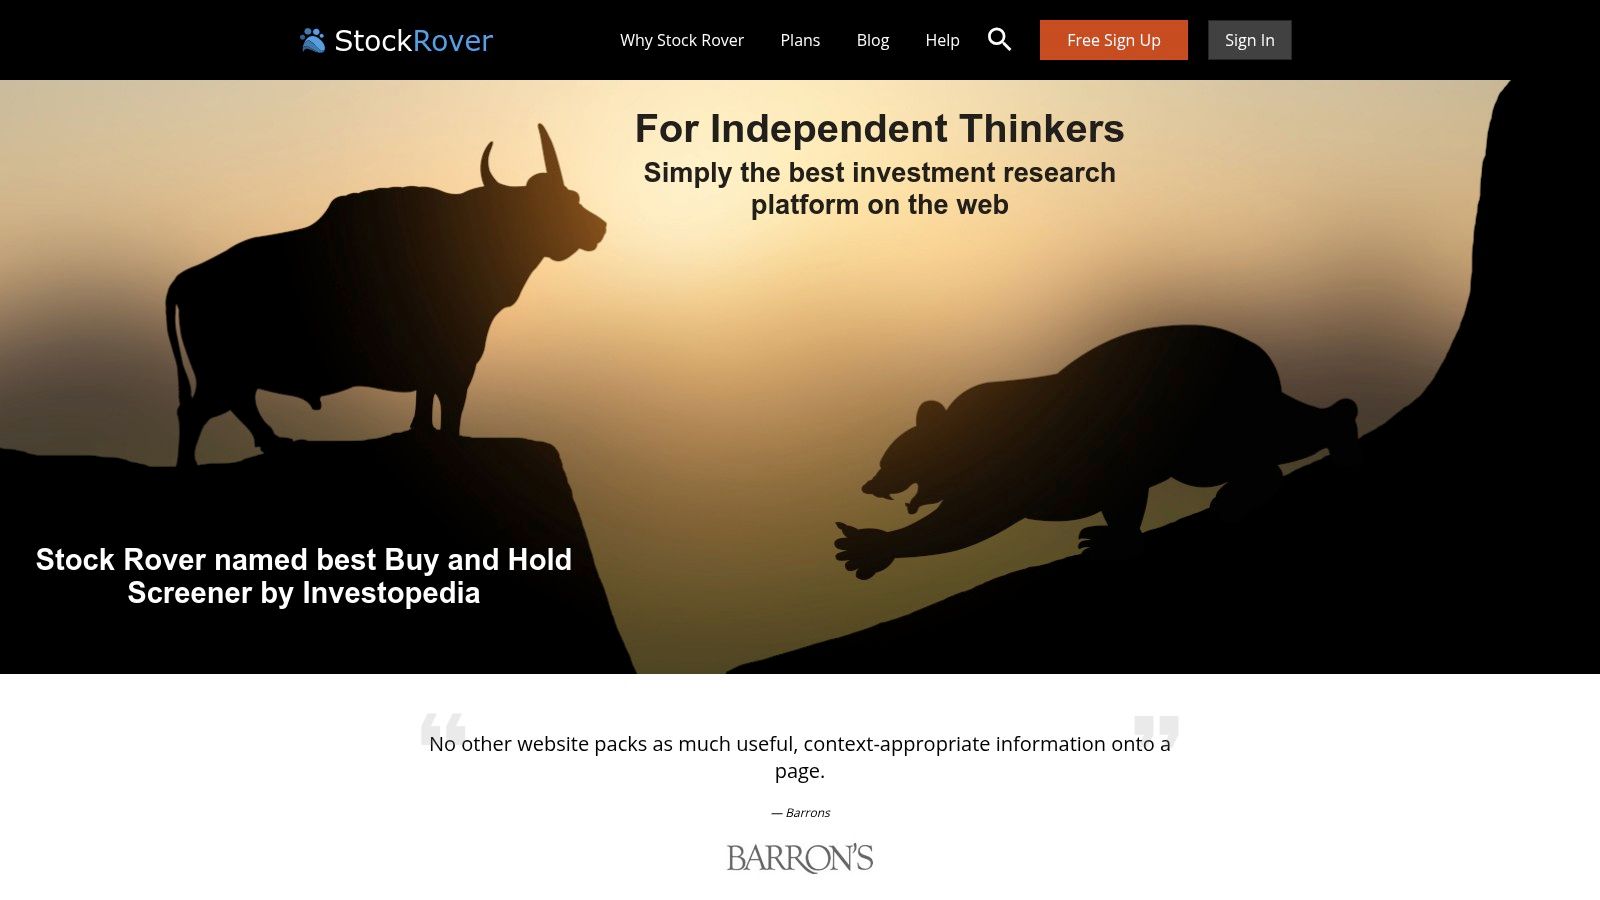
Stock Rover is a powerhouse for fundamental analysis and portfolio management. It's designed for investors who value in-depth research and a value-driven approach. This makes it especially useful for professional traders, analysts, financial institutions, and serious individual investors.
While it lacks direct trading integration, making it less suitable for day traders, its comprehensive data and robust screening features are invaluable for long-term strategies.
Stock Rover provides extensive financial data. You can examine a company’s financials, analyze historical trends, and benchmark against competitors and industry averages. Building a comparison of key metrics across multiple companies in the same sector is simple and efficient. This data-driven approach empowers informed investment decisions.
For instance, you could screen for undervalued companies with strong dividend growth within a specific industry. This allows you to quickly pinpoint potential investments aligned with your strategy.
Beyond individual stock analysis, Stock Rover excels in portfolio management. Its tracking and analysis tools offer a complete overview of your holdings. This lets you monitor performance, assess asset allocation, and track your progress toward your financial objectives. This is vital for both individual investors and financial professionals managing client accounts.
Key Features And Benefits
- Comprehensive Fundamental Data and Screening: Access a vast database of financial metrics and use powerful screening tools to find investment opportunities based on your criteria.
- Advanced Portfolio Analysis and Tracking: Monitor portfolio performance, asset allocation, and risk profile with in-depth analytics and reporting.
- Detailed Comparison Tools: Compare stocks side-by-side to evaluate their relative strengths and weaknesses.
- Research Reports and Ratings: Access analyst ratings and research reports to guide your decisions (availability varies by subscription).
- Dividend Tracking and Analysis: Analyze dividend payouts, yields, and growth rates for income-focused investing.
Pros
- Excellent Fundamental Analysis: Provides a wealth of data and tools for in-depth research.
- Intuitive Interface and Customizable Dashboards: Tailor the platform to your specific needs and preferences.
- Strong Portfolio Management Features: Effectively track and analyze your investments.
- Extensive Historical Data: Backtest strategies and uncover long-term trends.
Cons
- Limited Technical Analysis: Not ideal for day traders relying on technical indicators.
- Premium Features Require Subscription: The free version has limitations; full access requires a paid subscription.
- No Direct Trading Integration: Requires a separate brokerage account to execute trades.
- Learning Curve: Mastering all the features requires time and effort.
Pricing
Stock Rover offers a free version with limited features, along with several paid subscription tiers. These offer increasing data, research capabilities, and functionality. Visit their website for current pricing details.
Technical Requirements
Stock Rover is a web-based platform accessible through any modern browser.
Comparison With Similar Tools
While similar to platforms like Finviz for screening, Stock Rover's depth of fundamental data and portfolio management tools set it apart. Finviz functions as a broader screener, whereas Stock Rover provides more focused, in-depth analysis.
Implementation/Setup Tips
Begin with the free version to familiarize yourself with the platform. Take the time to learn the advanced screening and portfolio tracking features. Customize your dashboards to display the data most relevant to your investment strategy.
Website
Interactive Brokers TWS (Trader Workstation)
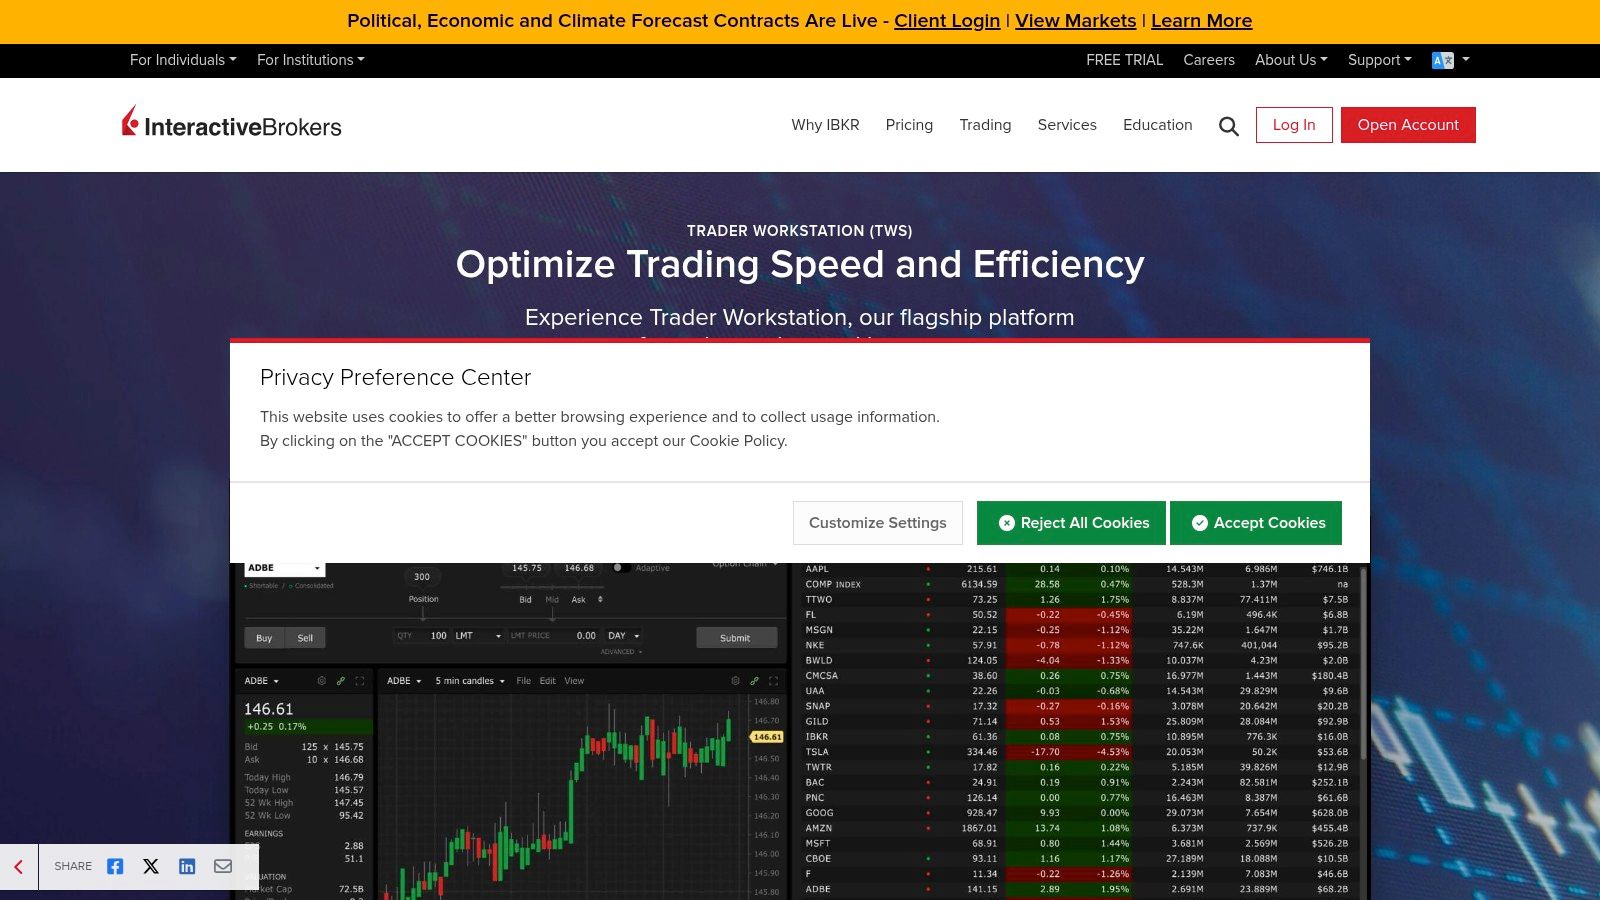
Interactive Brokers' Trader Workstation (TWS) is a powerful platform built for professionals. Think analysts, institutions, and seasoned traders. It's packed with tools to analyze global markets, execute complex orders, and manage diverse portfolios. TWS isn't limited to stocks; it covers options, futures, forex, and bonds, making it a true multi-asset trading hub.
Practical Applications and Use Cases
-
Advanced Charting and Technical Analysis: TWS offers highly customizable charts. There are a wide range of technical indicators and drawing tools available. Traders can perform deep dives into technical analysis, identify trends, and build strategies.
-
Market Scanning and Screening: The platform's scanners help users filter and find potential trading opportunities. Criteria include price movements, volume shifts, and fundamental data. This is especially useful for active traders and those using quantitative approaches.
-
Algorithmic Trading: TWS supports automated trading via its API and built-in algorithmic order types. Traders can develop and implement their own custom algorithms for automated execution and backtesting.
-
Portfolio Risk Management: The Risk Navigator tool provides a full view of portfolio risk. Users can analyze potential exposure to different market situations. They can then adjust their positions accordingly.
-
Global Market Access: TWS offers access to markets worldwide. Users can trade on multiple exchanges and diversify across different regions and asset classes.
Features and Benefits
- Advanced order types and algorithms (Iceberg, Bracket, Accumulate/Distribute)
- Global market access across multiple asset classes (stocks, options, futures, forex, bonds)
- Extensive technical and fundamental research tools
- Risk Navigator for portfolio risk analysis
- API access for custom trading applications
Pros
- Comprehensive trading platform covering various asset classes
- Access to global markets
- Professional-grade tools designed for experienced traders
- Relatively low trading costs compared to similar professional platforms
Cons
- Complex interface with a steep learning curve. It can be overwhelming for beginners.
- Not as visually appealing or intuitive as some newer, retail-focused platforms.
- Requires an Interactive Brokers account.
Pricing and Technical Requirements
TWS is free to download and use, but you'll need an active Interactive Brokers account. Commissions and fees depend on your trading volume, account type, and the markets you trade. Check the Interactive Brokers website for details on pricing. The platform is available for Windows, macOS, Linux, and mobile devices.
Comparison With Similar Tools
TWS competes with platforms like Thinkorswim (TD Ameritrade) and TradingView. Thinkorswim has a more intuitive interface and excellent educational resources. TWS, however, provides broader market access and more advanced trading tools. TradingView focuses on charting and social trading, whereas TWS is a complete trading and portfolio management platform.
Implementation/Setup Tips
- Use the documentation and tutorials on the Interactive Brokers website.
- Start with a paper trading account to get familiar with the platform before using real money.
- Customize the layout and workspaces to fit your trading style.
- Explore the API capabilities if you are interested in algorithmic trading.
Interactive Brokers TWS is a powerful tool designed for experienced traders, analysts, and institutions. Those looking for advanced features, global access, and robust analytical tools will find it useful. While the complexity can be a challenge for beginners, its depth and breadth make it a strong choice for serious market participants.
Top 10 Stock Market Analysis Tools: Core Features Comparison
| Platform | Core Features ✨ | Experience ★ | Value 💰 | Audience 👥 |
|---|---|---|---|---|
| 🏆 ChartsWatcher | Custom dashboards, real-time alerts, backtesting | Advanced; customizable; steep learning | Flexible plans (Free to $74.99/mo) | Professional traders, analysts, institutions |
| TradingView | Extensive charting, 100+ indicators, social community | Intuitive; community-driven | Free basic; premium for advanced real-time | Beginners to pros, active community |
| Bloomberg Terminal | Global data, deep analytics, integrated messaging | Professional; complex | Premium pricing (~$24,000/yr) | Institutional investors, financial professionals |
| MetaStock | 300+ indicators, robust backtesting, custom formulas | Powerful; steep learning curve | High-end pricing | Advanced traders, serious investors |
| Thinkorswim | Advanced charting, options tools, paper trading | Professional; busy interface | Free with TD Ameritrade account | Retail traders, options specialists |
| Finviz | Stock screening, heat maps, technical & fundamental analysis | User-friendly; visually engaging | Free basic; Elite subscription for real-time | Investors, short-term traders |
| StockCharts.com | Interactive charts, technical indicators, scanning tools | Easy to use; educational | Subscription-based with limited free access | Beginners, educational users |
| Yahoo Finance | Real-time quotes, news, portfolio tracking, basic charting | Simple, accessible | Completely free (with ads) | General investors, casual users |
| Stock Rover | In-depth fundamental data, screening, portfolio analytics | Intuitive; research-focused | Subscription for premium features | Value investors, portfolio managers |
| Interactive Brokers TWS | Advanced order types, global market access, algorithmic trading | Powerful; complex interface | Low trading costs; requires IB account | Professional, active traders |
Choosing The Right Stock Market Analysis Tools
Picking the right stock market analysis tools is critical for success in today’s fast-paced market. With so many platforms available, finding the perfect fit for your individual needs can feel overwhelming. From established platforms like the Bloomberg Terminal and TradingView to specialized tools like Stock Rover and MetaStock, there's a tool for every investor. Whether you’re focused on day trading, swing trading, long-term investing, or educating others, these tools offer a diverse range of capabilities.
Understanding Your Investment Needs
Before diving into the world of stock market analysis tools, take the time to consider your specific needs and priorities. Think about your trading style and investment goals. What kind of data do you need to make informed decisions? Are real-time data feeds essential for your strategy? Do you require advanced charting functionalities or prefer in-depth fundamental analysis? How important are features like backtesting, screening, and customizable alerts? Each tool caters to a different niche, so understanding your individual requirements is key.
Implementation and Getting Started
The process of implementation and getting started can vary significantly between platforms. Some offer intuitive interfaces and extensive learning resources, perfect for beginners. Others cater to more experienced users and may require a steeper learning curve. Consider factors like ease of use, available support, and the overall user experience when making your decision.
Budget and Resource Considerations
Budget is always a factor. While some platforms, like Yahoo Finance, offer basic functionalities for free, others, like the Bloomberg Terminal, come with a substantial price tag. Evaluate your budget and assess the value proposition offered by each tool. Think about the potential return on investment you can achieve with the insights gained from the chosen platform. A higher price tag doesn't always guarantee better results.
Integration and Compatibility
Integration and compatibility are important factors, especially if you already use other trading platforms or software. Ensure the tools you choose can integrate seamlessly with your existing workflow. This might involve compatibility with specific brokerage accounts, data feeds, or charting software. A smooth workflow can significantly impact your trading efficiency.
Key Takeaways
-
Define Your Needs: Understand your trading style, investment goals, and required data points before selecting any tool.
-
Consider the Learning Curve: Choose a platform that aligns with your technical skills and offers adequate support.
-
Budget Wisely: Balance the cost of the platform with the potential return on investment it offers.
-
Prioritize Integration: Ensure seamless compatibility with your existing trading ecosystem.
For traders seeking a powerful and customizable real-time platform, ChartsWatcher stands out. Designed for professionals looking for an edge in the market, ChartsWatcher lets you build your ideal trading desk. With customizable dashboards, real-time alerts, integrated charting, and robust backtesting capabilities, you’re in control. From creating multiple screen configurations tailored to your strategies to importing/exporting your personalized setups, ChartsWatcher offers unmatched flexibility. Explore ChartsWatcher's features and flexible pricing plans today and elevate your trading game.
