A Trader's Guide to Real Time Stock Scanning
Imagine the stock market is a massive, fast-moving river. A real time stock scanning tool is your high-tech sonar, constantly pinging the waters to find exactly where the big fish are schooling right now—not where they were five minutes ago. It's software that automatically sifts through thousands of stocks every second to pinpoint the few that match your exact trading criteria.
What Is Real Time Stock Scanning
Simply put, real time stock scanning is the process of using software to watch the entire market, second by second, and flag any stock that meets a specific set of rules you've defined.
Think about trying to watch every car on a massive highway network at once, just to find the red sports cars accelerating past 80 mph. It’s an impossible task for the human eye. A scanner automates this monumental job for the stock market. Instead of cars, it watches stocks. Instead of color and speed, you set the rules—anything from fundamental data to complex technical indicators.
This continuous analysis gives traders instant alerts the moment a stock’s activity aligns with their strategy, letting them react immediately. Its real power lies in its speed and efficiency, turning the chaotic noise of the market into a focused stream of actionable ideas. It’s the difference between hearing about a party after it's over and getting an invite right as it starts.
The Power of Instant Information
In trading, speed isn't just a nice-to-have; it's a critical advantage. A delay of a few minutes—sometimes even seconds—can be the difference between a great entry and a missed opportunity. This is where the "real time" part really matters. While some basic tools run on delayed data (often 15-20 minutes old), a true real time stock scanning platform delivers information with sub-second latency.
This kind of immediacy allows traders to:
- Catch Momentum Early: Spot stocks at the very beginning of a big price move, often triggered by breaking news or a sudden volume spike.
- Nail Precise Entries: Time trades with greater accuracy based on live price action, not stale information.
- Manage Risk on the Fly: React instantly to sudden market shifts that could turn a winning position into a losing one.
Scanners Versus Screeners
While people often use the terms interchangeably, there’s a crucial difference between a scanner and a screener. A traditional stock screener is like taking a snapshot of the market. It’s great for finding long-term investments that fit certain criteria based on end-of-day or delayed data. You can learn more in our guide on what a stock screener is and how it can boost your investing.
A real-time scanner, on the other hand, is a live video feed. It doesn’t just show you what met your criteria yesterday; it shows you what’s meeting it this exact second.
This shift from static snapshots to live feeds is a massive deal for active traders. Recent industry reports show that over 78% of active day traders now rely on real-time scanners to find opportunities.
The difference becomes crystal clear when you compare the two approaches side-by-side.
Manual Analysis vs Real Time Stock Scanning
| Feature | Manual Analysis | Real Time Stock Scanning |
|---|---|---|
| Speed | Slow, reactive | Instant, proactive |
| Scope | Limited to a few stocks | Entire market coverage |
| Efficiency | Labor-intensive | Fully automated |
| Alerts | None; requires constant watching | Automatic, criteria-based alerts |
| Opportunity | Missed intraday moves | Catches emerging breakouts |
| Emotion | High risk of FOMO/panic | Data-driven decisions |
As you can see, relying on manual analysis in a fast market is like trying to win a Formula 1 race on a bicycle. A real-time scanner gives you the engine you need to compete. This reliance isn’t just a trend; it's the new standard for anyone serious about active trading.
What Goes Into a Powerful Stock Scanner?
A high-performance real-time stock scanning tool is so much more than just a list of tickers flashing on a screen. Think of it like a pilot's cockpit—it's a fully integrated system where every gauge, dial, and switch works together to give you a clear picture. Learning how these components sync up is what turns raw market data into a clear flight path for your trading decisions.
At its core, a great scanner is a discovery engine. It’s built to answer one simple question for traders: "What's moving right now and why?" But to do that well, it needs a few core features that work in harmony to cut through the noise.
The Power of Customizable Filters
It all starts with filters. This is your primary navigation system, allowing you to tell the scanner exactly what you’re looking for. Instead of being stuck with a few presets, a professional-grade scanner like ChartsWatcher gives you a massive toolbox of both technical and fundamental filters. This means you can build laser-focused queries that match your specific trading strategy.
Let's say you're hunting for stocks with sudden, explosive interest. You wouldn't just search for "high volume." You'd stack multiple filters to paint a precise picture:
- Relative Volume: Find stocks trading at 5x or even 10x their normal daily volume. This is a huge red flag for unusual activity.
- Price Action: Zero in on stocks blasting through their 52-week high or crossing a major moving average.
- Float Size: Isolate low-float stocks, which are notorious for making huge percentage moves when volume pours in.
- Market Cap: Screen out the big, slow-moving blue chips to focus on smaller, nimbler companies.
This ability to layer criteria is what separates the basic tools from the pro-level ones. It’s the difference between asking "show me popular stocks" and "show me small-cap tech stocks with insane relative volume that just broke their 50-day moving average." One is a guess; the other is a plan.
Instant Alerts: Your Trading Co-Pilot
Once your filters are dialed in, the alerting system becomes your co-pilot. An alert isn't just a simple notification; it's a direct call to action. It’s the scanner tapping you on the shoulder to say, "Hey, that exact setup you were waiting for? It's happening right now."
In a true real-time stock scanning environment, these alerts hit your screen with sub-second latency, giving you a critical edge.
Think of alerts as your personal market watchdogs. They tirelessly monitor all 9,000+ US stocks so you don’t have to. The moment one of your rules is triggered, you get the signal—letting you focus on analysis instead of the endless hunt.
The best scanners send these alerts through multiple channels, like desktop pop-ups, email, and mobile push notifications. This frees you from your desk and shifts your trading from being reactive to proactive and prepared.
Integrated Charting and Data Synergy
An alert without context is just noise. That’s why seamless chart integration is non-negotiable. When your scanner flags a stock, you need to pull up its chart in a split second to see if the setup is legitimate. Top-tier platforms automatically sync alerts with your charting windows. You click the alert, and the full picture appears instantly: price history, indicators, and volume data.
This synergy creates a buttery-smooth workflow, moving you from discovery to analysis in a heartbeat. The scanner finds the needle in the haystack, and the integrated chart gives you the context to decide whether to act. This seamless connection is what closes the gap between spotting an opportunity and actually placing the trade.
When you're exploring the different tools out there, you'll find some that offer specialized capabilities. For instance, the Shortgenius platform is designed to help traders identify potential short opportunities. It's a great example of how different platforms can focus on unique market dynamics, all powered by the same need for clean, real-time data.
How to Build Your First Real Time Scan
Theory is great, but let's be honest—it doesn't pay the bills. The real magic happens when you turn that knowledge into a functional tool that spots opportunities. So, let's roll up our sleeves and build a practical real time stock scanning setup from scratch. Our goal is simple but powerful: find stocks that are coiling up for a big breakout.
Think of building a scan like assembling a high-performance engine. Each filter is a critical component, and the way you combine them determines just how much power and precision you get. We'll walk through a clear, five-step process to transform an empty scanner into your personal trading assistant.
Step 1: Define Your Objective
Before you touch a single filter, you need to know exactly what you're looking for. A fuzzy goal like "find stocks going up" is a recipe for disaster. Get specific. What does a "breakout" actually look like to you?
For this walkthrough, we'll define our target like this: A liquid, fundamentally sound company that's seeing unusually high volume and is pushing through a recent price ceiling. That one sentence gives us a clear blueprint for the filters we need, turning a vague idea into a concrete, actionable plan.
Step 2: Select Your Core Filters
These are your non-negotiables, the first line of defense. Core filters are all about weeding out the junk so you're not wasting time on stocks that are untradeable. This is where you set the basic rules of engagement.
- Market Capitalization: We’ll set a minimum of $300 million. This immediately gets rid of the speculative, wild-west penny stocks that can be incredibly volatile and difficult to trade.
- Average Daily Volume: Let's go with a minimum of 500,000 shares a day. This ensures there’s enough liquidity to get in and out of a position without your order moving the price against you.
- Share Price: A floor of $5 helps screen out the low-priced stocks often prone to manipulation and typically excluded by major brokerages anyway.
With just these three filters, we’ve instantly trimmed the market down from over 9,000 stocks to a much more focused and manageable universe.
By establishing a baseline of quality with core filters, you ensure that any stock your scan finds has already passed a fundamental test of liquidity and stability. This is the foundation upon which a successful scan is built.
Step 3: Add Your Technical Layers
Okay, our foundation is solid. Now it's time to add the technical filters that will pinpoint the actual breakout action. These are the triggers that scream, "Hey, something important is happening right now!"
Here's how we can stack our conditions to find the specific kind of breakout we're after.
The ChartsWatcher interface makes it easy to layer multiple technical conditions on top of each other to create a very precise signal.
For our breakout scan, we'll add these technical triggers:
- Price vs. 52-Week High: We want stocks trading within 5% of their 52-week high. This tells us the stock is already in a powerful uptrend and knocking on the door of a major resistance level.
- Relative Volume: Set this to be greater than 3.0. This is a game-changer. It finds stocks trading at 3x their normal volume for that specific time of day, a clear sign that big institutions are piling in.
- Moving Average Crossover: For good measure, we can add a condition where the faster 20-day simple moving average (SMA) has recently crossed above the slower 50-day SMA, confirming the bullish momentum is building.
Step 4: Configure Your Alerts
You've built the perfect mousetrap; now you need to know when it catches a mouse. A powerful real time stock scanning platform like ChartsWatcher lets you set up instant alerts through desktop pop-ups, sounds, or mobile notifications.
Don't skip this step. The most brilliant scan on earth is worthless if you see the signal an hour too late. Setting up your alerts properly automates the "watching" part of trading, freeing you up to focus on analysis and execution the moment it counts.
Step 5: Review and Refine Your Results
No scan is perfect right out of the gate. Once the alerts start firing, your job is to analyze what comes through. Is the scan too noisy, flooding you with mediocre setups? Or is it too restrictive, finding nothing for days on end?
Treat your scanner like a living tool. It needs ongoing tweaks. You might notice on choppy days that bumping the relative volume filter from 3.0 to 4.0 gives you much cleaner signals. This feedback loop—building, testing, and refining—is how you create a scan that’s perfectly tuned to your trading style and the market's personality.
For more ideas, you can see how these same principles apply when you build your winning gap up stock screener in ChartsWatcher, which uses a similar logic to hunt for a completely different kind of trading opportunity.
Adapting Your Scans to Market Conditions
The stock market has distinct personalities. Some days it’s a roaring bull, charging relentlessly upward. Other days, it’s a nervous bear, retreating from every shadow. Then there are the long stretches where it moves sideways, full of indecision.
A static, one-size-fits-all approach to real time stock scanning is a recipe for frustration in this ever-changing environment. The true power of a tool like ChartsWatcher is its ability to adapt, becoming a dynamic instrument that aligns with the current market climate.
Think about it: a scan designed to find high-flying momentum stocks will fall flat during a sharp market downturn. Likewise, a strategy for shorting weak stocks is useless in a powerful bull market. The key is to think like a chameleon, changing your tactics to blend in with the prevailing conditions. This means building and saving different scan configurations—a playbook of strategies you can deploy at a moment’s notice.
The process of building an effective scan remains consistent, regardless of what the market is doing. This visual below breaks down the core workflow into three fundamental steps.
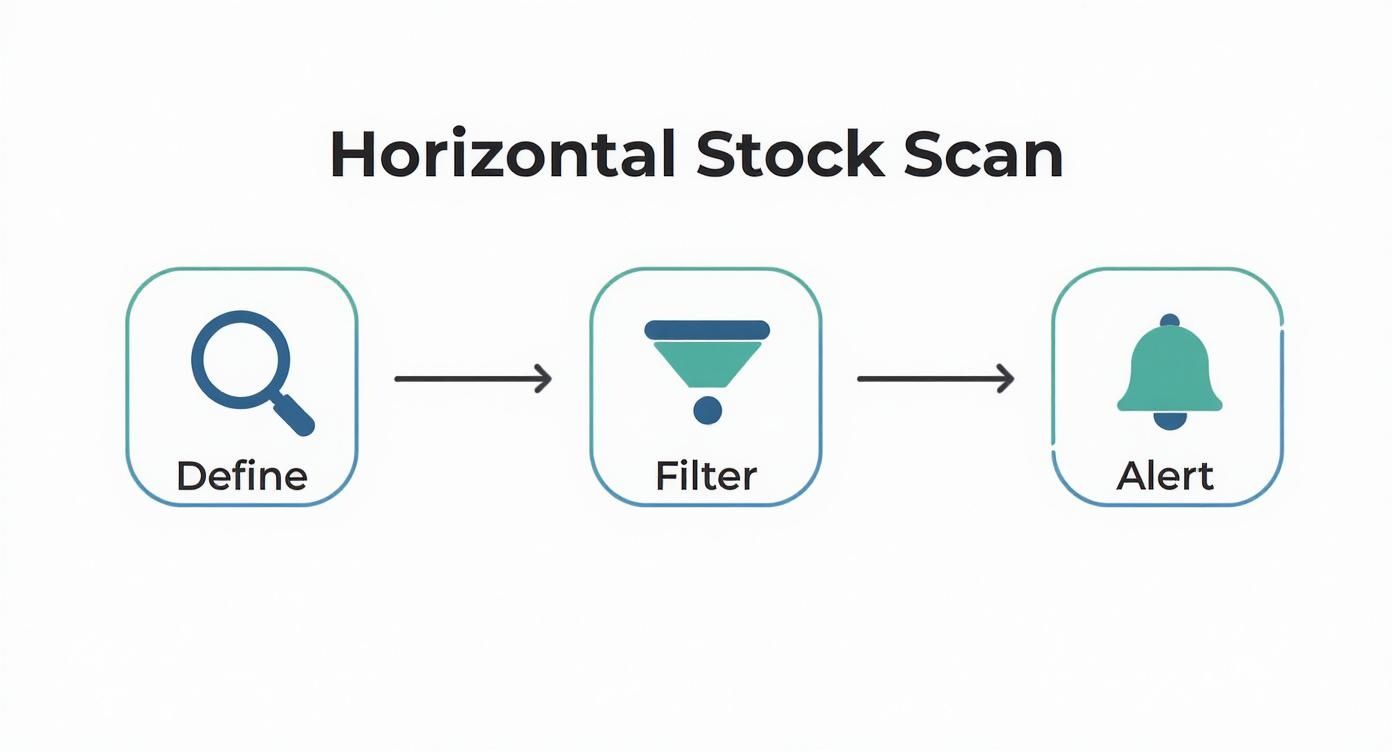
This workflow illustrates the simple yet powerful sequence of defining your target, applying specific filters, and setting up alerts. It's the foundation for any successful scanning strategy, no matter the market.
Scanning in a Bull Market
When the market is in a clear uptrend, your primary goal is to find the leaders. These are the stocks breaking out to new highs with exceptional strength. Your scans should be aggressive and focused on momentum.
- Objective: Pinpoint stocks showing powerful upward momentum and breaking through key resistance levels.
- Key Filters:
- Price Action: Scan for stocks hitting a New 52-Week High.
- Volume Spike: Use a Relative Volume filter greater than 2.0 to confirm institutional interest.
- Trend Confirmation: Filter for stocks trading above their 20-day and 50-day moving averages.
This combination acts as a powerful filter for strength, ensuring you're focusing only on the stocks that are leading the charge, not lagging behind.
Scanning in a Bear Market
During a downturn, the game completely flips. Instead of hunting for strength, you're looking for weakness. Your scans should pivot to identify stocks that are breaking down or showing significant underperformance compared to the broader market.
In a bear market, capital preservation is paramount. A well-crafted real time stock scanning setup helps you identify potential short opportunities or, at the very least, highlights which stocks to avoid holding.
Your bearish scan might look something like this:
- Objective: Identify stocks breaking key support levels with increasing selling pressure.
- Key Filters:
- Price Action: Scan for stocks hitting a New 52-Week Low.
- Weakness Confirmation: Look for stocks trading below all major moving averages (20, 50, and 200-day).
- Increased Selling: A Relative Volume above 1.5 on a down day can confirm conviction from sellers.
This strategy helps you find the weakest links in the market, providing clear candidates for short positions or simply highlighting which names to steer clear of.
Navigating Choppy Sideways Markets
Choppy, range-bound markets can be the trickiest to navigate. Strong trends are absent, and momentum plays often fail. In this environment, your scans should adapt to find stocks oscillating between predictable support and resistance levels.
Here, you're not looking for breakouts but for reversions to the mean. You can set up two complementary scans: one to find stocks nearing a support level and another for those approaching resistance.
-
For potential bounces (long side):
- Define a watchlist of stocks known to be range-bound.
- Set alerts for when a stock's RSI (Relative Strength Index) dips below 30 (oversold).
- Filter for stocks trading within 2% of a well-established support level.
-
For potential rejections (short side):
- Use the same watchlist of range-bound stocks.
- Set alerts for an RSI reading above 70 (overbought).
- Filter for stocks trading within 2% of a known resistance level.
To effectively adapt your real-time scans and manage risk in varying market conditions, understanding techniques like a Monte Carlo simulation can provide deeper insights into potential outcomes. By tailoring your scans, you transform your scanner from a simple tool into a strategic partner that helps you trade intelligently, no matter what the market throws at you.
Common Mistakes to Avoid With Stock Scanners
Getting your hands on a powerful real time stock scanning tool can feel like a trading superpower. But like any powerful tool, it takes discipline to use it right. Without the right mindset, this incredible asset can turn into a liability, paving the way for bad habits and costly, impulsive trades.
The first step to building a solid trading process is knowing what not to do. Let's break down the most common traps traders fall into.
Chasing Alerts
This is, without a doubt, the most common mistake. A scanner dings, a stock flashes on your screen, and your first instinct is to jump in. This is called "chasing alerts," and it's a recipe for disaster.
An alert isn't a command to buy or sell. Think of it as a starting pistol, not a finish line. The scanner has done its job by flagging a potentially interesting situation. Now, it's your turn. Your job is to pull up the chart, check the broader market's mood, and see if the setup actually fits your personal trading plan.
Over-Optimization and Analysis Paralysis
On the other end of the spectrum is the "perfect" scan that never finds anything. This happens when you get lost in the weeds, adding so many filters that your criteria become impossibly specific. This is over-optimization.
You might design a scan that, in theory, only finds flawless, A+ setups. The problem? The real market is messy and rarely fits into a perfect little box. A good scan should filter out the junk but still give you a steady stream of ideas to analyze. If your scanner is dead silent for days, your criteria are probably too strict.
- The Problem: Your scan is so detailed it screens out everything, including good trades.
- The Solution: Start with broader criteria and tighten them up as you go. Focus on the few core conditions that truly define your strategy instead of trying to account for every tiny variable.
Ignoring the Broader Market Context
A scanner is a microscope, not a telescope. It’s laser-focused on individual stocks. An alert can show you a perfect bullish pattern for a single company, but if the entire market is tanking, that trade's odds of success just plummeted.
Trading without an eye on the major indices like the S&P 500 or NASDAQ is like sailing a small boat without checking the weather forecast. You might have the best boat in the harbor, but a storm will sink it all the same.
A rising tide lifts all boats, and a falling tide can sink even the sturdiest ships. Always check the market's direction before acting on an individual stock alert.
Using a scanner effectively means layering its signals with a top-down view. Is the market trending up, down, or chopping sideways? Is there a big economic report coming out? These questions provide the critical context that a scanner, by itself, can't give you.
Misinterpreting Volume Data
Volume is a favorite filter for many traders, but it’s often misunderstood. A common mistake is seeing a high-volume alert and automatically assuming it's all buying pressure. Not so fast. High volume simply means high interest. That interest could easily be driven by intense selling.
The use of real time stock scanning has exploded, with over 45 million retail investors now using these tools. While volume spikes are a popular filter—used by 68% of traders who focus on technicals—context is everything. You have to ask how that volume is affecting the price.
Is the stock surging upward on that high volume? That's a bullish sign. Is it collapsing on high volume? That's bearish. Always look at the price action alongside the volume to understand the full story. As you get more experienced, you can explore more insights about market data on Finviz to deepen your analysis. This approach ensures your scanner is an asset, not just a source of noise.
Of course. Here is the rewritten section, designed to sound like an experienced human expert, following all your provided guidelines and examples.
Frequently Asked Questions About Stock Scanning
Even after you get the hang of a real time stock scanning tool, some practical questions always pop up. I get them all the time. Let's tackle the most common ones traders have, moving past the technical stuff and into the strategic thinking that turns a scanner into a real partner in your trading.
Think of it as the final huddle before the opening bell. You know the plays, you've run the drills—now it's time to get a few last-minute questions answered so you can execute flawlessly when it counts.
Is a Real Time Stock Scanner Only for Day Traders?
This is probably the biggest myth out there. Look, for a day trader jumping in and out of positions in minutes, a real-time scanner isn't just helpful—it's essential. But that's just one way to use it. The real magic of a good scanner is that you can tune it to fit any trading style.
-
For Swing Traders: You're not looking for minute-by-minute action. Instead, you could set up a scan that runs once a day, maybe in the evening, to find stocks building multi-day patterns. Think bullish flags or consolidations near a key moving average. The alert isn't a "buy now" signal; it's a prompt to add that stock to your watchlist for a potential entry in the next few days.
-
For Long-Term Investors: Even buy-and-hold investors can get a ton of value here. You can build scans using fundamental filters, like a P/E ratio under 15, steady revenue growth, and a decent dividend yield. Then, set a price alert for when one of your target companies pulls back to an ideal entry point. It completely automates your "buy the dip" strategy.
The principle is the same no matter your timeframe. You tell the scanner what a perfect opportunity looks like to you, and it does the grunt work of finding it.
What Is the Difference Between Free and Paid Stock Scanners?
The difference between a free and a paid scanner really boils down to three things: data speed, feature depth, and how much you can customize it. A free scanner is fine for getting your feet wet, but for anyone serious about active trading, it's like bringing a knife to a gunfight.
The biggest issue is the data itself. Most free tools are working with data that's delayed by 15 minutes or more. In trading, 15 minutes is an eternity. A breakout could be long over by the time a free scanner even tells you it happened.
A paid scanner is an investment in professional-grade infrastructure. It gives you true, real-time data, a huge library of technical and fundamental filters, advanced alerts, and seamless charting integration.
Let's lay it out clearly:
| Feature | Free Scanners | Paid Scanners (like ChartsWatcher) |
|---|---|---|
| Data Speed | Delayed (often 15+ minutes) | True real-time, sub-second latency |
| Filter Options | Basic, limited selection | Extensive technical & fundamental library |
| Customization | Minimal, often preset scans | Fully customizable, saveable scan configs |
| Alerts | Basic or nonexistent | Advanced, multi-channel alerts |
| Market Coverage | Often limited to major exchanges | Comprehensive, including pre-market data |
For any trader whose strategy depends on timing, a paid subscription isn't an expense—it's a non-negotiable cost of doing business.
Can I Rely Solely on a Stock Scanner for Decisions?
No. Absolutely not. If you take one thing away from this, let it be this: a real time stock scanning tool is a discovery engine, not a decision-making oracle.
Its job is to sift through the thousands of stocks and all the market noise to bring you a short, manageable list of potential opportunities. That's it. That's where its job ends and yours, as the trader, begins.
An alert is a suggestion, not a command. It’s the market tapping you on the shoulder and saying, "Hey, something you told me you find interesting is happening over here. You should probably take a look." Blindly trading every alert that pops up is one of the fastest ways I know to blow up an account.
Once your scanner flags a stock, it's on you to do the real work:
- Analyze the Chart: Is the pattern clean? Where are the key support and resistance levels?
- Check the Context: What's the broader market doing today? Is this stock's sector hot or cold?
- Confirm Your Plan: Does this setup actually fit your trading plan and risk management rules?
Treat your scanner like a highly skilled research assistant. It brings you leads, but you’re the boss who makes the final call.
How Do I Know Which Filters Are Most Important?
The most important filters are the ones that perfectly mirror your trading strategy. There's no secret recipe that works for everyone. The trick is to start with your strategy first, then build a scan to match it—not the other way around.
Start by asking yourself a simple question: "What does my ideal, A+ trade setup look like?" Grab a pen and write it down in plain English.
For example, a momentum trader might write: "I'm looking for a small-cap tech stock, trading on way more volume than usual, that's just breaking out to a new all-time high on a day when the overall market is strong."
From that one sentence, you can pull out your core filters:
- Market Cap: Under $2 billion
- Sector: Technology
- Relative Volume: Greater than 5.0
- Price Action: New 52-Week High
- Market Condition: S&P 500 is positive for the day
See how that works? When you define your strategy first, the "most important" filters become obvious. Your scanner then becomes a custom-built tool designed for one purpose: to serve your specific approach to the market.
Ready to stop guessing and start targeting the market's best opportunities with precision? ChartsWatcher provides the professional-grade tools you need to build, test, and deploy powerful real-time scans that match your unique trading style. Take control of your trading workflow and discover the edge that real-time data provides.
