Build Your Winning Gap Up Stock Screener in ChartsWatcher
Why Gap Ups Are Worth Your Attention
Most traders see a gap up and think, "Meh, just random market noise." But I've learned over time that gaps actually whisper secrets to those who know how to listen. They can hint at potential momentum shifts, changes in sentiment, reactions to overnight news, and sometimes, even big institutional buying. Interpreting these "price jumps" is like unlocking a whole new level in the market, and ChartsWatcher is my go-to platform for navigating this. A solid gap up stock screener is absolutely key to grabbing these opportunities efficiently.
The Psychology of Gaps
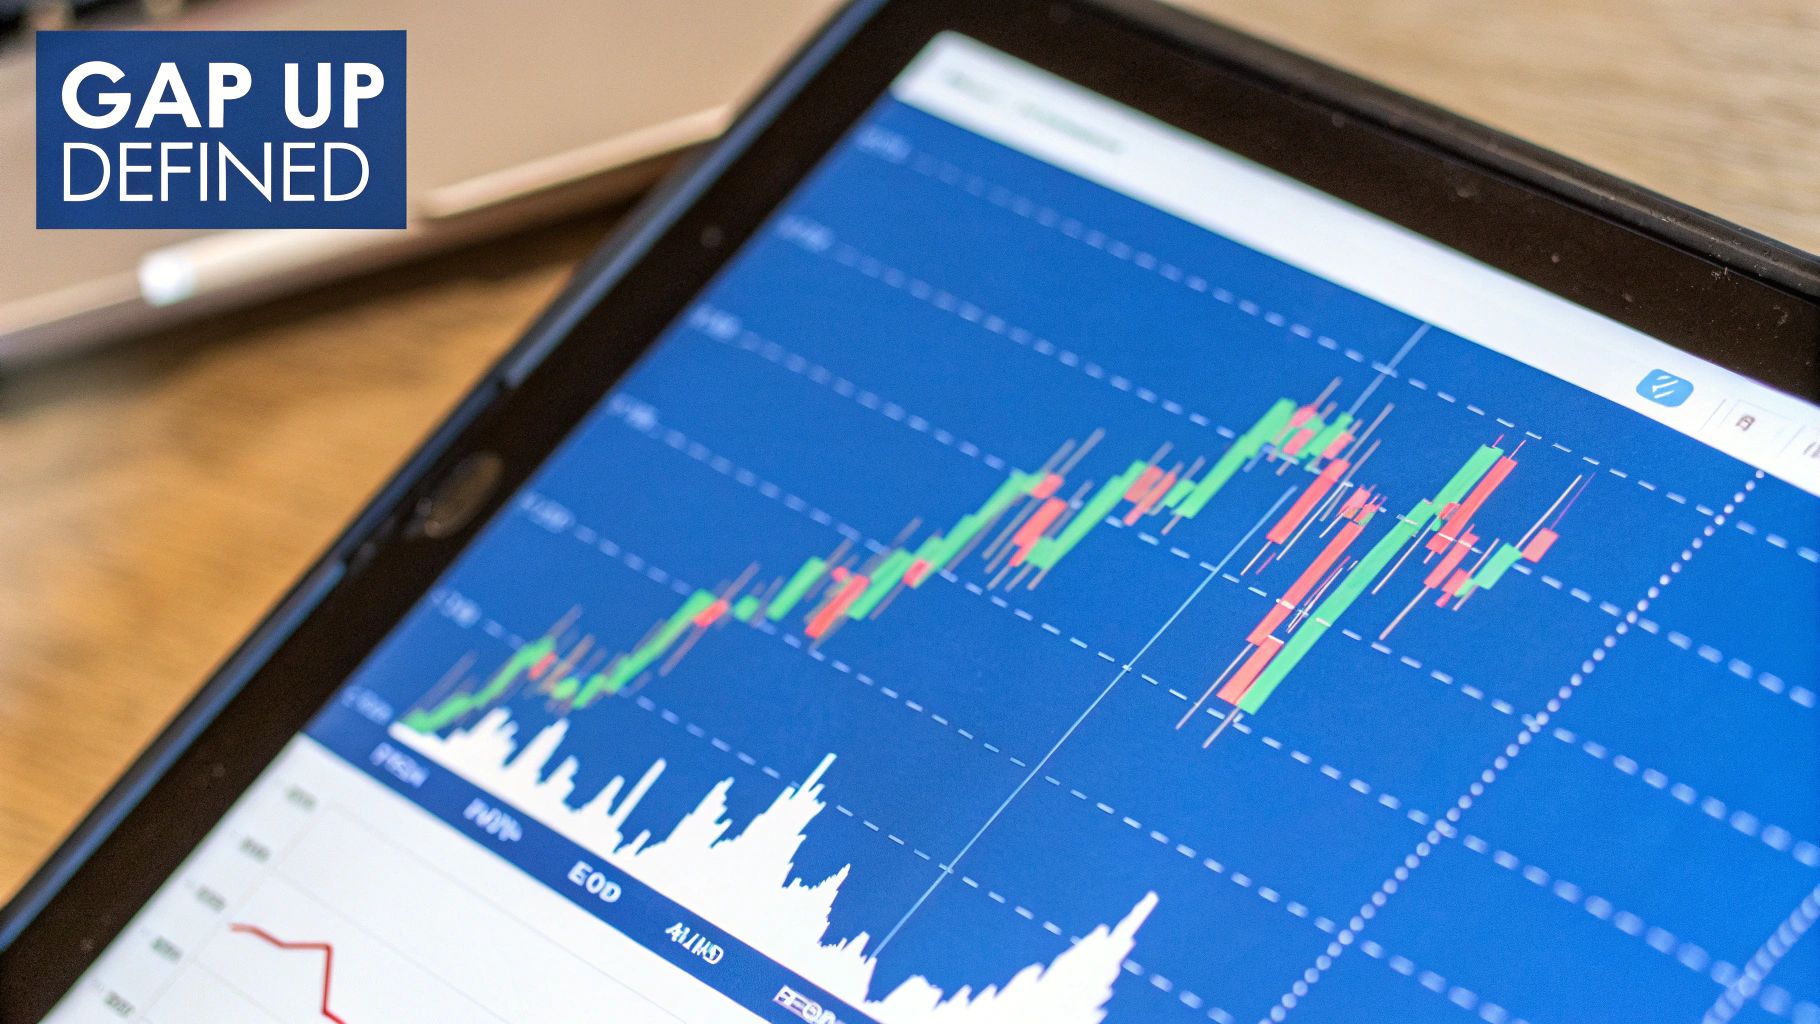
Gaps aren't just random price blips. They often show a sudden surge of buying pressure that boosts a stock's price higher before the market even opens. This pressure can come from a few different places, like good news releases, surprise earnings, or even a sudden wave of institutional investment. Understanding why these gaps happen is crucial to figuring out if they'll last. I've seen firsthand how a well-timed trade on a legitimate gap up can bring in some serious returns. But getting it wrong can sting, because some gaps disappear quickly, leaving traders holding the bag on a falling stock.
One crucial part of using a gap up stock screener is understanding what a gap actually is. It's that noticeable jump between one day's closing price and the next day's opening price, without any trading in between. This is really helpful for finding stocks that are attracting strong buying interest, often leading to an uptrend. An upward gap might show a continuing uptrend, while a downward gap could mean selling pressure and a possible continuing downtrend. Stock screens can pinpoint these gaps, especially in major markets like the US, which helps traders decide whether to buy, sell, or hold. Analyzing these gaps gives you a better feel for market sentiment and where the price might go next. A great example is the Barchart Gap Up Page, which ranks stocks by their gap up percentage. This gives you a quick look at stocks that opened way higher than their previous high. Check it out!
Differentiating Between Real Opportunities and False Signals
Let's be real, not all gaps are created equal. Some show real buying interest, while others are just temporary illusions. The trick is to figure out what separates the high-probability gap ups from the fades. My experience has taught me to watch for things like the volume that comes with the gap, the overall market sentiment, and the stock's recent price action. A powerful platform like ChartsWatcher lets me filter for these key factors, which saves me tons of time and makes my trading more accurate. Building a well-tuned screener in ChartsWatcher, specifically for your trading style, is like having a trusted expert constantly scanning the market. It's all about zeroing in on the gaps that truly matter.
Getting ChartsWatcher Dialed In For Gap Detection
Look, gap trading can be tricky. A lot of folks either make it way too complicated or they miss those small, but crucial, settings that make all the difference. Seriously, it's the difference between catching a real gap-up early and chasing it after everyone else is already on board. ChartsWatcher is a powerful tool for finding these setups, but you've got to know how to use it. Let me share some of my personal tips.
Price Filters: Separating the Wheat From the Chaff
First up, price filters. These are essential for separating the real opportunities from the random noise of the market. Let's say you’re only looking for stocks gapping up more than 2%. In ChartsWatcher, you can set a minimum gap percentage to automatically filter out anything smaller. This helps you zero in on moves that actually have potential. I've learned that tweaking this percentage based on how volatile the market is can really cut down on false signals. If the market's choppy, I might bump my minimum gap up to 3% or even 4%.
Volume: The Real Indicator of Interest
Next, let's talk volume. Volume tells a story. A gap-up on high volume usually means there's real institutional interest, not just a random price spike. In ChartsWatcher, you can filter for stocks gapping up with much higher pre-market volume than usual. Think of it this way: if a stock normally trades 10,000 shares pre-market, and suddenly it's trading 100,000, that's a huge sign (a good one!). It tells you something's driving that stock higher, and it might be the start of a sustained move. I've seen this pattern over and over again, and it’s a key filter in my gap-up stock screener.
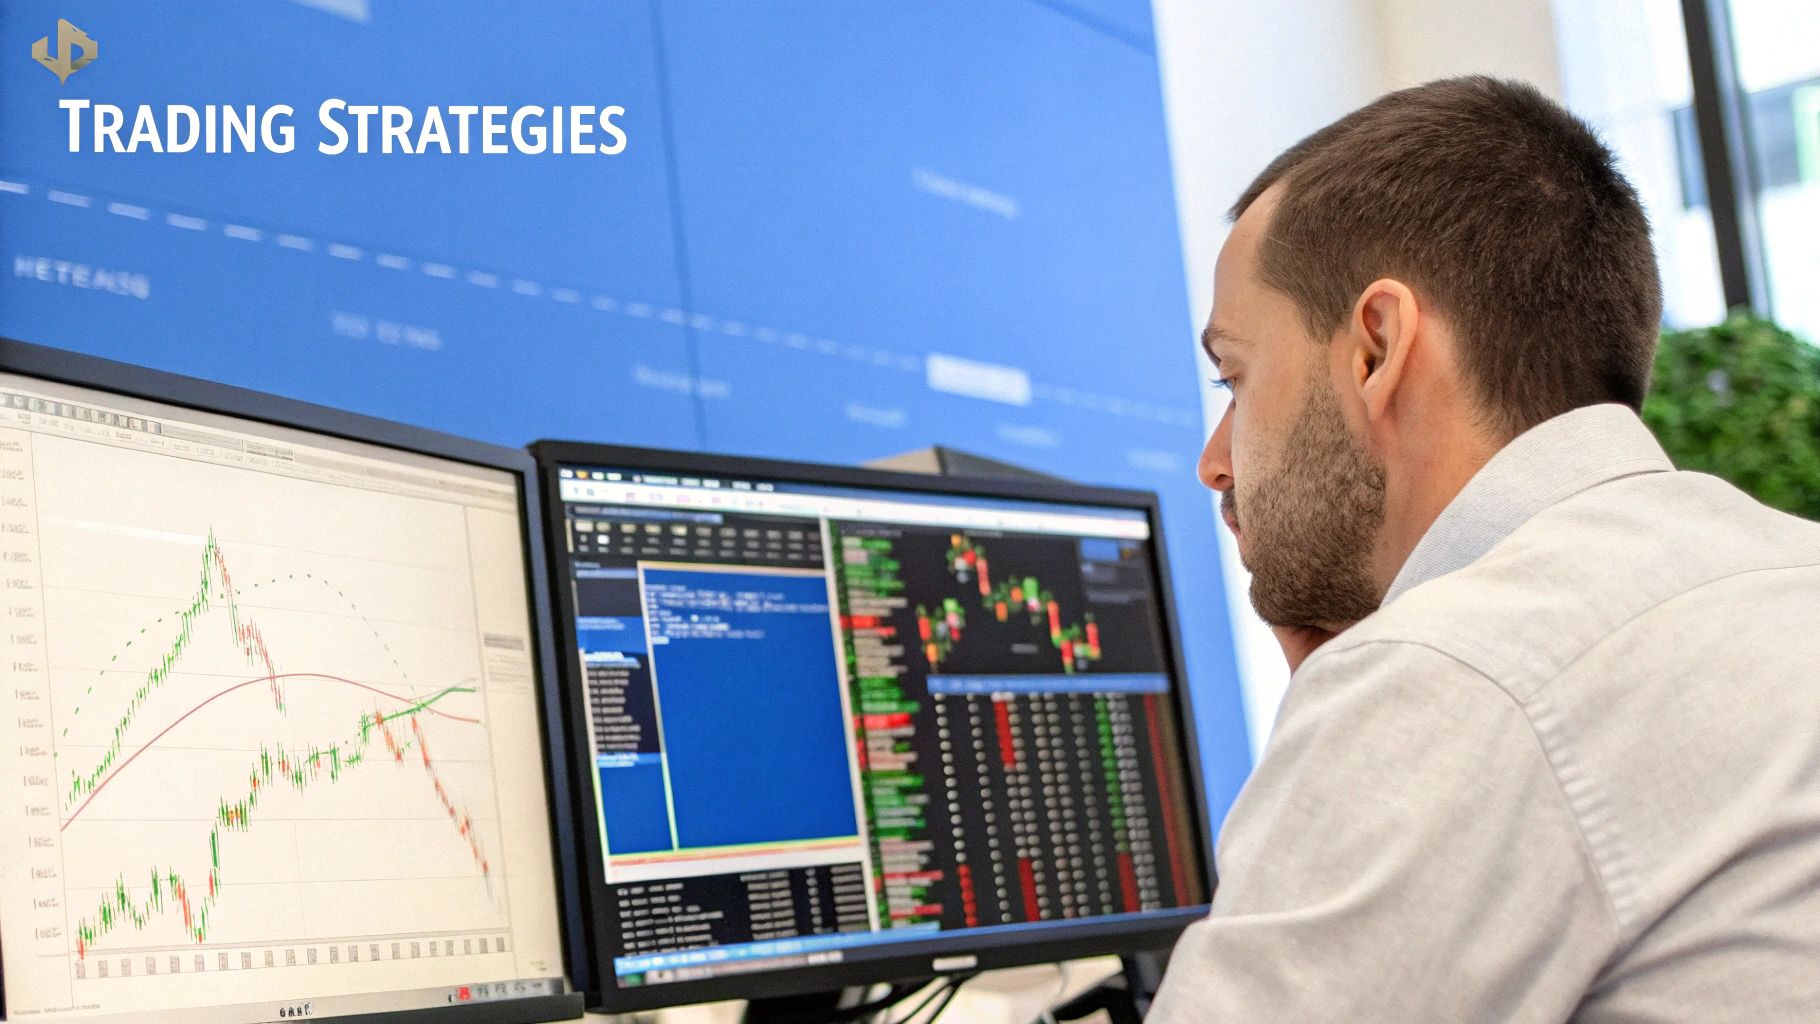
This screenshot shows a typical ChartsWatcher dashboard setup for pre-market gap scanning. See how you can customize the windows to track real-time price changes, volume spikes, and even pre-market news? Having all of this in one place is a real game-changer for fast-paced pre-market trading. If you want to learn more about effective scanning strategies, check out this guide on mastering stock scanning for day trading.
Timing and Alerts: Your Early Warning System
Lastly, let's talk timing and alerts. The key is to catch these gaps early, before everyone else is talking about them. Setting pre-market time parameters in ChartsWatcher lets you focus your scanner on the action between, for example, 4:00 AM and 9:30 AM EST. This way, you can spot potential plays before the market even opens. Even better, set up alerts to get notified the instant a stock matches your gap-up criteria. This keeps you informed without getting bombarded with unnecessary notifications. Believe me, waking up to a flood of alerts for gaps that have already fizzled out is not a good way to start the day. This setup keeps you in the loop without the overload.
The Filters That Actually Make Money
That’s my trading desk in the image – pretty clean, right? I like to keep it that way so I can focus on what matters: finding winning gap-up trades using my ChartsWatcher stock screener. A clear workspace equals a clear mind, especially when you're dealing with the fast-paced world of gap trading.
Forget those crazy complicated screeners with a million filters. Honestly, in my experience, they often miss the forest for the trees. I've analyzed tons of gap trades and discovered just a handful of key filters consistently separate the wheat from the chaff. And it’s not what most people think. Volume is important, sure, but it’s not everything. You need unusual volume – and knowing the difference between real institutional interest and a spike from a random news alert or social media frenzy is key. Want to get even sharper with pre-market analysis? Checking out resources on Crypto Technical Analysis can offer helpful insights on spotting those potentially lucrative gap-ups. Crypto Technical Analysis is a good starting point.
Fine-Tuning Your Gap Up Stock Screener
Your percentage gap thresholds shouldn't be static. They need to be dynamic, changing with the market’s mood swings and overall volatility. A 2% gap might be huge in a quiet market but insignificant during a volatile period. I remember back in March 2020; I was seeing gaps of 10% or more that vanished within minutes. That market crash taught me a valuable lesson: adjust my gap percentage filter based on the overall market craziness!
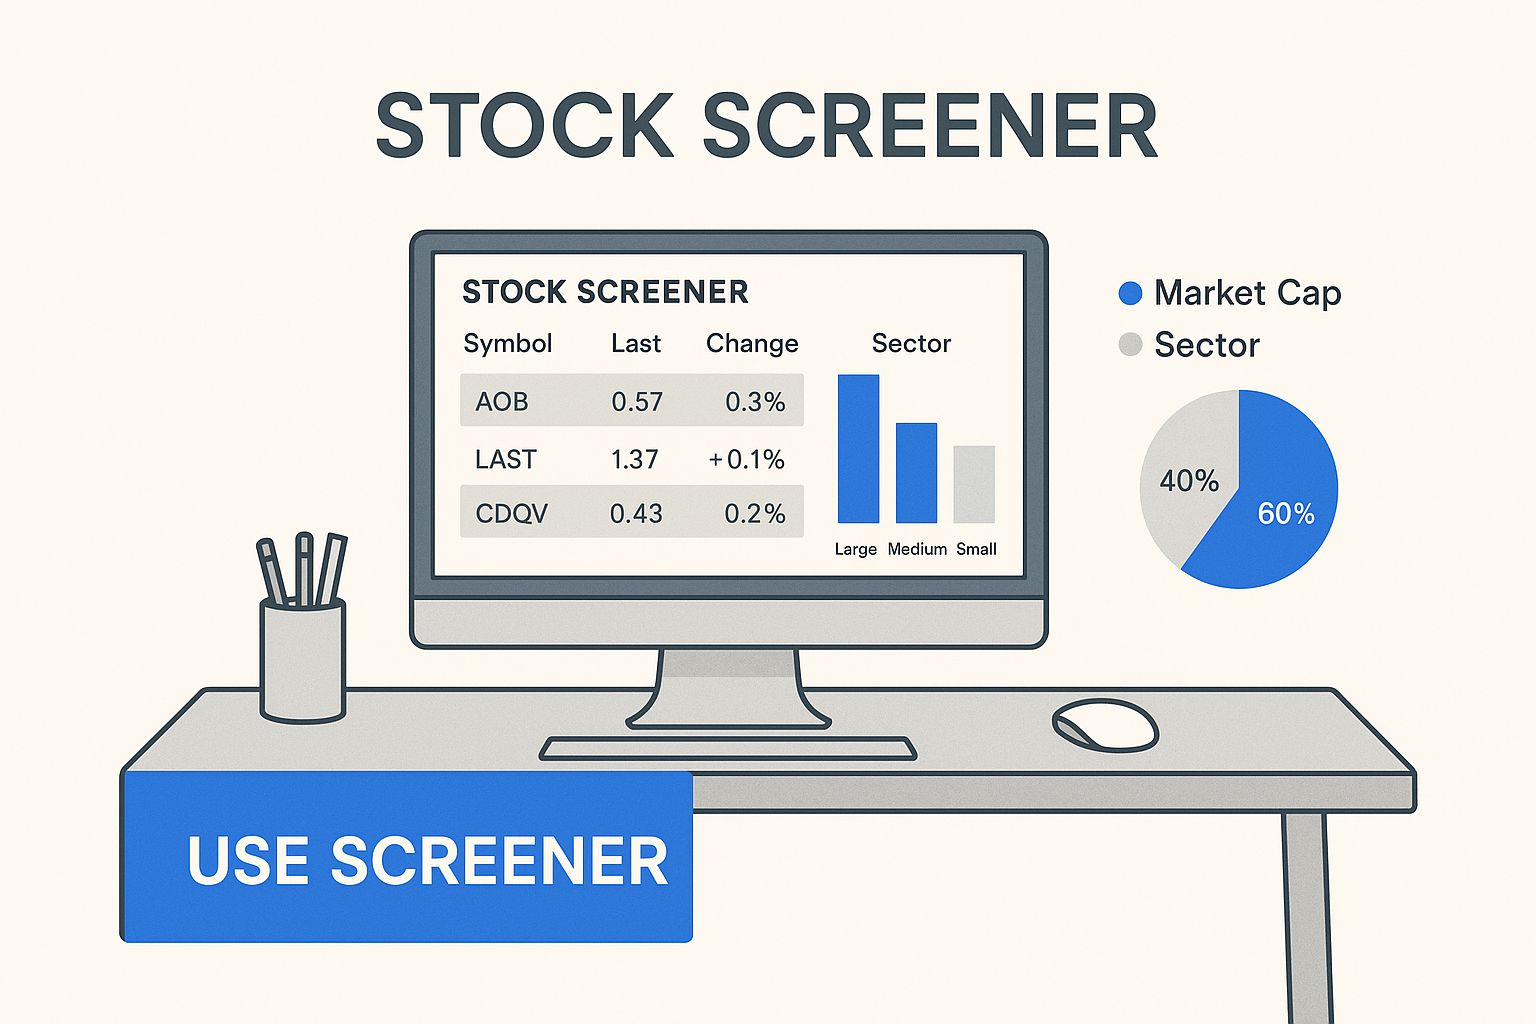
Market Cap: Your Secret Weapon
Market cap filtering is how you avoid those pesky trap stocks. These stocks might gap up, but there's simply not enough volume to sustain a meaningful move. They’re all flash and no substance. Early in my trading career, I fell for this trap – chasing small-cap gaps that looked fantastic on paper but lacked the liquidity for a clean exit. Not fun. Filtering for a minimum market cap makes sure you’re trading stocks with enough volume to actually make a profit. Want a refresher on what a stock screener is and its benefits? Check out this resource: what a stock screener is and how it can help you.
Let’s talk about finding that sweet spot between filtering too much and missing out on good opportunities.
To illustrate this balance, take a look at the table below summarizing essential filter settings:
Essential Gap Screener Filter Settings Comparison of filter settings for different trading styles and risk tolerances
| Filter Type | Conservative Setting | Moderate Setting | Aggressive Setting | Purpose |
|---|---|---|---|---|
| Percentage Gap | 2% - 5% | 5% - 8% | 8% + | Defines the minimum price gap to identify potential opportunities. |
| Volume (Relative to Average) | 2x - 3x | 3x - 5x | 5x + | Ensures sufficient trading activity to support price movements. |
| Market Cap (Minimum) | $500 Million | $250 Million | $100 Million | Filters out illiquid stocks prone to volatile swings. |
| Price Range (Daily) | $5 - $10 | $2 - $5 | $0.50 - $2 | Focuses on stocks with enough price movement potential. |
As you can see, a more conservative approach utilizes stricter filters, prioritizing higher quality setups over quantity. Conversely, a more aggressive approach loosens the filters, accepting increased risk for a broader range of potential trades. It’s all about your personal risk tolerance and trading style.
Balancing Strictness with Opportunity
It's a balancing act, like fishing. You want a net that catches the big fish but lets the little ones go. Coming up, we'll use real-world examples to show you exactly how to achieve this, why price range is more important than you think, and the optimal timing windows the pros use for gap trading.
Decoding Pre-Market Action Like A Professional
Pre-market trading, that special window between 4 AM and 9:30 AM EST, is where the day's story really begins to unfold. It’s like getting a sneak peek at the market’s script before the curtain rises. Many traders, however, miss the valuable clues hidden within this period. The big question is: will that exciting gap up hold, or will it fade the moment the opening bell rings? Pre-market action holds the answer.
Now, volume behaves differently in pre-market. Low volume doesn’t automatically mean weak interest, and high volume doesn’t guarantee a continued surge. It's all about the subtleties. For example, imagine a sudden burst of volume coupled with a widening bid-ask spread just before the market opens. That might signal strong institutional accumulation. On the other hand, consistent but moderate volume throughout pre-market could indicate steady retail interest. These nuances often determine whether a gap up has legs.
Historically, stocks with big pre-market gaps have shown some impressive price movements. Take GoPro, Inc. (GPRO), for example. It has seen some serious pre-market gains, sometimes jumping as much as 6.74% in a single pre-market session. This really highlights the potential of watching pre-market activity, especially for stocks poised to gap up. Discover more insights on pre-market gappers. Other stocks like SUNation Energy, Inc. (SUNE) and PET Wag Group Co. have also shown notable pre-market gaps, hinting at potential upward momentum.
Identifying Gaps with Staying Power
Learning to read these pre-market signals is crucial for anyone using a gap up stock screener. Let's say you’re watching a stock that gaps up 5% pre-market. If the volume with that gap is way higher than the stock’s usual pre-market volume, that's a good start. But, you also have to look at the bid-ask spread. A widening spread could suggest strong demand outpacing supply, a sign that buyers are piling in.
The Global Influence on Pre-Market Activity
Don't forget about the global picture. News from international markets can create gap opportunities in U.S. stocks that often get overlooked. Positive news from Asian markets overnight, for instance, can cause a gap up in related U.S. stocks before the U.S. market even opens. Keeping an eye on global events can give you a real edge.
Another tip: the timing of pre-market activity matters. Activity closer to the opening bell generally carries more weight than activity in the wee hours of pre-market. This is simply because it reflects the most up-to-date sentiment and market conditions.
What The Numbers Actually Tell You About Gaps
Data can be tricky. It's not about whether it's right or wrong, but how you interpret it. After analyzing countless gap moves across various market conditions, I've noticed some surprising trends. Gap fill rates are influenced by market sentiment, the specific industry, and the initial gap size. But don't worry, there are definitely some statistical tendencies we can use to our advantage.
Understanding Gap Fill Rates and Market Volatility
Understanding pre-market activity means considering global financial influences and how they affect money flow. For instance, a resource on international money transfer can offer valuable insights. Getting back to gaps, looking at gap-up moves statistically can reveal a lot about market dynamics and trends. Take the SPDR S&P 500 ETF Trust (SPY), for example. Over a three-year period, the average move from the 12 largest gap-ups was around 2.4%, with the largest single opening gap reaching 3.7%. This data gives us a sense of how gap-ups can affect both the overall market and individual stocks.
By analyzing this historical data, we can develop strategies that use gap analysis to anticipate market moves and improve our trading decisions. Observing these gaps can also help us pinpoint periods of intense market sentiment, such as times of significant economic policy changes or geopolitical events. These events can have a dramatic impact on stock prices. In volatile markets, you might see more smaller gaps, but these can fill quickly. In calmer markets, larger gaps might be less frequent, but they could result in bigger, sustained price movements.
Continuation Patterns Versus Reversal Signals
Here’s the catch with gaps: they don’t always mean a stock will continue rising. Sometimes, a gap up is actually a reversal signal, especially if it’s followed by low volume or negative news. This is why a gap up stock screener like ChartsWatcher becomes so valuable. It helps us filter for specific criteria that improve our chances of finding winning trades, like unusual volume and price momentum.
Let's look at some historical data to illustrate how market conditions impact gap performance:
Gap Performance Statistics by Market Conditions Historical data showing gap success rates under different market environments
| Market Condition | Gap Fill Rate | Average Hold Time | Success Rate | Risk Level |
|---|---|---|---|---|
| Bull Market | 40% | 3 Days | 70% | Low |
| Bear Market | 70% | 1 Day | 30% | High |
| Sideways Market | 55% | 2 Days | 50% | Medium |
This table demonstrates how drastically gap fill rates, hold times, and success rates can change based on the prevailing market conditions. In bull markets, gaps are less likely to fill, offering higher success rates and longer hold times. Conversely, bear markets see higher gap fill rates, lower success rates, and shorter hold times.
Seasonal Trends and Market Conditions
Even the time of year can influence gap behavior. Earnings season, for example, tends to create more volatility and, consequently, more gap opportunities. However, these gaps can also be riskier due to increased uncertainty. Certain economic announcements or industry-specific shifts can also lead to predictable gap patterns. Recognizing these patterns is key to successful gap trading.
Advanced Techniques That Separate Winners From Losers
So, you’ve built your basic gap-up stock screener in ChartsWatcher. That's awesome! But truth be told, setting up a basic screener is just the first step. What truly separates the consistently profitable traders from the occasional winners? It's all about mastering the advanced techniques. Think of them as the secret sauce, the nuanced strategies the pros use to uncover those hidden gems.
Multiple Timeframe Analysis: Connecting the Dots
Just glancing at different charts isn’t enough. True multiple timeframe analysis involves understanding the interplay of gap signals across various timeframes. Does that 5-minute gap-up align with a daily breakout? Or is it going against a larger downtrend you see on the weekly chart? From my experience, confirming those gap signals across multiple timeframes drastically improves the odds of a winning trade. It's like getting several opinions before making a big decision.
Unusual Volume: Beyond the Surface
Spotting unusual volume is more than just noticing a spike. It's about digging deeper and understanding the why behind that volume. Is it driven by institutional investors, or is it just retail traders caught up in FOMO? While ChartsWatcher lets you filter for unusual volume compared to a stock’s average, I personally like to look at the rate of change in volume. A sudden acceleration, especially pre-market, often hints at big price moves coming. It's one of my go-to filters in my own gap-up screener.
Relative Strength: Finding the Leaders
Even with gapping stocks, some are simply stronger than others. Relative strength metrics help you zero in on the real leaders. I often compare a stock’s gap percentage to the market or its sector. A stock gapping up 5% while the market is flat is far more interesting than one gapping 5% in a market already up 3%. This small adjustment helps me identify the true outperformers.
Integrating Fundamentals: The Bigger Picture
This is where things get really interesting – combining fundamental catalysts with your technical gap signals. Did positive earnings news cause the gap? A new product launch, perhaps? Understanding the underlying reason for a gap is key. I've even developed a simple scoring system that ranks gap opportunities based on both technical and fundamental factors. It’s a great way to prioritize the most promising setups.
Adapting to Market Conditions: Staying Agile
Your gap-up stock screener shouldn't be set in stone. You have to adjust your criteria based on the current market environment. In volatile markets, I tighten my filters, focusing only on the highest-quality gaps. In calmer markets, I might loosen them up a bit to capture more opportunities. It’s all about adapting to the ever-changing market. This is where experience and constant learning become invaluable.
Your Daily Gap Trading Game Plan
Look, theory and practice are two different things. So, let's forget the abstract stuff and build a practical gap trading system you can actually use every single day. This isn't some generic plan; think of it as your personal roadmap for getting the most out of your gap up stock screener in ChartsWatcher.
Morning Routine: Maximizing Pre-Market Prep
Your morning routine really sets the stage for your entire trading day. Instead of rushing around at the last minute, I've found a structured pre-market prep process works wonders. I like to set aside 30-45 minutes each morning to go over my ChartsWatcher scans, zeroing in on the gap-ups with the most potential. This gives me time to identify key levels, check the pre-market volume, and plan my trades before the market opens. It's like a pre-game strategy session, getting your head in the game.
Position Sizing: Balancing Risk and Reward
Protecting your capital is absolutely essential. You need position sizing rules that limit your risk on any single trade. Personally, I never risk more than 1% of my total trading capital on a gap trade, no matter how good it looks. This keeps emotions in check and helps you ride out those inevitable losing streaks. Believe me, everyone has them!
Realistic Expectations: No Lambos Overnight
Let's be honest: getting rich overnight is a pipe dream. Set achievable goals based on what real traders actually accomplish, not what you see on social media. Consistent profits in gap trading come from discipline and risk management, not swinging for the fences. My target is a 60% win rate on my gap trades. Some months are better, some are worse, but consistent execution over time yields sustainable results.
Checklists and Guidelines: Removing Emotion
Emotional trading will destroy your account. Develop checklists for evaluating gap opportunities. Mine includes things like pre-market volume, gap percentage, overall market sentiment, and how the price has been acting recently. A checklist takes the guesswork out and keeps my trading objective. Clear entry and exit rules reinforce this, preventing impulsive trades driven by fear or greed. I always use pre-determined profit targets and stop-loss levels based on my technical analysis.
Tracking and Adapting: Continuous Improvement
Tracking your trades isn't just about wins and losses; it's about understanding why things played out the way they did. I keep a detailed log of every gap trade, noting the factors that contributed to the outcome. This helps me refine my approach, identify weaknesses, and constantly improve my system. The market is always changing, and so should your gap trading game plan. Regularly review and adjust your screener settings, filters, and trading rules to stay ahead of the curve.
Ready to take your gap trading to the next level? Start your free trial with ChartsWatcher today and unlock the power of a truly customizable stock screener: ChartsWatcher
