A Trader's Guide to the Reverse Head and Shoulders Pattern
If you've spent any time looking at charts, you've probably heard of the reverse head and shoulders pattern. It’s one of those classic formations that traders get excited about, and for good reason—it’s widely considered one of the most reliable signals that a downtrend is losing steam and a new uptrend is about to begin.
Think of it as the chart telling a story. It visually captures the final, exhausted push from sellers before buyers finally wrestle back control.
The Market's Premier Bullish Signal: What's the Story Behind the Shape?
Picture a stock that's been in a brutal downtrend for weeks. Sellers have been in the driver's seat, pushing the price lower with every rally attempt getting smacked down. But eventually, that downward momentum starts to fizzle out. The reverse head and shoulders pattern captures this entire power struggle, unfolding in three distinct acts.
This pattern is the mirror opposite of the more famous (and bearish) head and shoulders top. Instead of marking a potential peak, it helps us spot a potential market bottom. For a trader, seeing this pattern take shape is a huge advantage. It’s an opportunity to get in on a new uptrend right as it’s starting, often before the rest of the market catches on.
The Anatomy of the Pattern
At its core, the pattern is made up of three distinct troughs and a critical resistance line called the neckline. Getting to know each part is the key to telling a real signal from a fakeout.
-
The Left Shoulder: This is the first significant low in the pattern. Buyers step in for a bit, creating a small rally, but the sellers are still too strong and push the price back down. Act one.
-
The Head: Here, the sellers make their final, all-out push, creating the lowest point of the entire pattern. This often happens on weaker volume, which is a subtle clue that the bears are running out of gas. This is the climax of their power.
-
The Right Shoulder: This is the third low, but crucially, it’s higher than the head. This is the big tell. Buyers are stepping in earlier and with more conviction, preventing the price from making a new low. The tide is turning.
-
The Neckline: This is a simple trendline connecting the high points of the two rallies that formed after the left shoulder and the head. It acts as a ceiling of resistance.
Think of the neckline as a line in the sand. The buyers test it once after the left shoulder and get rejected. They regroup at the right shoulder, gather more strength, and then finally smash through it. That breakout signals they are officially in control.
Before we dive deeper, let's break down these components into a quick-reference table. This helps visualize how each piece of the puzzle fits together to form a powerful trading signal.
Reverse Head and Shoulders Pattern Core Components
| Component | What It Represents | Key Confirmation Signal |
|---|---|---|
| Left Shoulder | First attempt by buyers to reverse the downtrend, but sellers remain in control. | Forms the first peak of the neckline. |
| The Head | The point of maximum seller strength and the final low of the downtrend. | Often accompanied by declining volume, showing seller exhaustion. |
| Right Shoulder | A higher low, indicating buyers are gaining significant strength. | Confirms that bearish momentum is failing. |
| The Neckline | A critical resistance level formed by connecting the peaks. | A decisive price break above this line on high volume. |
Essentially, mastering this pattern isn’t just about spotting a shape. It's about reading the market's underlying story—the exhaustion of sellers and the rising confidence of buyers. When you see that structure culminating in a powerful neckline break, you're looking at a high-probability setup for a major trend reversal.
The Anatomy of a Bullish Reversal
To really get a feel for the reverse head and shoulders pattern, you have to look past the squiggles on a chart and understand the human psychology driving the action. Think of it as a three-act play that dramatizes the shift in power from sellers to buyers. Each part of the formation tells a critical piece of the story.
The whole pattern is a battleground. It’s where a dying downtrend gives its last gasp and a brand new uptrend is born. It starts with sellers firmly in control, moves into a messy tug-of-war, and ends with buyers decisively taking over.
Act One: The Left Shoulder and the First Crack in the Armor
The story opens with a clear downtrend. Sellers have been in the driver's seat, pushing the price lower, and the mood is gloomy. The left shoulder takes shape when the price hits a new low and then bounces. That little rally is the first sign of life from the buyers.
But that buying pressure doesn't last long. The bearish momentum is still too strong, and it shuts down the rally, pushing the price back down. The key thing to notice here is that while sellers are still in charge, the buyers have shown up. They're willing to defend a certain price level. This is the first crack in the sellers' armor.
Act Two: The Head and the Point of Maximum Pessimism
After the temporary relief rally of the left shoulder, sellers get their confidence back and shove the price to a new, lower low. This absolute bottom of the pattern is the head. Psychologically, this is the darkest moment. It feels like the downtrend is just going to keep going forever.
But this is where a critical clue often appears: volume. As the head forms, you'll often see trading volume dry up. This is a huge tell. It suggests the sellers' final push is weak and lacks broad participation. They're running out of gas—a classic case of seller exhaustion or capitulation. The bears made their last stand, but it was on shaky ground.
The head of a reverse head and shoulders pattern represents the final, exhaustive gasp of a downtrend. It's where sellers throw everything they have at the market but fail to attract new sellers, signaling their impending defeat.
This stage is everything because it sets the floor for the entire reversal. The failure to keep the selling pressure on at this new low is the market screaming that the downtrend is on its last legs.
This flow from seller fatigue to buyer victory is what the whole pattern is about.
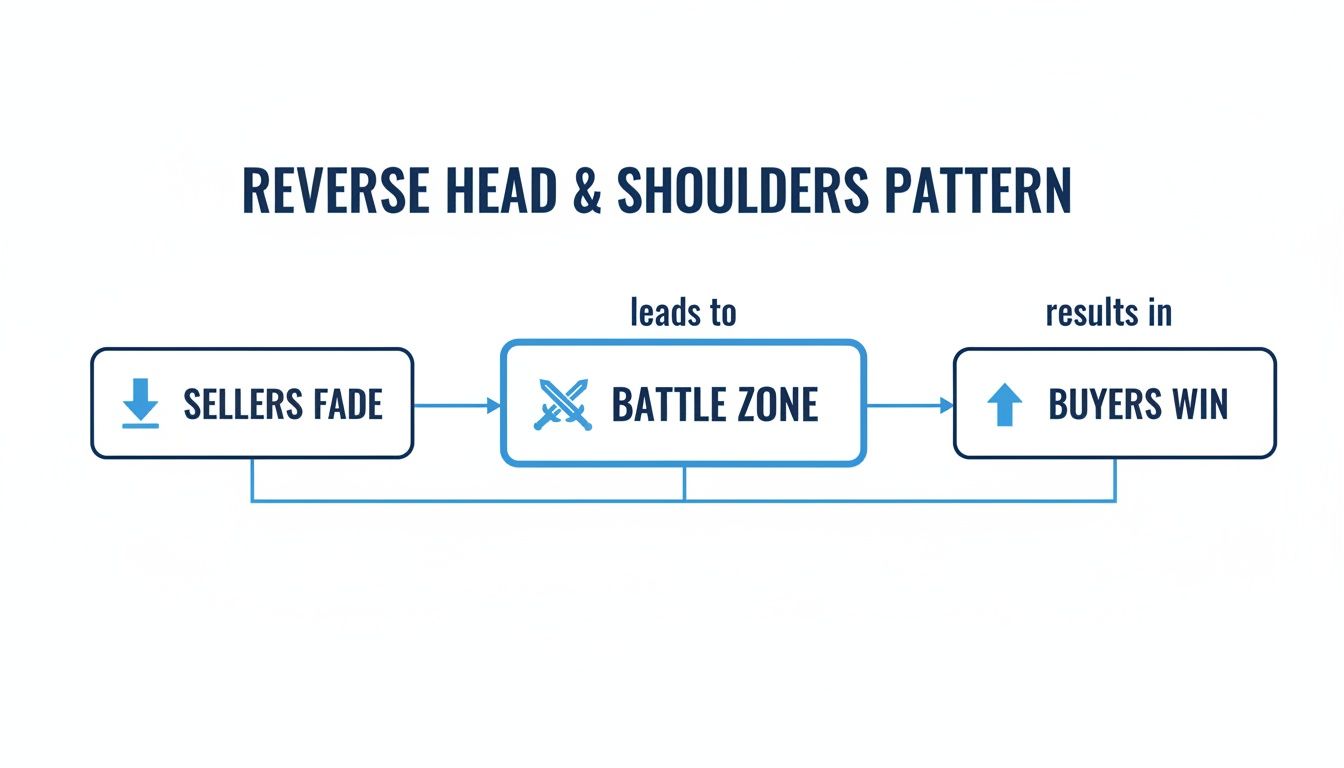
This visual really drives home the psychological battle at the heart of the pattern, ending with a clear win for the buyers.
Act Three: The Right Shoulder and the Buyer's Ascent
Once the head is in, the price rallies again, much like it did after the left shoulder. This rally usually pushes up to a similar high, forming the second anchor point for the neckline. Now, the really important part of the reversal starts to take shape.
Sellers try one more time to push the price down, but they can't even get close to the low of the head. This third dip, the right shoulder, forms at a higher level than the head. This is the ultimate confirmation that the power has shifted. Buyers are now stepping in sooner and with more conviction.
That higher low of the right shoulder is a massive bullish signal. It proves that selling pressure is fading fast while buying demand is picking up. The market is simply refusing to go lower, carving out a new, stronger level of support. The symmetry you often see between the shoulders is a hallmark of a classic, reliable setup.
This isn't just some random shape; it's a historically dependable sign of a bullish reversal. In fact, the reverse head and shoulders pattern has an impressive 75% accuracy rate as a bullish signal, according to extensive backtesting. This high success rate makes it a favorite among pro traders. They often use tools like ChartsWatcher to scan for these setups, filtering for breakouts that happen on a volume spike of 25-40% above average to confirm real buying conviction. You can find more details from the comprehensive backtesting at Quantified Strategies. The pattern's reliability is also a bit of a self-fulfilling prophecy—as soon as big institutional traders spot it, they pile in, adding more fuel to the new uptrend.
Confirmation Signals to Avoid False Breakouts

Spotting a potential reverse head and shoulders is exciting, but it's only half the battle. A promising pattern is just that—potential. You need solid confirmation before you risk a single dollar.
Without it, you're walking straight into a "false breakout," one of the most expensive traps in trading where the price teases a reversal only to collapse back into the downtrend. To sidestep these fakes, seasoned traders rely on a checklist. Think of them as the green lights you need before hitting the gas.
The three most critical signals are a decisive break of the neckline, a surge in trading volume, and a possible retest of that same neckline. Each one stacks the odds a little more in your favor.
The Decisive Neckline Break
The neckline is the line in the sand. It's the final ceiling that has capped every rally attempt during the pattern's formation. A true reversal is only on the table once the price closes firmly above this level.
A weak little poke above the line that immediately fizzles out doesn't count. You want to see a strong, confident candle close well above that resistance. This move is a clear signal that buyers have finally overwhelmed the sellers who were defending that price.
A breakout without a confirmed close is just market noise. A close above the neckline is the official announcement that the old downtrend is over and a new potential uptrend has begun.
For many traders, this decisive close is the primary trigger. It's the most aggressive entry, confirming that momentum has officially shifted.
Volume: The Ultimate Proof of Commitment
If the neckline break is the signal, trading volume is the exclamation point. A legitimate breakout should always be powered by a significant spike in volume. This surge is the market’s way of stamping its approval on the move.
Why is volume so critical?
- It Signals Big Money: A volume spike often means large institutions are piling in, adding serious firepower and momentum to the new trend.
- It Shows Conviction: High volume means a lot of traders agree on the new direction, making a quick failure less likely.
- It Confirms Strength: A breakout on thin, quiet volume is highly suspicious. It has a much greater chance of being a head fake.
Ideally, you want to see volume on the breakout day jump 30% to 50% or more above its recent average. This is the concrete proof you need that the buying pressure is real. To dig deeper into how volume confirms price action, check out our guide on https://chartswatcher.com/pages/blog/trading-with-volume-a-modern-guide-to-market-analysis.
The Neckline Retest: A Second-Chance Entry
After a powerful breakout, it's very common for the price to pull back and "retest" the neckline it just smashed through. New traders often panic here, but it’s actually a healthy sign. The old resistance ceiling is now acting as a new support floor.
This retest offers a fantastic second chance to get into the trade, often with a much better risk-to-reward ratio. More conservative traders actually prefer waiting for this pullback because it provides another layer of confirmation—the market is respecting the breakout level.
This leaves you with two main entry choices:
- Aggressive Entry: Jump in as soon as a candle closes above the neckline. You get in early but might pay a higher price.
- Conservative Entry: Wait for the price to pull back to the neckline, then enter as it bounces off that new support.
Which one is right for you boils down to your personal risk tolerance. The aggressive entry ensures you don't miss the move if it launches immediately. The conservative entry offers a clearer, lower-risk setup if the retest happens.
Of course, no matter which entry you take, a crucial part of your defense is knowing how to set stop losses to protect your capital if the market turns against you.
Building Your Trading Strategy Around the Pattern
Knowing how to spot the reverse head and shoulders pattern is one thing. Turning that knowledge into a profitable, repeatable trading plan is what separates the amateurs from the pros.
A solid strategy isn't just about identifying the shape; it's a complete framework. It dictates exactly how you enter, where you place your safety nets, and when you take your profits. Building this framework removes emotion and guesswork, giving you a clear roadmap for every trade so you act with discipline, not just react to market noise.
Let's break down the essential pieces of a robust strategy built around this powerful bullish signal.
Pinpointing Your Entry Strategy
Once you've confirmed a breakout, you have two primary ways to get into the trade. Neither is flat-out better than the other; the right choice comes down to your personal risk tolerance and trading style.
-
The Breakout Entry (Aggressive): This means jumping in as soon as a candle closes decisively above the neckline. This approach is for traders who want to get in early and are willing to accept a slightly wider stop loss to avoid missing a potential rocket launch. The risk? You might get in right before a pullback, leading to some immediate drawdown.
-
The Retest Entry (Conservative): This strategy demands more patience. You wait for the price to break out, then pull back to retest the old neckline, which should now act as a floor of support. You enter as the price bounces off this level, confirming its new role. This method often gives you a tighter stop loss and a better risk-to-reward ratio, but there's always a chance the price never retests and you miss the move entirely.
Both are valid, but the retest entry often offers a higher probability setup. In fact, studies show that roughly 45% of breakouts pull back to the neckline, and trades entered on these retests tend to have higher win rates.
Placing Your Stop Loss for Capital Protection
Your stop loss is your last line of defense. It's the pre-planned point where you admit the trade isn't working and get out to protect your capital. Getting this right is critical.
A common mistake is setting your stop too tight, where normal market chop can knock you out of an otherwise good trade. For a reverse head and shoulders, there are two logical spots for your stop:
- Below the Right Shoulder: This is the most common and secure location. Placing your stop just below the low of the right shoulder gives the trade plenty of room to breathe. If the price breaks below this point, the entire bullish structure of the pattern is invalidated anyway.
- Below the Neckline: After a breakout and a successful retest, some traders will place their stop just below the neckline. This is a much tighter stop, better suited for aggressive traders, but it carries a higher risk of being triggered by market noise.
Your stop loss isn't an admission of failure; it's a tool of professional risk management. It ensures that one bad trade can never wipe out your account, allowing you to stay in the game long-term.
Setting Clear Profit Targets
The reverse head and shoulders pattern gives us a classic, built-in method for setting a profit target. This technique, called the measured move, provides an objective target based on the pattern's own geometry.
Here’s how you calculate it:
- Measure the Height: Figure out the vertical distance from the lowest point of the head straight up to the neckline.
- Project from the Breakout: Take that exact same distance and project it upward from the point where the price broke through the neckline.
That projected level becomes your main profit target. While it's a reliable guide, smart traders often look to take partial profits at other key resistance levels on the way up. This approach lets you lock in gains while still giving a piece of your position a chance to run to the full target. This blend of a calculated target and proactive profit-taking is a hallmark of a disciplined trading strategy.
Real-World Examples of the Pattern in Action

Theory is one thing, but to really master the reverse head and shoulders pattern, you have to get your hands dirty and see it play out on live charts. Moving beyond textbook diagrams is where abstract knowledge becomes a tangible trading edge.
Analyzing actual trades lets us see the entire lifecycle of a reversal unfold. We get to watch the preceding downtrend, feel the psychology behind each trough, spot the critical volume signature, and pinpoint the decisive neckline break and subsequent rally. This is how you build real pattern recognition skills.
Case Study: A Major Tech Stock Reversal
A fantastic example popped up in early 2023 on the daily chart of a major tech stock. The company had just suffered a sharp post-earnings decline, and the sentiment was overwhelmingly negative. This setup is a perfect illustration of how the pattern signals a shift from extreme pessimism back to bullish conviction.
The formation started with a left shoulder forming on decreasing volume, a subtle hint that sellers were starting to get winded. Then came the head—a deeper plunge that marked the point of capitulation, happening on even lighter trading activity. The right shoulder then formed higher than the head, nearly symmetrical with the left, carving out a clean neckline. Traders using customizable scanners would have gotten alerts as the price crept toward this resistance, giving them time to prepare.
The breakout was picture-perfect. It blew past the neckline with a volume surge of over 30%, confirming that big buyers were stepping in with force. From there, the stock rallied 25% in just a few weeks, easily clearing its measured target. This trade is a great reminder of the pattern's reliability, which studies show has a success rate between 75% and 83%. For a deeper dive into how these patterns perform across different markets, you can explore the analysis on the ChartsWatcher blog.
Analyzing Variations and Failures
Of course, not every pattern works out, and studying the duds is just as important as celebrating the winners. A common failure point is when volume doesn't show up to the party. If the price just limps above the neckline on weak, below-average volume, it's a massive red flag. That move likely lacks institutional backing and is prone to collapse.
Another thing to watch for is the slope of the neckline. While a flat, horizontal neckline is the easiest to spot, they can also be angled.
- Upward-Sloping Neckline: This is a more bullish sign. It shows that buyers are getting aggressive before the formal breakout, pushing rally peaks to higher highs.
- Downward-Sloping Neckline: This is a weaker signal. It suggests that even though the lows are getting higher (from the head to the right shoulder), sellers are still capping the rallies at lower levels.
The most reliable inverse head and shoulders patterns exhibit clear symmetry between the shoulders and are confirmed by a decisive, high-volume break of the neckline. Deviations from this ideal structure often signal a lower probability of success.
By comparing these successful and failed examples side-by-side, your ability to tell a high-probability setup from a costly trap will improve dramatically. This is the skill that gives you the confidence to act when the perfect setup finally materializes.
Automating Your Search for This Pattern
Let's be honest, manually hunting for a perfect reverse head and shoulders pattern across hundreds, if not thousands, of stocks is a terrible use of your time. It’s like trying to spot a friend in a massive stadium crowd with no help. Thankfully, we don't have to do that anymore. Modern scanning tools let us automate the entire hunt, turning a mind-numbing chore into a powerful part of our trading system.
By setting up a custom scanner, you’re essentially hiring a personal market detective to do the legwork for you. It will tirelessly search for emerging patterns that match your exact rules, freeing you up to focus on analyzing only the best-looking setups instead of getting lost flipping through endless charts. You can build a system that pings you the moment a promising pattern starts to take shape.
Designing Your Custom Scanner
The real magic of a scanner isn't just finding the basic shape; it's in the filters. You can add specific rules that dramatically improve the quality of your signals and, just as importantly, weed out all the weak or messy formations. A well-built scanner for the reverse head and shoulders pattern should have a few non-negotiable filters.
Here are the essentials I'd start with:
- Minimum Downtrend Length: Don't get fooled by sideways chop. Tell your scanner the pattern must come after a clear downtrend of a certain percentage or duration. This ensures you're actually looking at a potential reversal.
- Volume Surge Criteria: This is a big one. Filter for a significant volume spike on the breakout candle. For instance, you could require the volume to be 50% greater than its 20-day average. That’s your confirmation that big money is interested.
- Pattern Symmetry Rules: Enforce the classic structure. Set a rule that the right shoulder's low must be higher than the head's low. This simple geometric filter helps ensure you're looking at a textbook, high-probability formation.
A scanner isn’t just about finding patterns; it’s about finding your patterns. By layering precise filters, you create a system that only alerts you to the high-probability setups that fit your specific trading plan.
From Detection to Validation with Backtesting
Once your scanner flags a potential setup, the real work begins: validation. This is where a good backtesting engine is worth its weight in gold. It lets you take your exact filtered criteria and see how it would have performed historically on any market you trade.
You can finally get answers to critical questions like, "How did this exact pattern, with these volume and symmetry rules, actually perform on tech stocks over the last five years?" The data you get back is statistical proof, helping you trade with confidence backed by numbers, not just gut feelings. Modern approaches to this kind of number-crunching increasingly borrow principles from data science in trading to process huge market datasets and sharpen a strategy's edge.
This automated workflow—from scanning and filtering to backtesting and watchlist management—is what connects every concept in this guide into a powerful, repeatable system. If you're looking to build a more systematic approach to your trading, getting comfortable with these tools is a game-changer. To dig deeper, check out our detailed guide on setting up real-time stock scanning, which breaks down the entire process.
Answering Your Lingering Questions
Even after you've got the basics down, a few questions always pop up when traders start looking for the reverse head and shoulders in the wild. Let's clear up some of the most common ones to build your confidence before you hit the charts.
First off, how reliable is this thing, really? While no pattern is a crystal ball, the reverse head and shoulders is considered one of the more dependable reversal signals out there. Performance studies often peg its success rate somewhere between 70% and 85%, especially when you spot it on higher timeframes like the daily or weekly charts.
What Makes a Good Pattern Go Bad?
It's just as important to know why a pattern might fail. The number one culprit is a lack of volume. If you see price break above the neckline but the volume is weak and anemic, that's a massive red flag. It tells you there's no real conviction from the buyers, and the odds of a false breakout just shot way up.
A reverse head and shoulders breakout without a surge in volume is like a car trying to accelerate with an empty gas tank. It might lurch forward a bit, but it's not going anywhere meaningful.
Other failures happen when the structure itself is just messy. A sloppy, asymmetrical pattern—like a right shoulder that dips below the head—completely invalidates the bullish idea. If the shape isn't clean, the signal isn't either.
Is This a Good Pattern for Beginners?
Yes, absolutely. In fact, it's one of the best patterns to start with. Its visual structure is easy to spot, and the rules for entry, stop-loss, and profit targets are crystal clear. The story behind it is simple and intuitive: sellers are finally running out of steam, and the buyers are stepping in to take control.
Just keep these final thoughts in mind as you start hunting for setups:
- Timeframe is Everything: A pattern on a 5-minute chart is noise. A pattern on a daily chart is a story. The higher the timeframe, the more significant the signal.
- Context is King: Always zoom out. A perfect reverse head and shoulders appearing after a long, brutal downtrend carries far more weight than one that shows up in the middle of choppy, sideways action.
Ready to stop searching and start finding high-probability setups automatically? ChartsWatcher provides the powerful, real-time scanning and backtesting tools you need to find, validate, and trade the reverse head and shoulders pattern with precision. Build your custom scanner and get alerted to your next trade.
