Trading With Volume A Modern Guide to Market Analysis
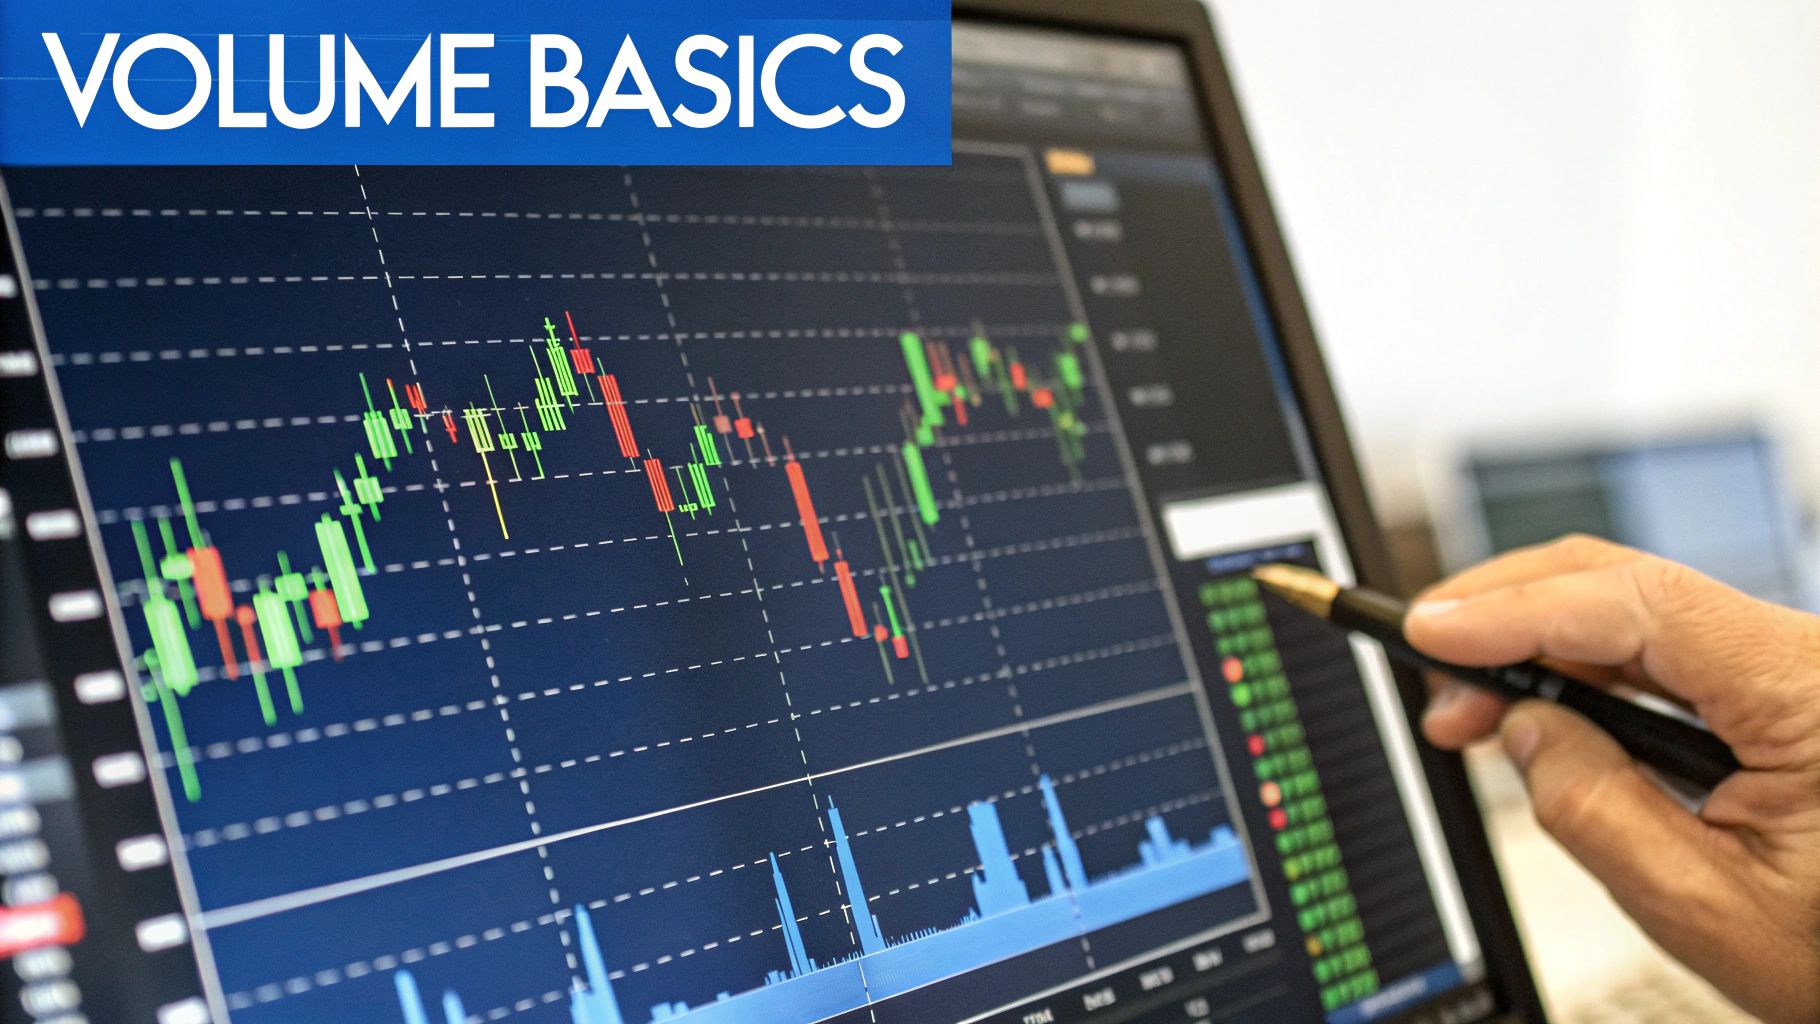
Trading with volume means you're analyzing how many shares or contracts are changing hands over a set period. It’s all about gauging the market's conviction.
Think of it this way: a price move on high volume is like a confident shout, while the same move on low volume is just a whisper. This simple idea is fundamental for any trader who wants to validate their strategy instead of just guessing.
What Trading Volume Actually Tells You
Imagine a stock suddenly jumps 5%. That number alone doesn't tell you much. But once you add volume into the picture, you get the real story.
If that 5% jump happened with millions of shares trading hands—way more than the daily average—it signals strong, widespread agreement that the price should be higher. You're likely seeing big institutional buying or a major news catalyst in action.
On the flip side, if the same 5% jump occurs on a tiny fraction of the usual volume, that’s a huge red flag. A move like that has zero conviction behind it and could easily reverse. It might just be a trap or a temporary fluke caused by a single small order. That’s why using volume isn’t really a separate strategy; it’s about adding a powerful layer of validation to any strategy you already use.
The Pulse of the Market
Volume is a direct measure of market participation and emotional intensity. High volume means high interest and a real sense of urgency. Low volume suggests traders are indifferent or just plain uncertain. Getting a feel for this dynamic is the key to reading market sentiment correctly.
- Confirmation: When price and volume move together (price goes up, volume goes up), it confirms the trend has legs.
- Divergence: When they move in opposite directions (price goes up, but volume is falling), it’s a warning sign that the trend is running out of steam.
Volume precedes price. A big shift in trading activity often foreshadows a future price move, giving observant traders an early heads-up. Learning to spot these clues is crucial, and a great place to start is by decoding unusual stock volume for smarter trades.
This isn't just theory; historical data from major exchanges proves it. Since 2009, U.S. equities markets have seen daily trading volumes fluctuate from billions to tens of billions of shares. The biggest spikes almost always line up with major economic events or periods of intense volatility. This massive flow of activity provides a rich dataset for any serious trader. You can see a detailed history of U.S. market volume for yourself over on the Cboe Global Markets website.
Using Volume to Confirm Price Action
Here's one of the first lessons every trader learns: price tells you what is happening, but volume tells you the conviction behind the move. Think of volume as the market's lie detector. When price and volume are in sync, you’ve got confirmation. When they disagree, you’ve got a divergence—and that's a huge warning sign you can't ignore.
Genuine, sustainable trends are almost always powered by strong volume. If a stock’s price is climbing and you see the volume bars below getting taller, it’s a sign of healthy, widespread participation. The market is giving you a green light, showing that the buying pressure is real and robust.
On the flip side, a price hitting new highs while volume is drying up is a classic red flag. This divergence suggests the trend is running on fumes. The "smart money" might be quietly heading for the exits, and the move is likely on its last legs. This is exactly the kind of setup that traps unsuspecting traders in a sharp reversal.
The Dynamics of Confirmation and Divergence
Getting a feel for this relationship between price and volume is what separates amateurs from pros. It's how you learn to spot a genuine opportunity versus a potential trap. This is the absolute core of trading with volume.
Here are the key scenarios you need to have burned into your brain:
- Price Up, Volume Up (Confirmation): This is the textbook definition of a strong, healthy uptrend. It shows growing interest and powerful buying pressure, suggesting the move has plenty of momentum.
- Price Down, Volume Up (Confirmation): This confirms a strong downtrend. Heavy volume on a move lower signals serious selling pressure and deep conviction from the bears.
- Price Up, Volume Down (Divergence): This is a bearish divergence. The price is drifting higher, but fewer and fewer participants are pushing it. This often happens right before a trend reversal or a nasty pullback.
- Price Down, Volume Down (Divergence): This is a bullish divergence. The price is falling, but the selling pressure is evaporating. It can signal that the downtrend is losing steam and might be ready to reverse.
A price trend without volume is just an opinion. A price trend with volume is a statement of intent from the market.
This isn't just a quirk of the stock market; it's a fundamental principle. Take global economics as a large-scale example. The growth in international trade volume has always been a key indicator of economic health. Since 1913, the inflation-adjusted volume of world trade has exploded more than fiftyfold, growing much faster than the global economy itself. This just goes to show that volume is a foundational measure of participation and health in any market. You can dig into these fascinating trends over at Our World in Data.
To really put these concepts to work, you need to compare the current volume to its recent average. For a deeper look at how to do this effectively, check out our guide to help you master the relative volume indicator. It’s a simple tool that gives you a massive edge in spotting unusual activity and confirming price action with real data.
Proven Strategies for Trading With Volume
Understanding the dance between price and volume is one thing. Turning that insight into a real, money-making strategy is something else entirely. By applying specific, time-tested techniques, you can stop being a spectator and start participating in the market with a whole lot more confidence.
Let's break down three powerful ways to trade with volume. These aren't just abstract theories; they're methods that turn raw data into clear, actionable signals that help you spot high-probability setups and sidestep those nasty market traps.
The Volume Breakout Strategy
We’ve all seen it. A stock breaks through a key price level, and everyone piles in, only for it to slam back down. These "fakeouts" are the bane of a breakout trader's existence. So, what’s the secret to telling a real breakout from a fake one? Volume.
Think of volume as the fuel for the price move. A genuine breakout isn't just a price clearing a level; it's a price exploding through that level on a massive surge of trading activity. That spike tells you the big institutions are involved and the market is serious. Without it, the move is running on fumes and is likely to fail.
- Entry Signal: Look for a price to close decisively above a major resistance level. The key is that this move must happen on volume that's at least 1.5 to 2 times higher than its recent average.
- Exit Signal: Be wary if the price keeps inching up, but the volume bars start getting smaller. This divergence—price going up while volume goes down—is a classic sign of exhaustion and often happens right before a reversal.
On-Balance Volume for Trend Following
The On-Balance Volume (OBV) indicator is a fantastic tool built on a simple, powerful idea: volume comes before price. It’s basically a running tally that adds volume on days the price closes up and subtracts it on days the price closes down.
The actual number of the OBV doesn't matter. What you're watching is its direction.
When both the price and the OBV are carving out higher highs and higher lows, your uptrend has the market's full support. But if you see the price making new highs while the OBV is flat or, even worse, falling, that’s a major red flag. It’s a warning that the trend is weak and might be on its last legs.
This method is brilliant for keeping you in a strong trend and giving you a heads-up when the momentum starts to fade, letting you lock in profits before the crowd rushes for the exit.
This infographic gives you a quick visual on how key tools, like OBV and VWAP, help traders read the market's conviction.
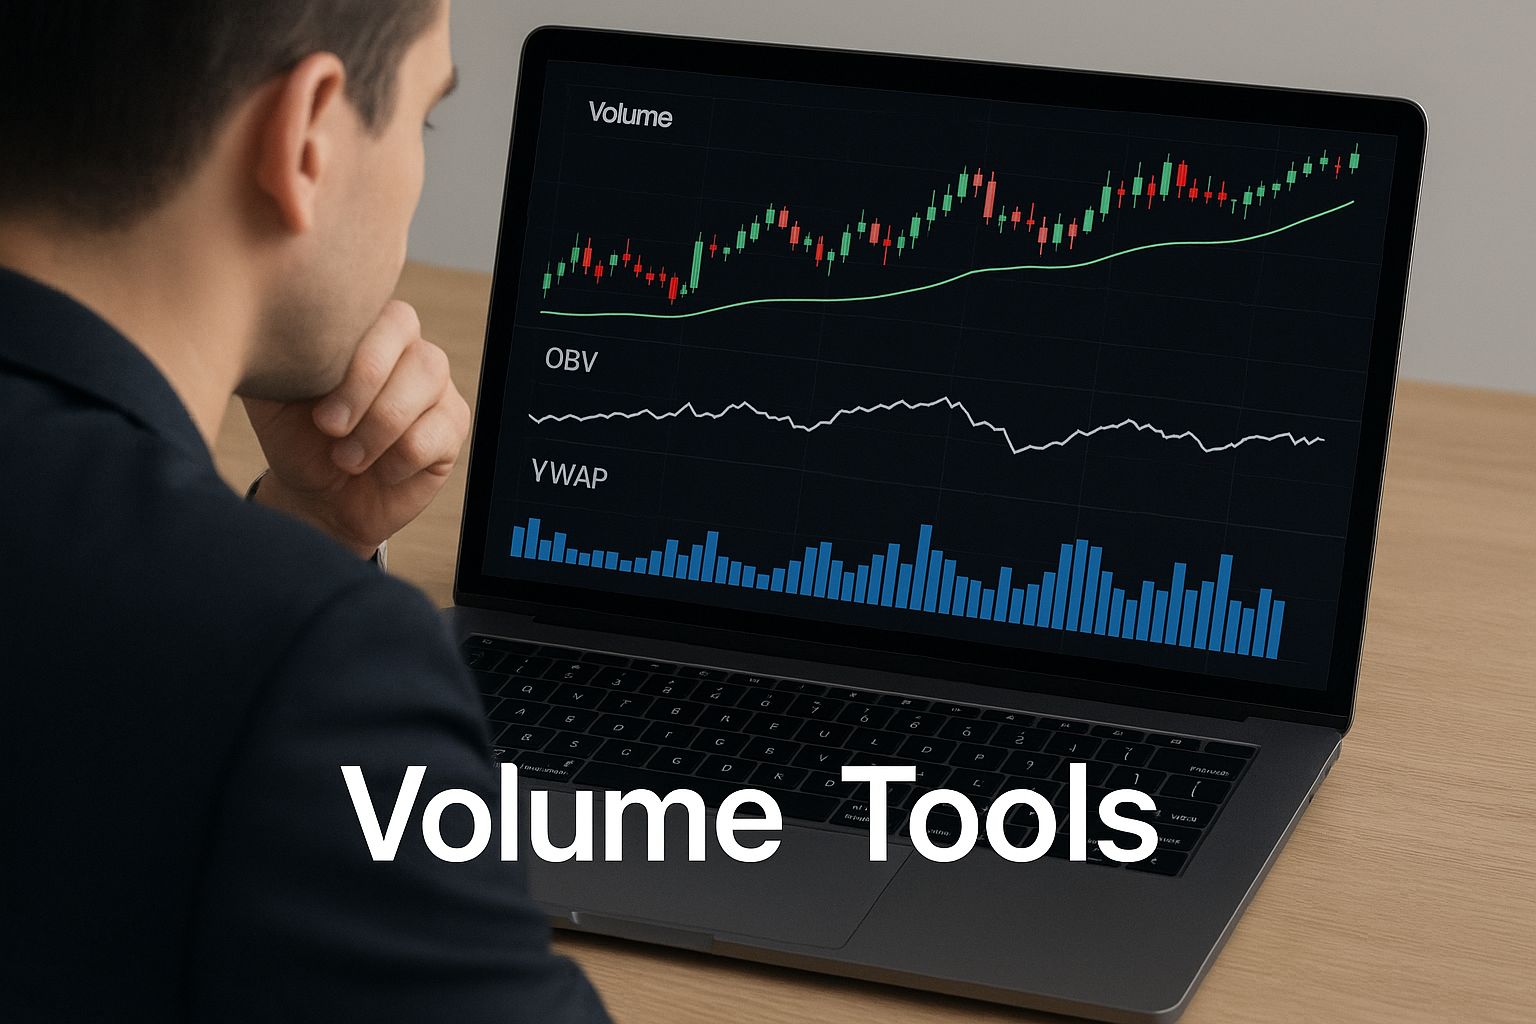
Having these indicators on your chart is like having a constant, at-a-glance confirmation of what the "smart money" is doing.
Using VWAP as an Intraday Benchmark
The Volume-Weighted Average Price (VWAP) is the go-to benchmark for day traders and big institutional players. It’s not just a simple average; it calculates the average price of a stock based on both price and volume throughout the day. In short, it shows you the "true" average price where the heaviest trading has actually occurred.
Institutions use VWAP all the time to see if they got a good deal on their massive orders. You can use this to your advantage.
- Prices trading above the VWAP line are generally seen as bullish for the day.
- Prices trading below the VWAP line are considered bearish.
Think of VWAP as a magnetic line in the sand. It often acts as a dynamic support or resistance level. Watching how price behaves when it approaches the VWAP can give you some incredibly potent entry and exit signals for your intraday trades.
Before you go all-in on any new approach, it's absolutely vital to make sure it actually works. You can learn how to rigorously backtest your trading strategies to build the confidence that your methods are sound.
Advanced Volume Analysis Techniques
Once you've got a handle on the basics, it's time to dig into the more nuanced methods the pros use to get an edge. These techniques go way beyond simple volume bars, letting you see the market's inner workings in a completely new light.
Think of it as learning to read the market's auction process. This is where you start uncovering the footprints of institutional players and spotting critical turning points with much greater confidence. It's a game-changer for anyone serious about trading with volume.
Uncovering Market Structure With Volume Profile
Imagine if you could see exactly where the real action happened—not just over time, but at specific price levels. That’s the magic of Volume Profile. Instead of the usual vertical bars at the bottom of your chart, it displays horizontal bars along the side, showing you where the market has built up value.
These zones are powerful because they essentially map out the market’s memory.
- High-Volume Nodes (HVNs): These are price levels where a ton of trading took place. They represent areas of agreement, or "fair value," and act like magnets for price. You'll often find they become major support or resistance zones.
- Low-Volume Nodes (LVNs): These are price levels with very little trading history. They're areas of "unfair value," and price tends to slice through them quickly because there's nothing there to slow it down.
Think of HVNs as busy city intersections where traffic slows down and congregates. LVNs are the open highways in between, where cars can speed right through. Having this structural map of the market is a huge advantage.
Tracking Institutional Footprints
Big institutions—the "smart money"—can't just dump millions of shares on the market at once without tanking the price. They have to be stealthy, building or unwinding their positions over time. This quiet buying is known as accumulation, and the quiet selling is called distribution.
Even though they try to be subtle, these actions leave clues in the volume data.
Accumulation often looks like a sideways price range where you see unusually high volume on up-days. Distribution looks similar, but the heavy volume shows up on down-days. Spotting these patterns is like finding elephant tracks in the jungle—you know something big is coming.
Learning to spot these subtle signs lets you align your trades with the big players before the major move happens. It’s a proactive strategy that can dramatically improve your timing and give you the conviction to hold on for the real move.
Identifying Trend Exhaustion With Volume Climax
Every great trend has to end somewhere. Often, the final act is a dramatic burst of volume called a Volume Climax. This is when you see a sharp price move on a massive, almost parabolic volume spike that dwarfs everything else on the chart.
This spike signals a frantic, emotionally charged battle where huge numbers of shares are changing hands.
A buying climax usually marks the top of an uptrend, as latecomers pile in with FOMO just as the early birds are cashing out. On the flip side, a selling climax can mark the bottom of a downtrend, as panicked sellers finally throw in the towel. Recognizing these signals can be the difference between buying the top or catching the next big wave.
Common Mistakes to Avoid With Volume Analysis
Knowing which volume strategies to use is only half the battle. Just as important is knowing what not to do—the common pitfalls that can trip up even experienced traders and lead to costly mistakes. If you can spot these traps ahead of time, you'll be well on your way to building smarter, more resilient trading habits.
The single biggest mistake? Looking at volume in a vacuum. Without price action to give it context, volume is just meaningless noise. A huge spike doesn't automatically scream "buy" or "sell." You have to read it alongside the price movement to understand the story the market is actually telling.
Ignoring Relative Volume
Another classic blunder is forgetting to check relative volume. This simply means comparing the current volume to what’s been happening recently. A day where one million shares trade hands might be massive for a small-cap stock, but it would be a total snoozer for a mega-cap giant like Apple.
You need a baseline. Always compare today’s activity to something like a 20-day or 50-day moving average of volume. That context is what turns raw numbers into actionable intelligence and helps you spot activity that is genuinely unusual.
A single volume spike is not a strategy. It's a single data point that requires further investigation. Overreacting to one dramatic bar without looking for confirmation is a recipe for getting caught in emotional, news-driven head-fakes.
So, instead of jumping on every big green or red bar, wait. See how the price reacts on the next few candles. Does the move stick, or does it fizzle out and reverse? A little patience goes a long way.
Misapplying Volume Analysis Across Different Markets
It's also critical to remember that not all volume is created equal. The data you get for stocks on centralized exchanges like the NYSE is clean and reliable. But other markets are a different beast entirely.
Take the Forex market, for instance. It's decentralized, so there's no single source for total volume. Traders there often use "tick volume"—the number of price changes—as a proxy, but it's not the same thing.
Then you have the massive derivatives markets. The volume there can be staggering. On a volatile day, futures volumes on an exchange like the CME can surge into the millions of contracts, showing just how much interest and capital is flying around. If you want to see what that looks like, you can explore exchange volume statistics on CME Group.
The bottom line is simple: always know where your volume data is coming from and understand its limitations for the specific market you’re trading.
Integrating Volume Into Your Trading Plan
Let's get practical. Weaving volume analysis into your daily trading isn't about slapping another indicator on your chart and hoping for the best. It's about building a systematic process—a mental framework that forces you to ask, "Does the market agree with this move?" before you risk a single dollar.
This shift in thinking turns volume from a neat little add-on into a core pillar of your entire strategy.
First things first: make it impossible to ignore. Your primary chart layout should always have a volume indicator visible. That's non-negotiable. This simple habit keeps market participation front and center, constantly reminding you to check the market's pulse right alongside its price action. Once that's in place, you can build a simple checklist to keep you honest.
Your Volume Analysis Checklist
Think of this as your pre-flight check before entering any trade. It's a straightforward, actionable framework you can run through in seconds:
-
Always Seek Confirmation: Before you jump on a breakout, follow a trend, or try to catch a reversal, stop and look at the volume. Does it support your theory? A price move on fumes is a red flag, not an invitation.
-
Use Divergence for Risk Management: Spotting bearish or bullish divergence is your early warning system. It's the market whispering that something is off. Use it to tighten your stop-loss, shave off some profits, or just stay out of a new trade altogether.
-
Analyze High-Volume Events: When you see a monster volume spike, don't just react to it. Dig in. Go back and study it later. What was the news? What was the catalyst? How did the price behave in the hours and days that followed? These moments are the market's best teachers, offering a masterclass in supply and demand.
At the end of the day, volume isn't a standalone "magic bullet" strategy. It's a powerful lens. By learning to read the story it tells, you give yourself the tools to make smarter, more confident decisions that are in sync with what the market is really doing.
Got Questions About Volume Trading?
Every trader exploring volume analysis runs into a few common questions. Whether you're just starting to wrap your head around it or you're a seasoned pro looking to sharpen your edge, getting solid answers is everything. Let's tackle some of the big ones.
What Is the Best Indicator for Volume Trading?
This is a classic question, but there's no magic bullet. The "best" indicator is really about what you're trying to accomplish. Think of it like a mechanic's toolbox—you wouldn't use a wrench to hammer a nail. Each tool has a specific job.
- On-Balance Volume (OBV): This is your go-to for confirming trends. It's fantastic at spotting those sneaky divergences where price is still climbing, but the buying pressure is quietly drying up.
- Volume-Weighted Average Price (VWAP): If you're an intraday trader, VWAP is your best friend. It gives you a benchmark for where the big institutional money is trading and often acts as a powerful, dynamic level of support or resistance throughout the day.
- Volume Profile: This is the ultimate tool for mapping out the battlefield. It shows you exactly where the most trading has occurred in the past, revealing critical price zones that will likely act as major support and resistance in the future.
My advice? Start simple. Get really comfortable reading the standard volume bars on your chart first. Once you have a feel for that, layer in these more specialized tools to get a much deeper read on the market.
Can You Use Volume in Forex or Crypto Markets?
Yes, absolutely—but you have to know what you're looking at. Unlike the stock market where everything is centrally reported, the Forex market is decentralized. That means there's no single, official source for volume. What we use instead is tick volume, which tracks the number of price changes. It's a solid proxy for activity, but it's not the real thing.
Crypto is a bit of a hybrid. Centralized exchanges like Binance or Coinbase provide real volume data, but it only reflects the trading on that specific platform. It doesn't capture the entire market. In both cases, volume analysis can still give you a huge edge, you just have to be mindful of the data's limitations.
How Do You Identify a True Volume Breakout?
A real, high-conviction breakout has a very specific signature. First, you need a decisive close. The price has to blast through a key resistance level (or crumble below support) and hold. A quick poke above the line doesn't count.
But the second part is what separates the real moves from the fakeouts: a massive surge in volume. A genuine breakout should happen on volume that is at least 1.5 to 2 times higher than its recent average. If you see a breakout on weak or average volume, that's a giant red flag. More often than not, it's a trap designed to lure in unsuspecting traders.
Ready to stop guessing and start seeing the market's real conviction? ChartsWatcher provides the advanced scanning and charting tools you need to integrate volume analysis into every trade. Build custom dashboards, set precise alerts for volume spikes, and gain the edge you need to trade with confidence. Discover how professionals track market movements at https://chartswatcher.com.
