Master the Relative Volume Indicator
The relative volume indicator is a powerful tool that measures current trading volume against its historical average, answering a simple but crucial question for traders: Is this price move backed by real conviction, or is it just market noise?
Think of it this way: a stock price moving on low volume is like a rumor whispered in an empty room. But when that same price move happens with a massive surge in volume, it's like a stadium-wide roar—something significant is happening, and you need to pay attention. An RVOL reading above 1.0 tells you volume is higher than usual, signaling that big players might be making their move.
Why Relative Volume Is a Trader's Secret Weapon

Let's stick with the crowd noise analogy. A low, constant murmur from the crowd at a sporting event is just background noise. It doesn't tell you much. But a sudden, deafening roar? That tells you a goal was just scored or a spectacular play happened. RVOL acts as that "crowd noise" monitor for the stock market.
By comparing current trading activity to a baseline average, it helps you tell the difference between a boring, low-conviction price drift and a powerful, high-conviction breakout. This context is everything. After all, nearly every major price event—whether it's a huge breakout or a sharp reversal—is fueled by a spike in volume. RVOL is what quantifies that spike for you.
Key Takeaway: The relative volume indicator doesn't just show you if a stock is being traded; it tells you how intensely it's being traded compared to its own normal behavior. It’s the context that turns raw volume data into something you can actually use.
Turning Volume Data Into Actionable Insight
At its heart, the relative volume indicator is just a simple ratio. It takes the current volume for a specific period (like the last five-minute candle) and divides it by the average volume over a longer look-back period (often a 50-period moving average). The result is a single number that speaks volumes.
For instance, an RVOL of 2.5 means the asset is currently trading with 2.5 times its normal volume. Simple, right? But incredibly powerful. You can find a more technical deep-dive into the RVOL calculation at StockCharts if you want to get into the weeds.
This straightforward ratio helps traders:
- Confirm Breakouts: A high RVOL reading when a stock breaks above resistance adds a ton of credibility to the move. It suggests strong buying pressure is behind it, boosting the odds that it’s the real deal.
- Spot Potential Reversals: A massive volume spike after a long, grinding trend can often signal exhaustion. It's the point where the last of the buyers (or sellers) have finally jumped in, which frequently happens right before the trend reverses.
- Identify Institutional Activity: Big players like hedge funds and mutual funds can't hide their footprints. When they buy or sell, they move massive blocks of shares, creating noticeable volume surges that RVOL makes incredibly easy to spot.
To make things even simpler, here is a quick reference table to help you interpret RVOL values at a glance.
Interpreting RVOL Values At a Glance
This table gives you a quick rundown of what different Relative Volume (RVOL) values typically mean for traders watching the market.
| RVOL Value | Market Activity Level | What It Means for Traders |
|---|---|---|
| Below 1.0 | Lower than Average | Quiet, low-conviction trading. The stock is "asleep." Often seen during consolidations. |
| 1.0 - 2.0 | Average to Elevated | Healthy interest is present, but it might not be enough fuel for a major, sustained move. |
| Above 2.0 | Significantly High | Something unusual is happening. This signals strong conviction and a high potential for a big move. |
| Above 5.0 | Extremely High | A major catalyst is in play—think earnings, news, or a buyout. Expect massive volatility. |
Think of these values as a quick sentiment check. An RVOL below 1.0 is business as usual, but once it starts climbing past 2.0, it's a clear signal that it's time to zoom in and see what's driving the action.
How to Read and Configure the RVOL Indicator
Getting the relative volume indicator set up on your charts is less about technical wizardry and more about tailoring it to your personal trading style. On most modern platforms like ChartsWatcher, adding RVOL is a breeze—just head to your indicator list, search for "Relative Volume," and pop it onto your chart with a click.
Once it's active, you'll see it appear below your price chart, usually as a histogram or a set of color-coded bars. Each bar instantly shows you the RVOL for that specific candle, giving you a quick visual heads-up on any unusual trading activity. But the real power comes from tweaking its settings to match how you trade.
The infographic below breaks down how the RVOL indicator crunches the numbers to get its final ratio.
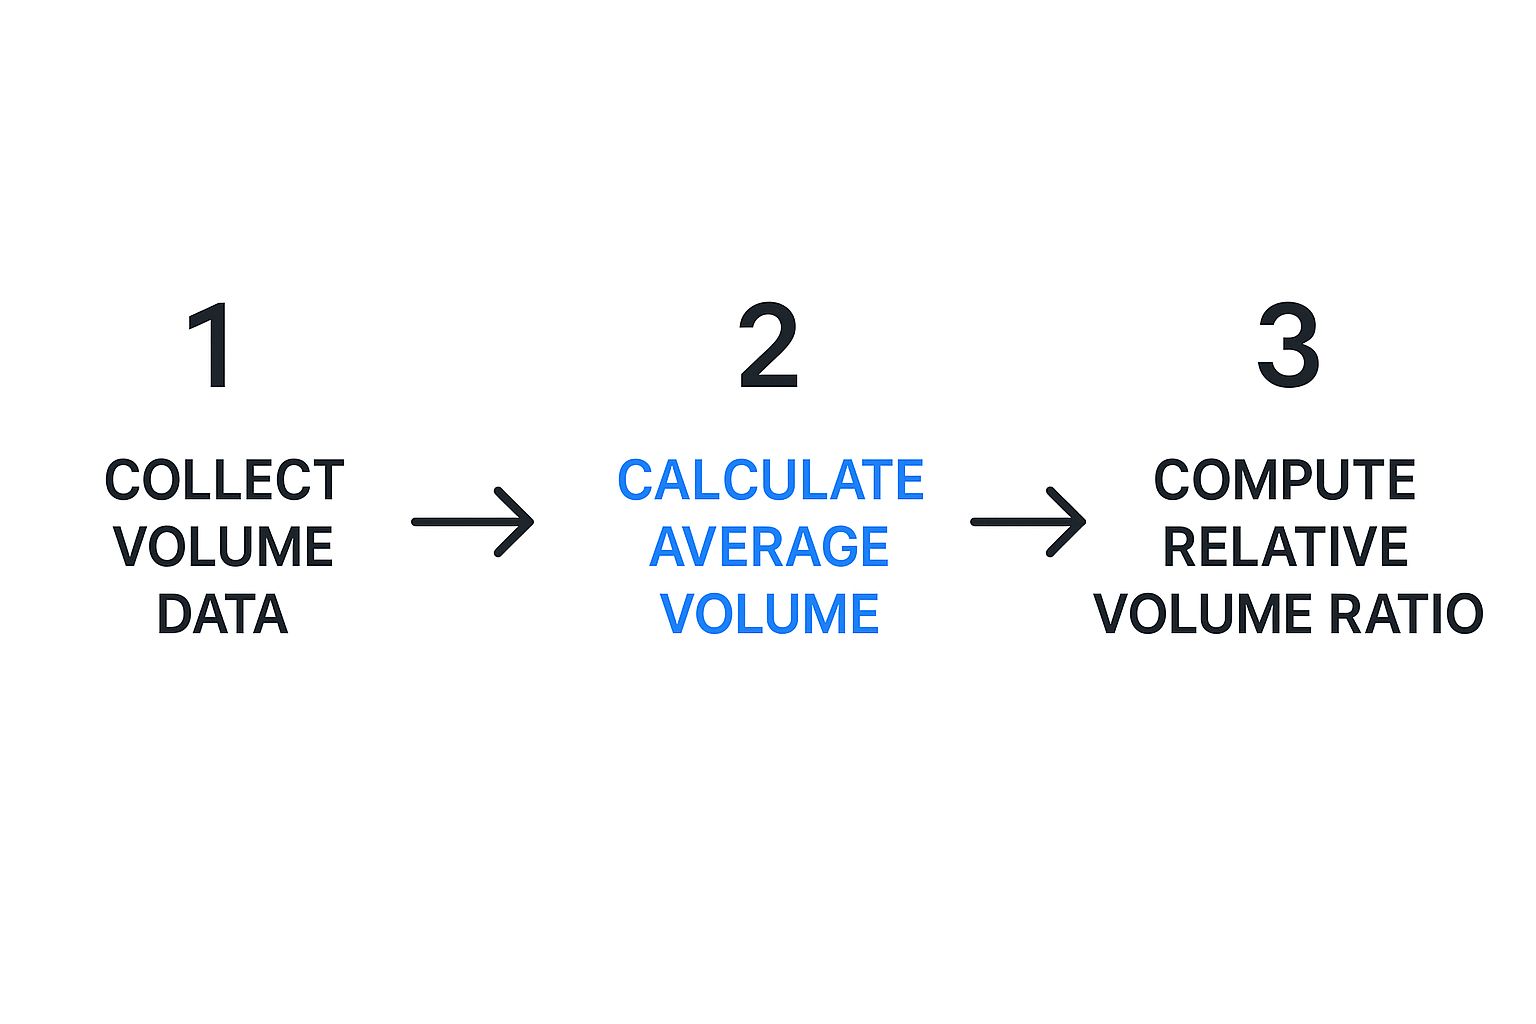
It’s a simple three-step flow: the indicator gathers the raw volume data, calculates an average over a specific period, and then presents it as the simple ratio you see on your screen.
Customizing Your RVOL Settings
The two most critical settings you'll want to adjust are the Look-Back Period and the Moving Average Type. These two inputs are the engine of the indicator, directly controlling how it calculates the baseline average volume and, therefore, how sensitive it is to market action.
-
Look-Back Period: This tells the indicator how many past candles to include in its average volume calculation. A shorter period, like 10 or 20, makes RVOL more responsive to recent spikes, which is often what day traders need. A longer period, like 50 or 100, smooths things out for a more stable baseline, which usually suits swing traders better.
-
Moving Average Type: You’ll typically get a choice between a Simple Moving Average (SMA) and an Exponential Moving Average (EMA). An SMA treats every period in the look-back equally, while an EMA gives more weight to the most recent candles, making it react faster. For RVOL, the SMA is the old standby because it provides a more stable, reliable picture of historical average volume.
Trader's Tip: When you're just starting out, a 50-period SMA is a fantastic default setting. It’s a common standard that offers a balanced and dependable baseline for most strategies and timeframes. Only change it if you have a specific, strategic reason to do so.
This screenshot shows where you'll find these settings on a typical charting platform.
As you can see, you have direct control over the indicator's behavior with input fields for its length and a dropdown for the moving average type. The relative volume indicator has become a staple for traders since the 2000s, especially as platforms have made it easier to visualize volume surges. In fact, some data suggests that around 70% of high-probability setups identified by traders now incorporate an RVOL component, underscoring its importance in modern analysis. You can learn more about how traders are building RVOL into their strategies over at TrendSpider.
Putting RVOL to Work: Actionable Trading Strategies
Alright, let's move from theory to the trading floor. It's one thing to know what the relative volume indicator is, but it's another thing entirely to use it to find and manage profitable trades. Here, we'll break down three powerful, distinct strategies that put RVOL at the very center of your trading decisions.
These aren't fuzzy ideas—they're concrete playbooks with clear rules. Each one uses RVOL to answer a critical question about the price action, helping you separate the high-probability setups from all the market noise.
Strategy 1: The High RVOL Breakout Confirmation
This is probably the most classic and reliable way to use the relative volume indicator. A breakout happens when a stock's price punches through a resistance level or drops below support. The problem? Many of these breakouts fail, luring in eager traders only to reverse course and trap them in a "false breakout," or "fakeout."
RVOL is your best filter to sidestep these traps. A real, legitimate breakout needs a serious surge in volume to back it up. This tells you that big players—the institutions—are driving the move. Without that volume confirmation, the breakout has no muscle behind it and is far more likely to fizzle out.
The Playbook:
- Find a Clear Level: Look for a well-defined resistance or support level the market has respected multiple times.
- Wait for the Break: Be patient. You need to see the price close decisively above resistance for a long trade, or below support for a short.
- Check RVOL for the Tell: As the breakout happens, glance at your RVOL indicator. You're looking for a reading of at least 2.0, but higher is even better. This confirms that the market is genuinely interested.
- Entry and Risk: You can enter on the breakout candle itself or wait for a small retest of the level that was just broken. Your stop-loss goes just below the old resistance (which is now support) or just above the old support (now resistance).
Important Insight: A breakout on low RVOL (anything below 1.5) is a massive red flag. It’s a sign that there's no institutional firepower behind the move, which means there's a high chance it will fail. Ignoring this signal is one of the quickest ways to get stopped out.
Strategy 2: Climactic Exhaustion Reversals
Trends don't go on forever. One of the most telling signs that a strong trend is about to die is a climactic, blow-out volume spike. This is the moment of peak emotion, when a "get me in at any price" or "get me out right now" panic takes hold. This often marks the final, exhaustive gasp before the trend reverses.
Think about it: after a long, grinding uptrend, you suddenly see a massive green candle on an RVOL of 5.0 or more. That's a potential "blow-off top." On the flip side, after a steep downtrend, a huge red capitulation candle on extreme RVOL can signal a "selling climax"—the point where the last seller has finally thrown in the towel.
The Playbook:
- Identify a Mature Trend: Find an asset that's been moving strongly in one direction for a while.
- Spot the Climax: Watch for an unusually large price candle in the direction of the trend, paired with an extreme RVOL reading (think 5.0, 10.0, or even higher). This is your exhaustion signal.
- Wait for Confirmation: This is key—don't just jump in. Don't short the blow-off top or buy the capitulation candle right away. Wait for the next candle to show signs of a reversal, like closing in the opposite direction.
- Entry and Risk: Once you see price action confirming the reversal, you can enter against the old trend. Place your stop-loss just above the high of the blow-off top candle, or just below the low of the selling climax candle.
Strategy 3: Low-Volume Continuation Pullbacks
Not every RVOL signal has to be loud. Sometimes, the quietest moments are the most informative. In a healthy, strong uptrend, a stock will make powerful moves up on high volume, then pull back or consolidate on low, drying-up volume.
This low-volume pullback is a fantastic sign. It's the market taking a healthy "breather." It tells you that there isn't much selling pressure; the buyers who drove the last move up are mostly just holding their positions, getting ready for the next leg higher. Seeing an RVOL reading below 1.0 during a pullback in a strong uptrend is a classic signal that the trend is likely to continue.
For traders looking to use these RVOL strategies in a live setting, platforms like the yieldseeker Terminal offer the real-time scanning and charting tools you need. Marrying these proven strategies with a capable platform can give your trading a serious boost in efficiency.
Combining RVOL with Other Technical Tools
While the relative volume indicator offers some incredible insights on its own, its real power is unlocked when you treat it as a confirmation tool within a broader trading strategy. Think of it as the final piece of evidence in an investigation. Price action might tell you what is happening, but RVOL tells you how much conviction is behind that move.
Relying on RVOL in a vacuum can easily lead to wrong conclusions. A random volume spike without a clear price catalyst is usually just market noise. But when a high RVOL reading lines up perfectly with another technical signal, you get a powerful confluence of evidence that dramatically tilts the odds in your favor.
RVOL and Price Action Confirmation
The most direct and effective way to use RVOL is by pairing it with core price action concepts like support and resistance. These are the battlegrounds on a chart where buyers and sellers have historically dug in their heels. A breakout or breakdown at one of these key levels is always significant, but you absolutely need volume to confirm it’s the real deal.
Imagine a stock has been bumping its head against a major resistance level for days. When it finally pushes through, you need to know: is this a genuine breakout or just a trap?
- High RVOL Breakout: If the price smashes through resistance on an RVOL of 2.5 or higher, it’s a clear signal that a flood of new buying pressure has entered the ring. This is the confirmation you’re looking for.
- Low RVOL Breakout: If that same breakout happens on an RVOL below 1.5, it suggests a serious lack of interest. That's a massive red flag. The move is much more likely to fizzle out and reverse.
The same logic applies to candlestick patterns. A big, bullish engulfing bar is a nice signal. But a bullish engulfing bar that forms on triple the average volume? That's an exceptional signal. RVOL validates what the price candles are telling you.
Adding Volume to Trend and Momentum Analysis
RVOL also slots in perfectly alongside trend-following indicators like moving averages. Moving averages help you spot the overall direction of the trend, while RVOL confirms the strength of the moves within that trend. For example, in a healthy uptrend, you want to see the price advance on high relative volume and pull back on low relative volume.
A price move without volume is a signal without confirmation. By pairing RVOL with other tools, you ensure that market conviction aligns with your technical setup, turning good trades into great ones.
This isn’t just anecdotal wisdom. Backtesting has shown that integrating the relative volume indicator with tools like price action and moving averages can boost trade decision accuracy by up to 15%. This is exactly why RVOL is a cornerstone tool, not just for discretionary traders but also for complex quantitative models. You can dig into some of these findings on TrendSpider.
By combining these tools, you build a much more complete picture of the market's inner workings. For traders looking to add another layer of analysis, many also learn to master the volume profile indicator for better trading, as it perfectly complements RVOL by showing where all that volume actually traded at different price levels.
Common Mistakes Traders Make With RVOL

Knowing what to do with the relative volume indicator is only half the battle. Just as important is knowing what not to do. I’ve seen countless traders turn this incredibly useful tool into a source of bad signals by falling into a few common traps. If you want to use RVOL with any degree of precision, you need to steer clear of these pitfalls.
One of the most frequent mistakes is getting faked out by the predictable volume surge at the market open. The first 30-60 minutes of the trading day are almost always flooded with volume as all the overnight orders get filled. If you treat a high RVOL during this window as some kind of special event, you’ll end up chasing moves that are just routine market mechanics.
Ignoring The Bigger Picture
Another critical error is getting tunnel vision on a high RVOL reading while completely ignoring what the price is doing. A huge volume spike is only meaningful in context. Think about it: if a stock’s RVOL is at 4.0 but the price is just chopping sideways in a tight, messy range, that volume isn't signaling a clear breakout. It's showing you a dogfight between buyers and sellers, with no clear winner.
Rule of Thumb: Volume confirms price; it does not replace it. Always let the price action lead your analysis, and use RVOL as the final piece of evidence to support your trade thesis.
On top of that, using the wrong look-back period can completely sabotage your strategy. A day trader using a 100-period setting on a 5-minute chart is going to get a signal that’s way too slow and laggy. On the flip side, a swing trader using a 10-period setting on a daily chart will just be drowned in noise. Your settings have to make sense for your trading timeframe.
Here are a few other missteps I see all the time:
- Mistake 1: Ignoring Context: Forgetting that major news, earnings reports, or even just broad market panic can cause volume surges across the board. That kind of volume has little to do with an individual stock's technical setup.
- Mistake 2: Chasing Spikes: Blindly jumping into any stock that pops up with a high RVOL. You have to check the chart first. Is there a real pattern, like a clean breakout from consolidation, or is it just a random spike?
- Mistake 3: Inconsistent Settings: Applying the exact same RVOL settings to a crazy volatile tech stock and a slow-moving utility company. You have to adjust your tools for the instrument you're trading.
By understanding these common errors, you can start building a more disciplined and effective approach. For those who want to really sharpen their skills in this area, you can learn more about how to profit from unusual volume in stocks and apply these lessons directly to your trading.
Your Questions About Relative Volume Answered
As you start to weave relative volume into your analysis, a few questions are bound to pop up. Getting clear answers to these is key to building confidence and making sure you’re using the indicator the right way. Let's dig into some of the most common ones traders ask.
What Is a Good RVOL for Day Trading?
For day traders, an RVOL reading above 2.0 is usually where things get interesting. It's a strong signal of unusual attention. A reading of 2.0 means a stock is trading at twice its normal volume for that specific time of day, suggesting significant momentum is building. This is exactly the kind of high activity that day traders need to catch sustained intraday moves.
That said, this isn't a hard-and-fast rule. The "ideal" RVOL can shift depending on a stock's typical personality—its volatility—and what the rest of the market is doing that day.
Can RVOL Be Used for Crypto or Forex?
Yes, but it comes with a big asterisk. You have to interpret it carefully. Unlike stocks, which trade on centralized exchanges with clean, consolidated volume data, markets like crypto and Forex are decentralized. Volume data can be fragmented across dozens of different exchanges and platforms.
While you can absolutely use the relative volume indicator on platforms that aggregate this data, just remember it often represents only a slice of the total market. It's still valuable for spotting activity spikes on a specific data feed, but it might not capture the full global picture as reliably as it does for stocks.
How Is RVOL Different From the Standard Volume Indicator?
This is a fantastic question because it gets right to the heart of why RVOL is so powerful. The standard volume indicator simply shows you the raw number of shares traded—it tells you what happened. The relative volume indicator, on the other hand, provides the crucial context—it tells you so what?
It does this by comparing the current volume to the average historical volume for that same time period, instantly highlighting whether the current activity is normal or completely out of the ordinary. Seeing a raw volume of one million shares means very little on its own. But seeing an RVOL of 3.0—which tells you volume is 300% of its normal level—is a powerful, actionable insight.
Ready to stop guessing and start confirming your trades with data-driven insights? ChartsWatcher provides the advanced scanning and charting tools you need to integrate the relative volume indicator into your strategy. Find high-conviction setups faster and trade with greater confidence. Explore the platform at https://chartswatcher.com.
