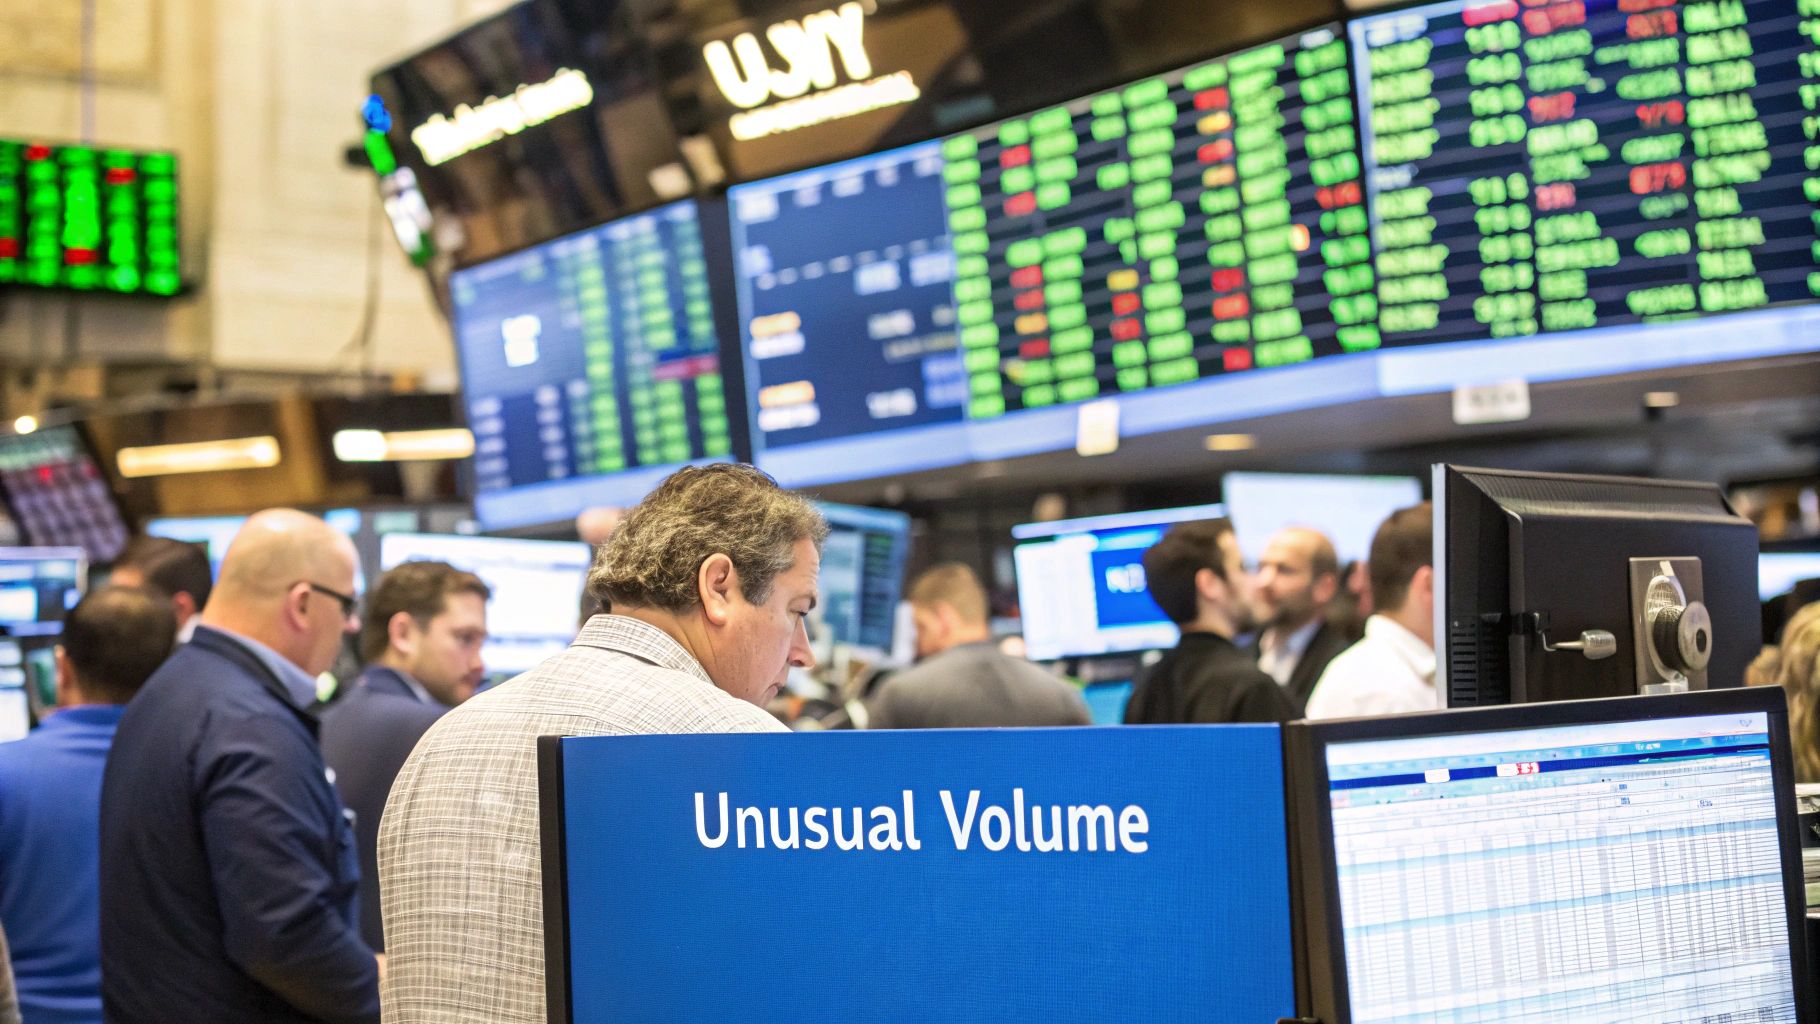
Decoding Unusual Stock Volume for Smarter Trades
When you hear the term unusual stock volume, what should come to mind is a sudden, massive surge in trading activity. It's when the number of shares changing hands for a particular stock skyrockets far beyond its normal daily average.
Think of it like a quiet neighborhood street. Most days, you see a predictable amount of traffic. Then one day, it’s completely gridlocked. That's a clear signal that something big is going on—a street festival, a major accident, something out of the ordinary. This spike in activity is a heads-up for traders, often showing up right before a major price move. It tells you the big players—institutions, hedge funds, or even a massive wave of retail traders—are making their move.
What Unusual Stock Volume Is and Why It Matters
Let's stick with an analogy. Imagine watching a river. On a typical day, the water flows at a steady, predictable pace. This is your stock’s average daily volume—the usual number of shares traded.
Now, picture a dam opening upstream, sending a powerful surge of water rushing down the riverbed. That’s unusual stock volume. It’s a dramatic, unmistakable increase in trading that signals a fundamental shift in market interest.
This isn’t just random noise; it's a critical alert. A huge volume spike often acts as a leading indicator, giving you a peek at potential price swings before they fully play out. It means a ton of capital is flowing into (or out of) a stock, and that’s the fuel needed for a significant price change.
The Story Behind the Numbers
At its core, unusual stock volume reveals a change in market psychology. It’s the market screaming that conviction is building around a stock. This intense interest is usually triggered by a few key catalysts:
- Institutional Activity: When a big fund decides to build or dump a position, their massive orders light up the volume bars. This is often the "smart money" making its move.
- Breaking News: A surprise earnings report, a merger announcement, or FDA approval can bring a flood of traders to the party.
- Widespread Retail Interest: Sometimes, a stock just captures the public's imagination, leading to a coordinated surge in trading from individual investors.
By monitoring for unusual volume, traders can tap into the actions of "smart money" and other powerful market forces. It’s like listening to the market's heartbeat—a sudden, rapid pulse suggests something big is about to happen.
Understanding this concept is the first step toward using volume as a strategic weapon. It helps you separate minor, meaningless price wiggles from major moves backed by real financial commitment.
To help you get a better handle on these signals, here’s a quick reference table.
Quick Guide to Volume Signals
This table summarizes what different volume scenarios can indicate about a stock's potential movement.
| Volume Signal | What It Suggests | Potential Trader Action |
|---|---|---|
| High Volume + Rising Price | Strong buying pressure, bullish conviction is high. The uptrend is likely to continue. | Look for entry points, as the trend is confirmed by strong participation. |
| High Volume + Falling Price | Strong selling pressure, bearish conviction is high. The downtrend is likely to continue. | Look for shorting opportunities or exit long positions. |
| Low Volume + Rising Price | Weak buying interest. The uptrend may be losing steam and could reverse. | Be cautious. The move isn't backed by strong conviction. |
| Low Volume + Falling Price | Lack of selling pressure. The downtrend may be ending soon. | Watch for signs of a potential bottom or reversal. |
| Spike After Long Trend | A "capitulation" or "exhaustion" move. Could signal a reversal is near. | Prepare for a potential trend change. |
Keep in mind, volume is just one piece of the puzzle. It's most powerful when used to confirm signals from other indicators.
If you're looking to build on these fundamentals, you might consider exploring further trading education in the vTrader Academy. Ultimately, analyzing volume helps you confirm trends, spot potential reversals, and make much more informed trading decisions.
Unpacking the Catalysts Behind Volume Spikes
A sudden spike in stock volume rarely happens in a vacuum. Think of it like smoke pouring out of a building; it’s the most obvious sign that something big—a fire—is happening inside. For us as traders, that smoke is the unusual stock volume, and the fire is some powerful, market-moving catalyst.
These events are triggers. They’re the reason thousands of investors suddenly decide to act all at once. A company could be chugging along quietly for months, but a single piece of news can throw it into the spotlight, unleashing a flood of buy or sell orders that sends its trading volume through the roof.
Figuring out what these triggers are is the key to telling a real, sustainable move from a flash in the pan.
Fundamental Business Developments
The most powerful and common catalysts are tied directly to a company's health and future. When something happens that fundamentally changes how the market values a company, traders have to scramble to re-price the stock, and that's when you see the volume explode.
Here are the heavy hitters:
- Earnings Reports: This is the big one. When a company reports its quarterly or annual numbers and they either crush or completely miss expectations, the market reacts violently. A "blockbuster" report brings in a stampede of buyers. A massive disappointment causes a rush for the exits.
- Mergers and Acquisitions (M&A): Announcing that a company is buying another, or is being bought, changes the entire game in an instant. News of a buyout—especially at a premium to the current stock price—will almost always trigger unusual stock volume in both companies.
- Regulatory Decisions: For entire sectors like biotech and pharmaceuticals, this is everything. A positive FDA approval for a new drug can send a stock into orbit on insane volume. A rejection can be absolutely devastating.
A huge volume spike is basically the market’s collective vote on a piece of news. The bigger the volume, the stronger the consensus that the information is a true game-changer for the company's future.
Market and Social Dynamics
It’s not always about what the company itself does. Sometimes, the catalyst comes from the wider market or the way we communicate about stocks today. These triggers are more about shifts in investor psychology or the mechanics of our high-speed markets.
For example, when a big, influential investment firm upgrades or downgrades a stock, it sends ripples through the market as their clients and followers pile in or out. An analyst bumping their price target from $50 to $100 on a popular tech stock is a loud, clear signal that drives serious buying pressure.
On top of that, we've got some new-school drivers to watch for:
- Social Media and Community Buying: Platforms like Reddit and X (what used to be Twitter) can get retail traders to rally around a single stock. We’ve all seen how this coordinated buying can generate mind-boggling volume spikes and create wild volatility.
- Algorithmic Trading: High-frequency trading (HFT) systems can fire off millions of orders in the blink of an eye. The second that news breaks, these algorithms react, instantly amplifying the initial volume surge and pouring gasoline on the fire.
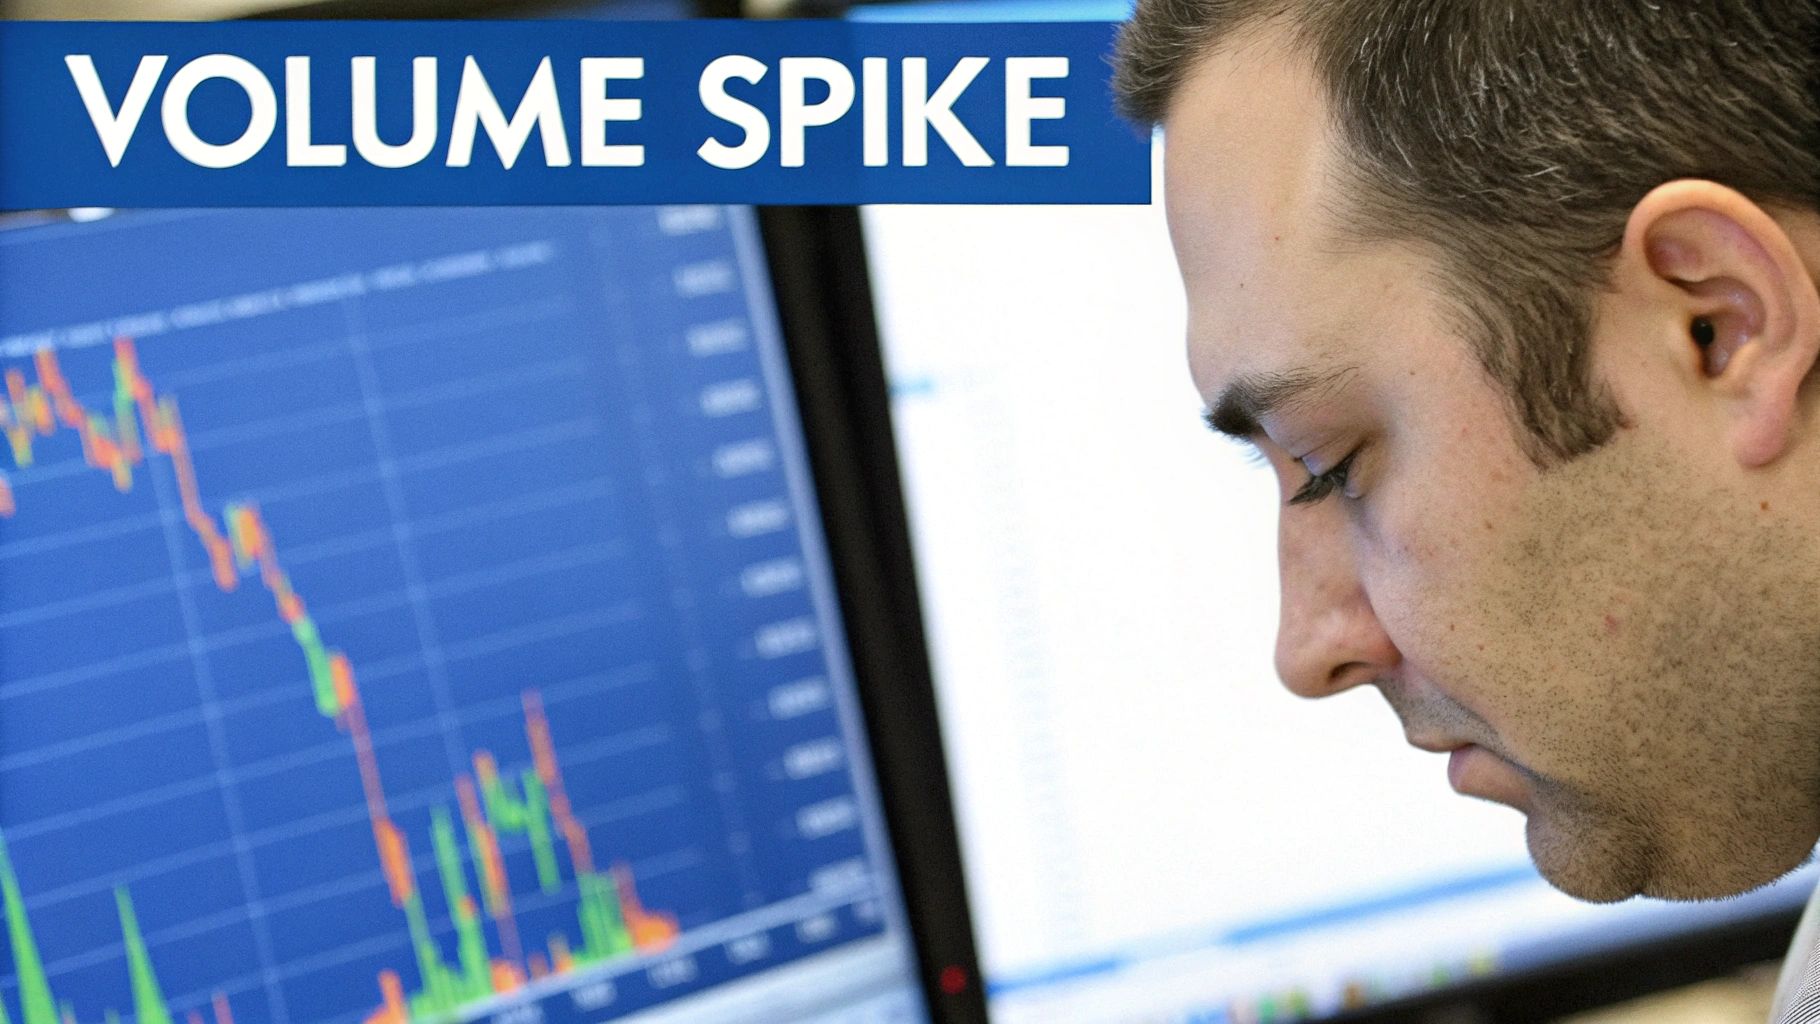
How to Spot Unusual Stock Volume in Real Time
Alright, let's move from theory to action. How do you actually spot unusual stock volume as it's happening? You don’t have to glue your eyes to every single stock chart. Modern charting software and scanners are built to do the heavy lifting, pushing the most active stocks right in front of you.
The first step is figuring out what "normal" volume even looks like for a stock. It’s like a doctor needing to know a patient’s baseline heart rate before they can spot an abnormality. For traders, that baseline is everything.
Setting Your Visual Baseline
A super simple way to see what's normal is to add a volume moving average to your charts. Just about every trading platform lets you overlay a 50-day moving average on the volume bars at the bottom of a chart.
This one line gives you instant context. Any volume bar that shoots up way past that average line is a potential signal. It's a quick, visual gut check that something interesting is going on and it’s time to pay closer attention.
Think of the volume moving average as a high-water mark on a riverbank. When the water level (volume) surges past that line, it’s a clear signal of a potential flood of trading activity that demands your immediate attention.
Introducing Relative Volume for Precision
While a moving average is a great start, it has a blind spot: it doesn't care about the time of day. Trading volume naturally explodes at the market open and has another burst into the close. This is where a much smarter metric, Relative Volume (RVol), becomes an absolute game-changer for real-time analysis.
RVol is brilliant. It compares a stock's current trading volume to its average volume for that exact same time of day. So, a stock with an RVol of 3.5x isn't just busy—it's trading at three and a half times its normal pace for 10:15 AM on a Tuesday. This is a powerful signal because it cuts through the predictable daily noise.
If you want to go deeper, our guide can help you master the Relative Volume indicator and its applications.
Using Stock Screeners to Find Opportunities
Let's be real, checking charts one by one is a massive waste of time. A stock screener is your automated scout, tirelessly scanning thousands of stocks for the exact criteria you care about.
To hunt for stocks with real institutional footprints, you can set up a screener with these filters:
- Relative Volume (RVol): Set it to greater than 2.5. This looks for stocks trading at least 150% hotter than usual.
- Average Daily Volume: Set it higher than 500,000 shares. This weeds out illiquid stocks that can't handle big moves.
- Price: Keep it above $5 to steer clear of most of the Wild West of penny stocks.
This is how you go from a simple visual cue to a precise, quantifiable signal.
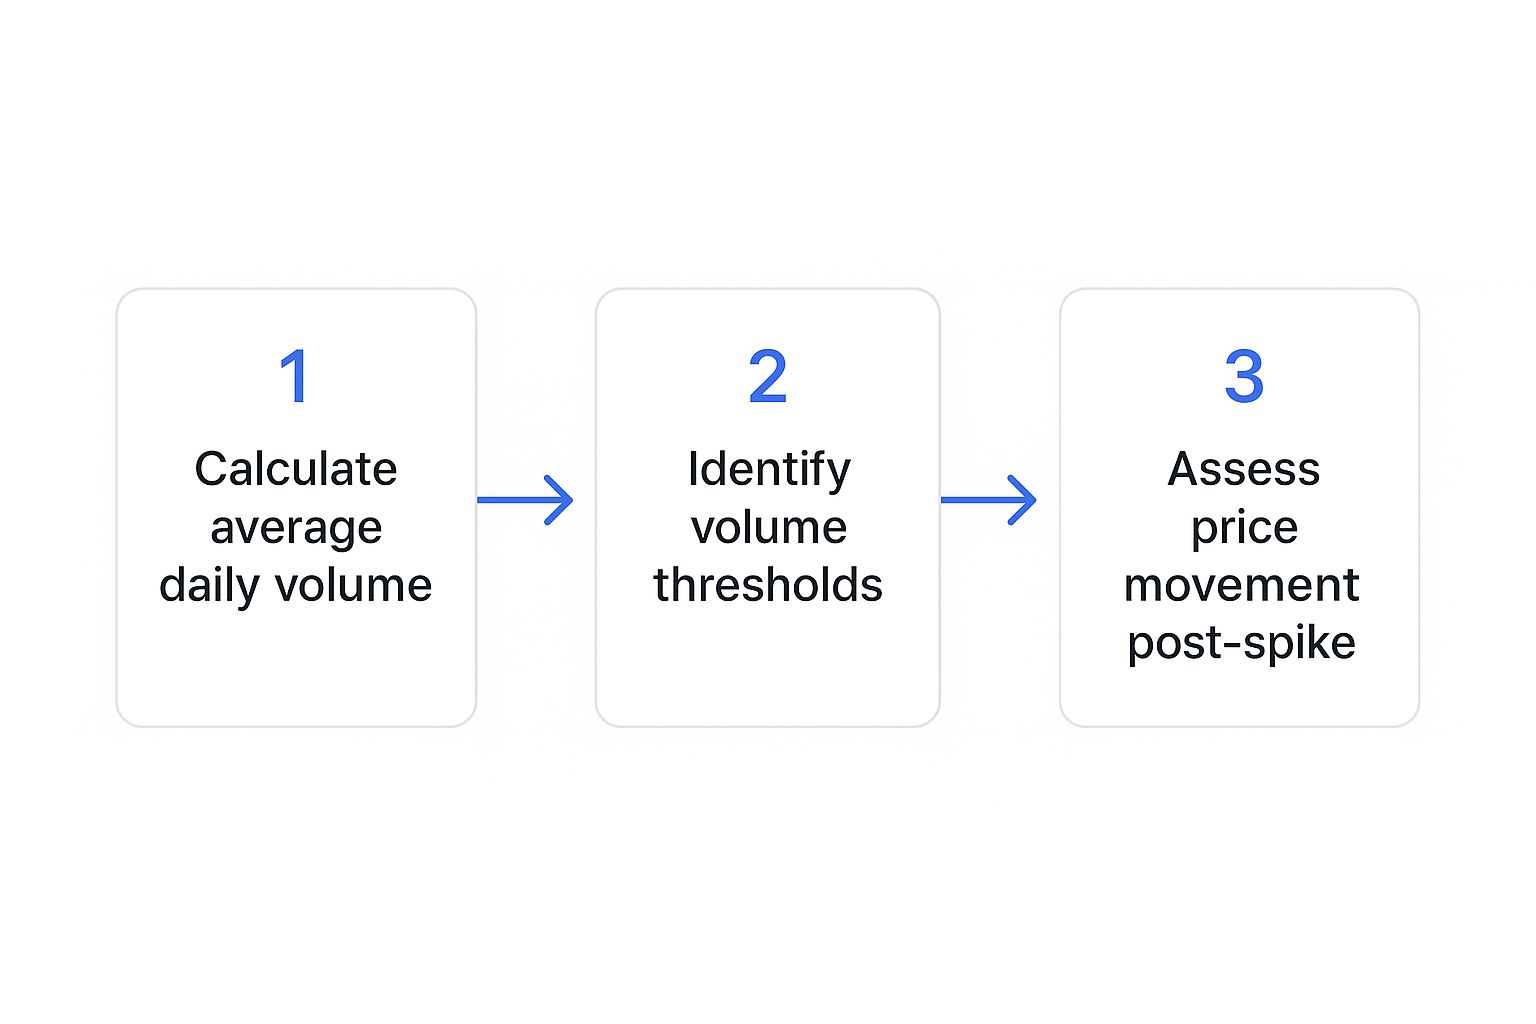
This workflow shows the whole process: establish a baseline, identify the spike, and then—most importantly—see how the price is reacting. By letting a screener find the action for you, you can save your energy for analyzing the handful of stocks that show genuine, unusual stock volume.
Reading the Story Volume Tells About Price
On any stock chart, price and volume are the two most fundamental pieces of the puzzle. While the price action tells you what happened, the volume tells you how it happened. Think of it as the emotional intensity behind a move—it reveals conviction. Learning to read their relationship is like learning to read the market's body language.
The most basic principle is that volume confirms the trend. Imagine a price trend is a car accelerating down the highway. Volume is the pressure on the gas pedal. If the car is speeding up (price is rising) and the driver is pressing harder on the gas (volume is increasing), you can feel pretty confident that the acceleration is real and likely to keep going.
On the other hand, if the car is still speeding up but the driver is letting off the gas (low volume), that momentum is probably fading. Master this core dynamic, and you're already ahead of the game.
Decoding High Volume Price Action
When a stock breaks through a key resistance level, that’s a big deal. But when it smashes through that level on a massive surge of unusual stock volume, it’s a powerful statement. This high-volume breakout shouts that a huge number of buyers—often the big institutional players—are convinced the stock is going higher. This wave of demand completely absorbs any sellers at that price, clearing the path for the stock to run.
The same logic works in reverse. A stock plunging below critical support on heavy volume signals aggressive, powerful selling. The sellers are stampeding for the exits, and there aren't enough buyers to soak up the supply. The path of least resistance is now clearly lower.
High volume is the market's stamp of approval on a price move. It separates a weak, tentative push from a decisive, powerful shove, giving you a much clearer picture of what the crowd is really thinking.
Reading the Nuances in Volume and Price
Of course, it's not always that simple. Sometimes, the story volume tells is more complex, signaling exhaustion or an intense battle rather than simple confirmation. Spotting these advanced patterns is what separates the pros from the amateurs, helping you avoid traps and see reversals before they happen.
A classic example is exhaustion volume. This often happens at the very peak of a long, powerful rally. After weeks of climbing, the stock makes one final, explosive move higher on the biggest volume spike of the entire trend. At first glance, this "buying climax" looks incredibly bullish. But it often signals that every last buyer has finally jumped in, leaving no one left on the sidelines to push the price higher. It's a sign of capitulation, and a reversal is often right around the corner.
Another critical pattern to watch for is high volume with almost no price change. If a stock is trading furiously but the price is stuck in a tight range, it means a fierce tug-of-war is underway. Buyers and sellers are locked in a battle for control at a key level. The eventual winner of this high-volume conflict will likely dictate the stock's next major move. For a deeper dive into these intricate patterns, you can explore our Volume Spread Analysis tutorial.
Sometimes, volume spikes to truly historic levels because of major corporate news. For example, on February 11, 2000, Vodafone shares traded over 2.1 billion shares in a single day. This was an extreme case of unusual stock volume driven by tectonic shifts in the telecom industry at the time. You can actually read about this record-setting day in the Guinness World Records entry. By learning to read these stories, you transform a simple chart into a rich narrative of market psychology.
Putting Volume Signals to Work: Actionable Trading Strategies

Spotting unusual stock volume is one thing. Actually making money from it? That’s an entirely different game. Turning that raw data into a repeatable, rule-based trading strategy is what separates the pros from the crowd.
The real goal is to move from just noticing a volume spike to executing a trade with a clear entry, a defined exit for when you're wrong, and a logical plan for taking profits. When you have a structured plan, you can act with confidence when a high-conviction signal flashes on your screen.
Let’s break down three distinct strategies that use volume as a core ingredient.
The High-Volume Breakout Strategy
This is a classic for a reason. The high-volume breakout is a pure momentum play, focused on stocks punching through a major price ceiling—like a long-term resistance level or a tight consolidation pattern—on a massive wave of volume.
The logic is simple: a breakout on weak, uninspired volume is often a "fakeout," designed to trap eager buyers. But a breakout confirmed by unusual stock volume suggests the big institutions are piling in, giving the move a much higher chance of follow-through.
Here’s a blueprint for trading it:
- Entry: Go long the moment the stock price decisively clears that resistance level. The key is that the volume on the breakout candle should be huge—at least 2.5x its 50-day average.
- Stop-Loss: Tuck your stop-loss just below the level that was broken. If the breakout fails and the price falls back below, you're out with a small, manageable loss.
- Profit Target: A simple rule of thumb is to aim for a profit that is two or three times your risk (the distance to your stop-loss). This keeps your risk-reward ratio firmly in your favor.
The Volume Reversal Strategy
If breakouts are for momentum traders, this one is for the contrarians looking to catch a turning point. The volume reversal strategy is all about spotting "climax volume" or "exhaustion volume"—a final, gigantic volume spike after a long, drawn-out trend.
This massive surge often signals that the last of the buyers (in a runaway uptrend) or sellers (in a steep downtrend) have finally thrown in the towel. With no one left to push the price further, the stage is set for a sharp reversal.
Climax volume is the market taking one last, desperate gasp at the peak or trough of a trend. If you can spot this, you can get ahead of the herd and anticipate the new direction before it becomes obvious.
The Post-Earnings Gap Strategy
Few things get volume flowing like a quarterly earnings report. This strategy takes advantage of the powerful, emotional move that often happens the day after a company announces blowout results or a complete disaster.
The first signal is a large price gap, up or down, on the opening bell. But the volume that pours in throughout the rest of the day is what truly validates the move, telling you whether institutions are supporting that new price level or if it's likely to fade.
- Entry: On a big gap up, savvy traders often wait for the initial frenzy to die down and look to enter on the first small pullback after the open, provided the volume stays elevated.
- Stop-Loss: A common spot for a stop-loss is just below the low of that initial, powerful earnings day candle.
- Profit Target: Earnings-driven moves can be explosive and short-lived. Many traders will simply ride the momentum and start taking profits as soon as it shows signs of slowing down.
Common Mistakes to Avoid When Analyzing Volume
Learning to use volume analysis effectively means knowing where the landmines are. It’s a bit like learning to read a weather map; if you misinterpret a key symbol, you could sail right into a storm. For traders, those mistakes can be expensive, quickly turning what looked like a sure thing into a painful loss.
The path to mastering unusual stock volume is littered with common traps. Falling into them leads to bad assumptions, worse trades, and plenty of missed opportunities. But if you know what they look like ahead of time, you can build a much smarter, more disciplined approach to trading.
Relying on Volume Alone
This is the big one. The single greatest mistake traders make is looking at volume in a vacuum. Volume is a confirmation tool, not a crystal ball. It adds weight and conviction to what the price is doing, but on its own, it’s mostly just noise.
Think of it like this: a roaring engine (high volume) is definitely interesting, but you still need to see which way the car (price) is actually moving. A massive volume spike on a stock that's just churning sideways doesn't signal a clear winner; it just tells you there's a big fight happening.
Volume without price context is just noise. Always ask yourself: "What is the price doing while this volume surge is happening?" The answer to that question is where the real insight lies.
A stock breaking above a key resistance level on weak, anemic volume is a huge red flag. Conversely, a stock breaking down through support on a tidal wave of volume tells you the sellers are serious. The two pieces of the puzzle—price and volume—have to tell the same story.
Falling for Low-Volume Breakouts
Few things look more tempting—or are more dangerous—than a low-volume breakout. You see a stock’s price finally poke its head above a long-standing resistance level. You jump in, excited to catch the next leg up, only to watch it fizzle out and collapse moments later. This is the classic "bull trap" in action.
Without a surge of unusual stock volume to power the move, there's no real conviction behind it. It’s a sign that only a handful of weak-handed buyers managed to nudge the price up, and they can be easily steamrolled the second any real selling shows up.
A real, sustainable breakout needs fuel. That fuel is a flood of buy orders from committed traders and, more importantly, from institutions with deep pockets. That's what creates the powerful demand needed to absorb all the sellers at that level and keep the momentum going.
Chasing Hype Instead of Substance
In today’s market, a volume spike can be driven by solid fundamentals or by nothing more than pure, unadulterated hype. A stock can see its volume explode simply because it's trending on social media, even with zero underlying news to justify a higher price.
Chasing this kind of volume is like betting on a rumor. Sure, the move can be explosive, but it’s often completely unsustainable. It can reverse just as fast, leaving emotional traders holding the bag.
Here’s how to stay grounded and avoid getting caught up in the madness:
- Find the Catalyst: Before you even think about trading a volume spike, ask yourself why it’s happening. Is there an earnings surprise? FDA news? A merger announcement?
- Check the Source: Is this volume being driven by a credible news event reported by reputable outlets, or is it all just chatter from anonymous accounts online?
- Stick to Your Plan: Never let the fear of missing out (FOMO) push you into breaking your own trading rules. A move driven by pure hype is often the perfect one to watch from the safety of the sidelines.
Still Have Questions About Volume? Let's Clear Them Up
We've covered a lot of ground, but it's natural to still have a few questions floating around. Let's tackle some of the most common ones I hear from traders trying to master volume analysis.
What is the best volume indicator to use?
Honestly, there's no single "best" one. The right tool really depends on what you're trying to accomplish.
For a quick, at-a-glance feel for market participation, the standard Volume Bar is a classic for a reason. It’s simple and effective.
If you want to understand how volume relates to price over a specific period, VWAP (Volume-Weighted Average Price) is a fantastic choice, especially for day traders looking for institutional benchmarks. For analyzing cumulative buying and selling pressure, On-Balance Volume (OBV) is tough to beat.
My advice? Don't just pick one. Experiment with a few and see which ones click with your specific trading style and strategy.
Can volume predict future price movements?
Volume isn't a crystal ball—nothing in trading is. But it's about as close as you can get to having an inside scoop on market conviction.
Think of it this way: Price tells you what is happening, but volume tells you how much force is behind that move.
A price spike on low volume is often just noise, a temporary blip that's likely to fizzle out. But a price spike on a massive surge in volume? That’s a different story. It signals strong conviction from big players and suggests the move has legs. So, while it can't predict the future with 100% certainty, it gives you a powerful edge by helping you gauge the probability of a trend continuing.
What is considered high trading volume?
This is a great question, and the answer is: "it's all relative." A 1 million share day might be monumental for a small-cap stock but just a drop in the bucket for a giant like Apple.
High volume is always defined in relation to the stock's own recent history. That's why we look for spikes that stand out from the norm. A good rule of thumb is to look for volume that's at least 2-3 times its 20-day or 50-day average trading volume.
This is where a tool like ChartsWatcher becomes indispensable. It automatically flags these unusual surges for you, so you don't have to manually track the average volume for hundreds of stocks. It does the heavy lifting and points you directly to where the action is happening right now.
