Inverse Head and Shoulders: Key Bullish Reversal Pattern
The Anatomy of Inverse Head and Shoulders Patterns

The inverse head and shoulders pattern is a valuable tool for traders seeking bullish reversals during a downtrend. It suggests a shift in market sentiment, from selling pressure to increasing buyer momentum. Recognizing this pattern is key to identifying market turning points.
Key Components of the Pattern
The pattern consists of four distinct elements:
-
Left Shoulder: The price drops to a low point and then rises slightly, creating a small peak. This initial dip can be interpreted as the last significant wave of selling.
-
Head: The price falls to a new low, lower than the left shoulder, forming the "head." This often reflects a temporary resurgence of sellers. The price then rises again, but not as high as the left shoulder’s peak.
-
Right Shoulder: The price drops again, but this time, the low is higher than the head's low. This "right shoulder" indicates that sellers are weakening. The price then rises to form a peak roughly even with the left shoulder's peak.
-
Neckline: A resistance line connects the peaks formed by the left shoulder, the head, and the right shoulder. Breaking above this neckline is a primary confirmation of a bullish reversal.
The Psychology Behind the Pattern
The inverse head and shoulders pattern reflects a change in market psychology. Diminishing volume during the head and right shoulder often signifies weakening selling pressure. As the price approaches the neckline, buying pressure builds. A breakout above the neckline usually triggers increased buying volume, solidifying the bullish reversal. For instance, a declining stock might form this pattern if investors perceive it as undervalued, sparking increased demand.
The pattern's historical performance is attractive to traders. Some analyses suggest an 80%+ success rate when confirmed by a surge in volume during the neckline breakout. altFINS, a platform for crypto and equities analysis, highlighted this pattern's presence across various assets in a 2024 analysis, emphasizing its reliability in markets like equities and forex. For a more detailed analysis, see their report on the inverse head and shoulder pattern.
Confirmation and Reliability
While the pattern itself is a strong signal, traders look for additional validation. This might involve analyzing trading volume using technical indicators like the Relative Strength Index (RSI) or assessing the overall market conditions. The steeper the neckline's angle, the greater the potential price movement is expected to be. By understanding this pattern and incorporating confirming signals, traders can better identify bullish reversals. This enables them to capitalize on potential market upturns.
Spotting High-Probability Inverse Head and Shoulders Setups
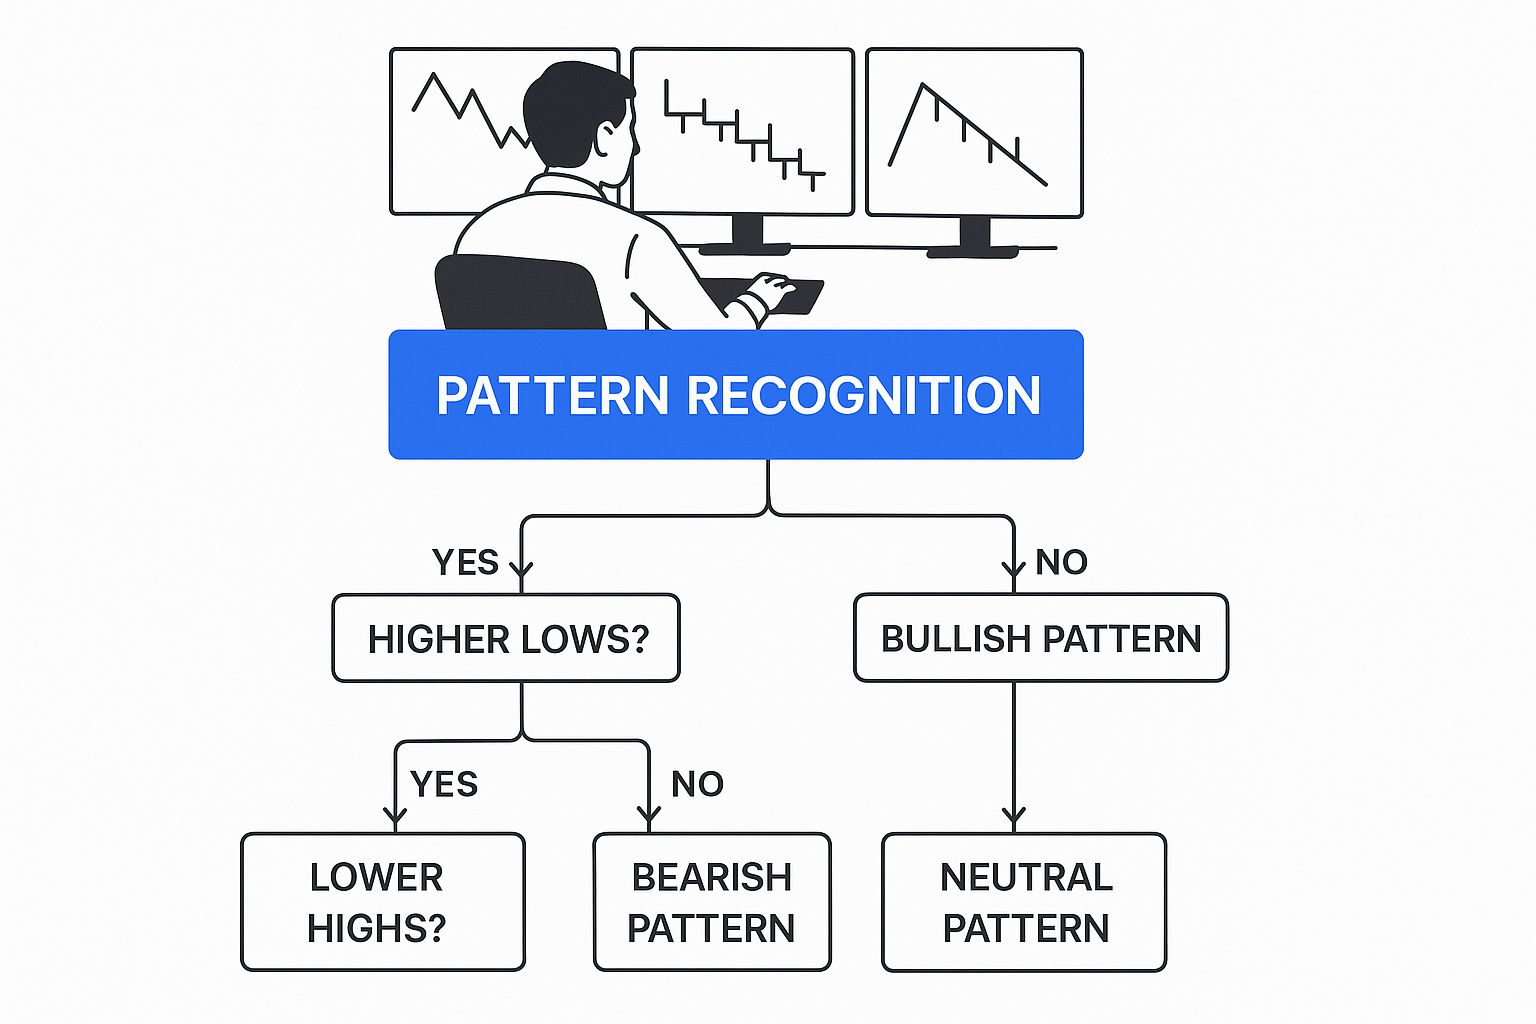
Identifying an inverse head and shoulders pattern is the first step. This infographic presents a decision tree to help visualize the criteria for identifying high-probability setups. This section focuses on filtering for high-probability setups that increase the chance of successful trades. We'll explore the details that separate promising patterns from failures.
Analyzing Pattern Symmetry and Proportions
A key factor in assessing pattern strength is the relationship between the shoulders and the head. Ideally, the shoulders should be roughly symmetrical in height and width. Perfect symmetry is uncommon. Small variations are acceptable, but large differences can indicate a weak pattern.
For example, a right shoulder much higher than the left might indicate continued selling pressure. This undermines the bullish reversal signal. The head should be noticeably lower than both shoulders, confirming a decisive low. A shallow head often leads to unreliable breakouts.
Neckline Configurations and Their Significance
The neckline's slope offers clues about breakout strength. A flat or slightly upward sloping neckline is generally preferred. It suggests a gradual build-up of buying pressure.
This contrasts with a steep neckline, which can be a bull trap. A steep neckline breakout might cause a quick price surge followed by a reversal as buyers take profits. A surge in volume confirms an ideal neckline breakout, reflecting strong conviction. Breakout confirmation is crucial for separating true reversals from false signals.
To further analyze inverse head and shoulders patterns, let's examine the following checklist:
Inverse Head and Shoulders Pattern Checklist
| Pattern Element | Ideal Characteristics | Warning Signs |
|---|---|---|
| Shoulders | Roughly symmetrical in height and width | Significant discrepancies between shoulder heights or widths |
| Head | Noticeably lower than both shoulders | Shallow head, not significantly lower than shoulders |
| Neckline | Flat or slightly upward sloping | Steeply angled neckline |
| Volume | Surge in volume upon neckline breakout | Weak volume during breakout |
This table summarizes the key characteristics of a reliable inverse head and shoulders pattern, allowing for quick comparison of ideal versus problematic elements. By using this checklist, traders can quickly assess the validity of a potential setup.
Using the Decision Tree for Analysis
The decision tree infographic simplifies evaluating inverse head and shoulders setups. This tool helps traders systematically assess the pattern’s parts and make informed decisions.
The decision tree guides you through questions. It starts by confirming the basic pattern. The tree then branches into shoulder symmetry, neckline slope, and volume confirmation. Each branch leads to different outcomes: high-probability setups, moderate-probability setups, or low-probability setups/false signals.
This structured approach helps traders filter out weaker patterns and focus on promising opportunities. This minimizes potential losses from flawed setups. Using ChartsWatcher's charting tools with the decision tree further enhances setup analysis. For more guidance, see our blog post on Master the Head and Shoulders Pattern: Proven Strategies.
Why Volume Tells the Real Story Behind Price Action
The inverse head and shoulders pattern hints at a potential bullish reversal. However, volume provides crucial context, revealing the true strength of market sentiment. It distinguishes genuine shifts from temporary price fluctuations, making it a vital tool for assessing inverse head and shoulders breakouts.
Deciphering Volume Throughout the Pattern
Volume changes during each phase of the inverse head and shoulders tell a story. Ideally, volume diminishes as the "head" forms, suggesting weakening selling pressure. This signals a potential loss of momentum for sellers.
The right shoulder ideally emerges with even lower volume, further indicating seller exhaustion. Imagine a tug-of-war: one side (the sellers) gradually weakens their pull, hinting at a shift in power. This low volume during the right shoulder is a key indicator of a valid pattern.
The Breakout Volume: Confirming the Reversal
The real test comes with the neckline breakout. This moment demands strong buyer conviction. A surge in volume accompanying the breakout confirms buyer dominance and validates the bullish reversal. This surge signifies a wave of new buyers propelling the price past resistance.
A low-volume breakout, conversely, is a warning sign. It suggests weak buyer enthusiasm, increasing the risk of a false breakout. This could mean a quick price retracement below the neckline, trapping traders who entered on the breakout signal. Learn more about volume analysis with this helpful resource: How to master Volume Spread Analysis.
Volume Thresholds and Follow-Through Potential
Volume dynamics are essential in validating the inverse head and shoulders pattern. Breakouts showing volume spikes of 25-40% above the 50-day average historically have a 70-80% follow-through rate, according to data from platforms like NYSE and NASDAQ. The right shoulder often develops on declining volume, signaling seller exhaustion. However, the neckline breakout needs surging volume to confirm a trend shift. Investopedia provides a deeper look into this pattern. These statistics highlight volume’s importance as a confirmation tool, illustrating its strong correlation with a sustained uptrend.
Integrating Volume Analysis with Price Action
Combining volume analysis with price action enhances pattern recognition and breakout confirmation, especially within platforms like ChartsWatcher. Using custom dashboards to view volume indicators alongside price charts allows for real-time pattern quality assessment. This synchronized perspective provides a comprehensive understanding of market dynamics, leading to better-informed trading decisions.
Setting Price Targets That Actually Get Hit
Identifying an inverse head and shoulders pattern is a crucial first step in technical analysis. Knowing where to place profit targets, however, transforms potential into actual gains. This section provides practical methods used by professional traders to calculate price objectives, maximizing returns when the pattern plays out.
Calculating Minimum Price Targets
The inverse head and shoulders pattern's quantifiable nature allows for precise minimum price target calculations. This straightforward method involves measuring the vertical distance between the head's lowest point and the neckline. This difference is then projected upwards from the neckline breakout point to establish the minimum target.
For example, if the head's low is $30 and the neckline is at $35, the projected target would be $40. This calculated target provides a clear benchmark. Remember, actual price action is influenced by real-time market conditions. Learn more about the inverse head and shoulders pattern and its target methodology.
Realistic and Maximum Price Objectives
While the minimum target offers a starting point, understanding realistic targets and maximum targets is crucial for profit maximization. Realistic targets often factor in nearby resistance levels identified through prior price action or technical indicators like Fibonacci retracements or moving averages. These levels may hinder upward momentum, suggesting an area for partial profit-taking.
Maximum price targets, though less precise, can be estimated by considering market context and historical volatility. In strong trending markets, prices frequently exceed the minimum target. Analyzing the asset's typical price fluctuations provides insight into the potential for more significant moves.
To help illustrate the potential risk and reward scenarios when trading this pattern, let's examine typical profiles across various markets. The following table offers valuable insights into average stop and target distances, typical risk-reward ratios, and historical success rates.
| Market Type | Average Stop Distance | Average Target Distance | Typical R:R Ratio | Success Rate |
|---|---|---|---|---|
| Forex | 50 pips | 100 pips | 2:1 | 70% |
| Stocks | $0.50 | $1.00 | 2:1 | 65% |
| Crypto | 5% | 10% | 2:1 | 75% |
As shown in the table, while the success rate and risk-reward ratios vary slightly between different asset classes, the potential for gains often outweighs the risks, highlighting the attractiveness of the inverse head and shoulders pattern. It’s crucial to remember that these figures represent average scenarios. Actual outcomes depend heavily on specific market conditions and individual trading strategies. Tools like those available in ChartsWatcher can further assist traders in refining these scenarios based on their analysis.
Refining Targets and Managing Risk
Static price targets, while useful, should adapt to changing market dynamics. Adjust your objectives based on evolving factors like trading volume and momentum. For example, unexpectedly high volume during a breakout might suggest adjusting targets upwards, while waning momentum could indicate lowering them.
Beyond setting targets, effective trade management includes position sizing to control risk exposure. Partial profit-taking at key resistance levels locks in gains, while trailing stops protect against sudden reversals while allowing participation in continued upward movement. These techniques provide a structured approach to navigating market complexities and optimizing risk-reward profiles.
Trading Strategies That Maximize Pattern Potential

Identifying the inverse head and shoulders pattern is only half the battle. This section explores advanced trading strategies designed to unlock the pattern’s true potential. We'll go beyond basic identification and dive into the sophisticated approaches used by experienced traders. This involves understanding entry techniques, risk management, and how to manage trades effectively.
Entry Strategies: Aggressive vs. Conservative
Several approaches exist for entering a trade based on the inverse head and shoulders pattern. Aggressive traders may enter as soon as the price moves above the neckline, aiming to capture the initial momentum. However, this carries a higher risk of encountering false breakouts.
Conservative traders, alternatively, might wait for a retest of the neckline after the initial breakout. This confirms buyer commitment and reduces the risk of a premature entry, helping to avoid losses from failed breakouts. Another conservative approach is waiting for the price to close above the neckline for two or more consecutive sessions, providing stronger evidence of sustained upward momentum.
Incorporating Confirming Indicators
Experienced traders rarely rely solely on the inverse head and shoulders pattern. They often use confirming indicators to strengthen their confidence. The Relative Strength Index (RSI) can highlight momentum divergences. A bullish divergence, where the RSI rises while the price falls during right shoulder formation, reinforces the reversal signal.
Examining the price in relation to moving averages can also be valuable. A breakout above a key moving average (such as the 50-day or 200-day MA) combined with a neckline breakout offers additional confirmation. For more information on head and shoulders patterns, check out this article: How to master the head and shoulders pattern.
Trade Management: Scaling In and Protecting Profits
Managing a trade effectively through its completion is just as important as the initial setup. Scaling into a position allows traders to gradually increase their exposure as the pattern develops, limiting risk while allowing for greater profit potential if the price accelerates. This involves starting with a smaller position and adding to it as the price moves favorably.
Protecting profits involves the strategic use of stop-loss orders. A common practice is placing an initial stop-loss just below the right shoulder low. As the price rises, this stop-loss can be trailed upwards, locking in profits while leaving room for further gains. Many traders use a combination of fixed and trailing stops to manage risk and secure profits.
Handling Pattern Failures
Not every inverse head and shoulders pattern results in a profitable breakout. Recognizing and responding to failed patterns is crucial for capital preservation. A failed pattern might involve a breakout that quickly reverses back below the neckline, often on low volume, suggesting weak buyer conviction.
When a pattern fails, a swift exit minimizes losses. Analyzing the reasons for the failure can offer valuable lessons for future trades. This analysis might reveal flaws in the initial setup or unexpected market events. The ChartsWatcher platform offers powerful tools for analyzing these scenarios and backtesting strategies. ChartsWatcher's custom dashboards and advanced charting features can significantly improve the effectiveness of these trading techniques.
Real-World Success: Inverse Head and Shoulders in Action
Theory is valuable, but putting it into practice is where the real power lies. This section examines real-world examples of the inverse head and shoulders pattern across diverse markets, including stocks, forex, commodities, and cryptocurrencies. Each case study offers a complete story: from initial identification and volume confirmation to entry execution, risk management, target achievement, and final outcome assessment. We'll also explore the specific market conditions surrounding each trade, highlighting the factors that contributed to their profitability.
Case Study 1: Tech Stock Reversal
In early 2023, a well-known tech stock experienced a significant decline after a disappointing earnings report. However, observant traders noticed an inverse head and shoulders pattern developing on the daily chart. The left shoulder formed with decreasing volume, followed by a lower head with even lighter volume. As the right shoulder emerged, the subdued volume hinted at potential seller exhaustion.
The neckline breakout, accompanied by a surge in volume, confirmed buyer dominance. Traders who entered long positions at this point, with stop-loss orders positioned below the right shoulder, saw profits as the stock rallied towards its calculated price target. Utilizing customizable dashboards on platforms like ChartsWatcher significantly aided traders in making real-time decisions. To further understand marketing strategies, consider exploring these digital marketing strategies.
Case Study 2: Forex Currency Pair Breakout
A popular forex currency pair displayed the inverse head and shoulders pattern on a 4-hour chart in mid-2024. While the pair had been trending downwards, the pattern suggested a possible reversal. This potential shift was confirmed by a neckline breakout and a spike in volume. Traders using platforms like ChartsWatcher, which offer synced chart and technical indicator views, were able to confidently validate the breakout. This facilitated precise entries and risk management through strategically placed stop-loss orders below the right shoulder low. The pair’s upward movement toward its minimum calculated target generated substantial profits for those who recognized and acted on the pattern.
Case Study 3: Gold Commodity Rebound
The gold market, often influenced by larger economic forces, presented a compelling inverse head and shoulders pattern on a weekly chart in late 2024. Following a period of decline, the pattern emerged with well-defined shoulders and head. Volume analysis revealed decreasing selling pressure during the head's formation, a classic indicator of a potential reversal. The neckline breakout, characterized by a surge in buying volume, ignited a significant rally in gold prices. Traders using advanced charting tools, like those offered by ChartsWatcher, effectively tracked these long-term patterns and managed positions accordingly, minimizing risks while maximizing returns.
Developing Transferable Pattern Recognition Skills
By examining these diverse cases, you can build valuable pattern recognition skills applicable across various asset classes and timeframes. ChartsWatcher empowers traders to track, analyze, and backtest these patterns across multiple markets, refining their strategies and enhancing their overall performance. The ability to customize dashboards and sync key data points provides a significant advantage in navigating the complexities of the financial markets.
Ready to improve your trading with advanced charting and pattern recognition? Explore the power of ChartsWatcher today and unlock your market potential! Start your free trial now!
