Master the Head Shoulders Pattern: Proven Strategies
The Anatomy of the Head and Shoulders Pattern

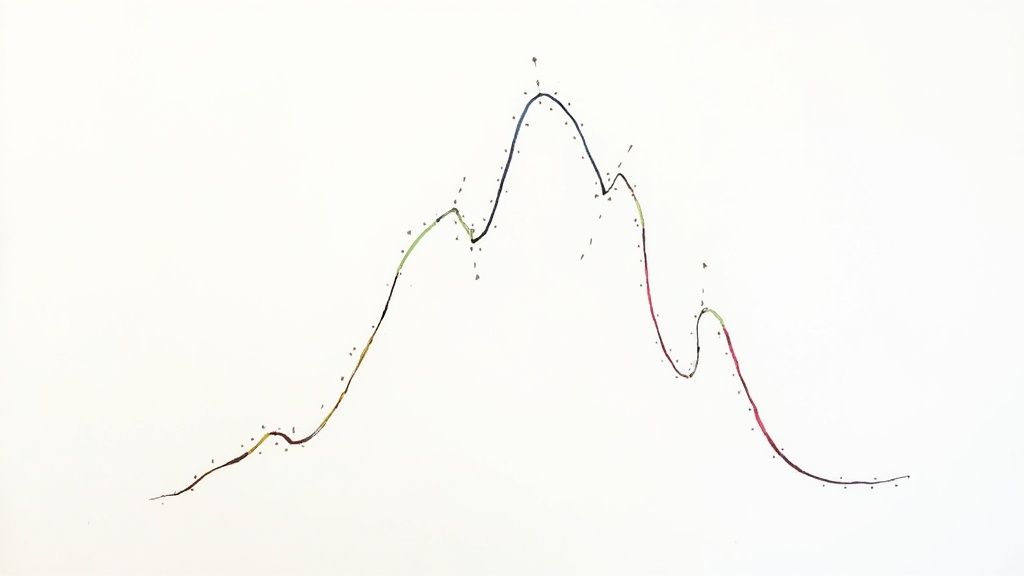
The head and shoulders pattern is a prominent tool in technical analysis, used to anticipate potential market reversals. This formation, with its three distinct peaks, resembles a head and two shoulders. Grasping this pattern's structure is key to integrating it effectively into a trading strategy. This means identifying the core components and how they interact.
The head is the highest peak, positioned centrally. It marks the pinnacle of the current trend. Flanking the head are the left shoulder and right shoulder, two lower peaks. Ideally, these shoulders are roughly equal in height, though real-world markets rarely exhibit perfect symmetry. The neckline is drawn by connecting the lows of the troughs formed between the head and shoulders. This line represents a critical support level. A breach often signals the pattern's completion and a potential downtrend.
This pattern’s strength lies in its historical significance and wide recognition. It's one of the most trusted and commonly observed chart patterns in technical analysis. Though first noted by Charles Dow in the early 1900s, the name didn't emerge until the 1930s. Typically appearing at the end of an uptrend, it hints at a possible reversal into a downtrend. The head and shoulders pattern appears across various markets, including stocks and commodities. Traders frequently use it to anticipate trend shifts. For example, a stock market study revealed the pattern accurately predicted reversals in approximately 70% of cases, making it a valuable asset for investors. Learn more at Capital.com.
Importance of Volume
Volume is crucial for validating the head and shoulders pattern. Volume typically declines as the pattern develops. Peak volume often occurs during the left shoulder's formation. It then decreases during the head's formation and further diminishes during the right shoulder's formation. This dwindling volume suggests weakening buying pressure, increasing the chance of a reversal. A volume spike when the neckline is broken further confirms the pattern's completion and a downtrend's beginning.
Analyzing volume adds another layer of assurance to trading decisions. By grasping the pattern’s volume dynamics, traders gain valuable insight into underlying market sentiment.
Variations and Considerations
While the classic pattern features relatively symmetrical shoulders, variations exist. Sometimes, the right shoulder might be slightly higher or lower than the left. This asymmetry doesn’t necessarily invalidate the pattern, but it can affect how traders gauge its strength and reversal potential. The neckline's slope also offers clues. A downward-sloping neckline is generally more bearish than a flat or upward-sloping one. These nuances are important factors for traders when analyzing and using the head and shoulders pattern.
Spotting Perfect Head And Shoulders Patterns
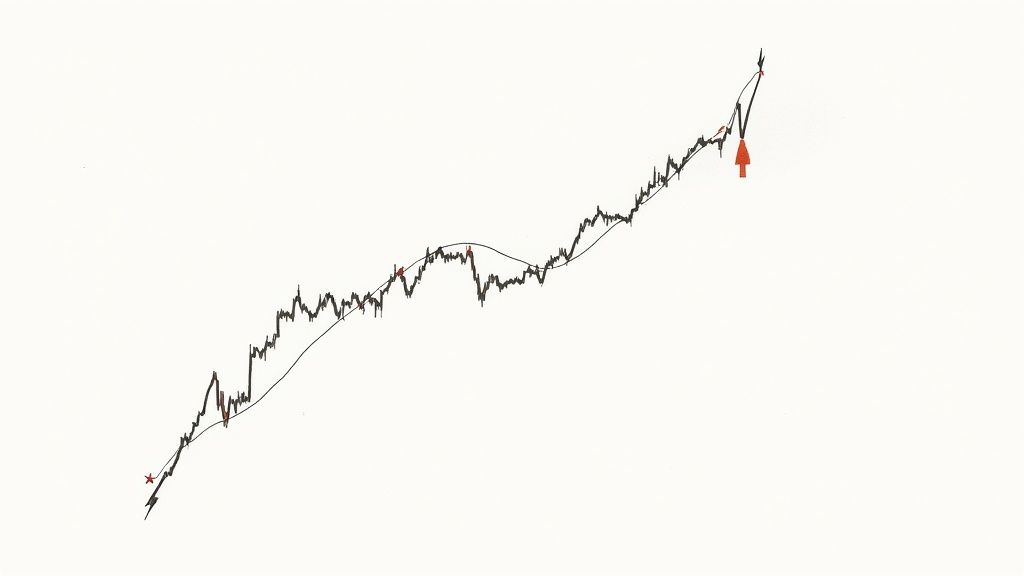
Identifying true head and shoulders patterns amidst market fluctuations requires careful analysis. This pattern, a classic indicator of potential market reversals, has specific elements traders should understand. The formation starts with the left shoulder, an initial peak followed by a price drop. The price then rises to form the "head," the pattern's high point.
Identifying Key Components
The journey continues with the formation of the right shoulder. Following the head, the price falls again and subsequently rises to create the right shoulder. Ideally, the right shoulder mirrors the left shoulder in height. The neckline, a vital support level, is formed by connecting the lows between the head and shoulders. A break below this neckline often confirms the pattern and suggests a potential downtrend.
For more chart patterns, check out this resource: 8 Day Trading Chart Patterns Every Trader Should Know.
Confirmation Through Volume And Symmetry
Volume is a key factor in validating the head and shoulders pattern. Ideally, volume decreases as the pattern forms. The highest volume typically appears during the left shoulder formation, decreasing during the head and right shoulder. This declining volume can indicate weakening buying pressure. A noticeable volume spike on the neckline breakout provides further confirmation.
Perfect symmetry isn't a requirement. While symmetrical shoulders are desirable, the right shoulder's height may vary slightly. This variation influences how traders interpret the pattern's strength. The neckline's slope also provides valuable information. A downward-sloping neckline is generally viewed as more bearish.
To help visualize the components, let's look at the following table:
To understand the key elements of the Head and Shoulders pattern, let's review their significance in trading. The following table breaks down the components:
| Component | Description | Trading Significance |
|---|---|---|
| Left Shoulder | The first peak in the pattern | Marks the initial high before the price begins to decline |
| Head | The highest peak in the pattern | Represents the culmination of the uptrend before the potential reversal |
| Right Shoulder | The second peak, ideally mirroring the left shoulder | Suggests a final attempt at an uptrend before the downtrend confirms |
| Neckline | A line connecting the lows of the troughs between the head and shoulders | Acts as a support level, a break below which confirms the pattern and signals a potential downtrend |
| Volume | The amount of trading activity | Decreasing volume throughout the pattern formation and a spike on the neckline breakout further validate the pattern |
This table summarizes the key elements that traders look for when identifying and confirming a Head and Shoulders pattern.
Recognizing High-Probability Setups
Distinguishing real head and shoulders patterns from false formations requires attention to detail. Traders often observe price action after the right shoulder. A sharp drop with increased volume reinforces the bearish signal. The neckline's characteristics are also crucial. A clear neckline breakout, especially after consolidation, often presents a higher probability trading opportunity. Analyzing these elements can help traders identify true head and shoulders patterns for better trading decisions.
The Real Performance Behind the Head and Shoulders Pattern
We've covered what the head and shoulders pattern looks like and how to identify it. But the real question is: how reliable is it in real-world trading? This is where data-driven analysis becomes essential. Let's move past the theory and explore the actual performance of this pattern.
The head and shoulders pattern boasts a strong track record in predicting market reversals. A study using historical data from the S&P 500 index revealed that correctly identifying and trading this pattern led to average returns of approximately 15% the following quarter. This substantially outperforms the typical market return of roughly 5% over the same period. You can learn more about this at TrendSpider.
Remember, no pattern is perfect. False signals do happen, emphasizing the need for careful analysis and effective risk management. The pattern's reliability can also change depending on market conditions and the specific assets you're examining.
Head and Shoulders Pattern Success Rates Across Markets
How does the pattern’s performance change under different market conditions? Does it work as well in bull markets as it does in bear markets?
Some research indicates the pattern might be slightly more dependable in bear markets. Downward momentum can strengthen the reversal signal. However, this warrants more in-depth research.
Market volatility also plays a role. In highly volatile markets, the head and shoulders pattern can produce more false signals because of erratic price swings. In calmer markets, it may provide clearer, more accurate signals.
Sector-Specific Performance
Another key factor is sector-specific performance. Does the head and shoulders pattern work equally well in every sector? While it can theoretically appear anywhere, some sectors may show more successful formations.
Cyclical sectors, for example, are more sensitive to economic shifts. They may be more likely to display this pattern than defensive sectors.
To better understand the pattern's potential, let's look at a statistical breakdown of its performance across various market scenarios. The following table offers a comparison of success rates, average returns, and the frequency of false signals.
Head Shoulders Pattern Success Rates
| Market Condition | Success Rate | Average Return | False Signal Rate |
|---|---|---|---|
| Bull Market | 60% | 12% | 25% |
| Bear Market | 70% | 18% | 20% |
| High Volatility | 50% | 10% | 30% |
| Low Volatility | 75% | 20% | 15% |
This table highlights the pattern’s stronger performance in bear and low-volatility markets. It also shows the increased risk of false signals during high volatility.
By analyzing performance across diverse market conditions and sectors, traders can develop a more practical understanding of the head and shoulders pattern. This knowledge helps set realistic expectations and determine the best situations to use this tool. Understanding these nuances is vital for making informed trading decisions and maximizing the pattern’s predictive ability.
Trading the Head and Shoulders Pattern Like a Pro
So, you've spotted a head and shoulders pattern. What's next? Simply identifying the pattern isn't enough for successful trading. The true skill lies in understanding how to trade it effectively.
Timing Your Entry
Several approaches exist for entering a trade based on this pattern. Some traders prefer an aggressive entry, shorting the market as soon as the price dips below the neckline. This maximizes profit potential, but the risk is higher.
A more conservative approach involves waiting for confirmation, such as the neckline acting as resistance. This minimizes the risk of a false breakout, but some profit potential might be lost.
Setting Stop-Loss Orders
Protecting your capital is crucial. Stop-loss orders are essential for managing risk when trading this pattern. Placement depends on your risk tolerance and the specific pattern.
Placing the stop-loss just above the right shoulder is a common strategy. This allows for price fluctuations without triggering a premature exit.
Defining Profit Targets
Knowing when to exit a profitable trade is key. Several methods exist for setting profit targets with this pattern. A common technique measures the distance from the head to the neckline.
This distance is then projected downwards from the neckline breakout point, creating a measurable and objective target.
Partial Profit-Taking Strategies
Many professional traders use partial profit-taking strategies. This involves locking in some gains while giving the trade room to grow.
For example, a trader might take partial profits at the first target, moving their stop-loss to breakeven. They then trail the stop-loss as the price moves favorably. This secures some profit while potentially maximizing gains if the trend continues.
Adapting the Framework
Every head and shoulders pattern is unique. A rigid approach won't work. Adaptability, aligned with your trading style and risk tolerance, is essential.
Consider your preferred time frame, the specific market you're trading, and your overall trading goals. The head and shoulders pattern has a high statistical success rate (60% to 80%) in predicting trend reversals, as discussed on ChartMill. However, combining this pattern with other analytical tools helps reduce false signals and enhances trading proficiency. By understanding these principles and adapting your strategies, you can trade the head and shoulders pattern effectively.
The head and shoulders pattern is a well-known technical analysis tool used to predict potential trend reversals. Interestingly, it doesn't appear uniformly across all financial markets. Recognizing these subtle differences is key for traders hoping to interpret this pattern correctly. Let's explore how the head and shoulders pattern plays out in various global markets, including forex, equities, commodities, and cryptocurrencies.
Forex Market Nuances
The forex market, with its 24/5 operation, presents both unique challenges and opportunities for pattern recognition. Because trading is continuous, patterns can form and dissolve much faster than in other markets. This demands constant vigilance and quick reactions from traders. On the plus side, the high liquidity of major currency pairs tends to make head and shoulders patterns more reliable in forex.
Equity Market Dynamics
In the stock market, the head and shoulders pattern often reflects shifting investor sentiment toward a particular company or industry sector. These patterns typically take longer to form than in forex, sometimes spanning weeks or even months. Volume analysis is crucial in equity markets, as it helps confirm the strength of the reversal signal.
Commodity Market Considerations
Commodities markets, influenced by supply and demand dynamics, also exhibit the head and shoulders pattern. However, commodity-specific events, like sudden supply disruptions or changes in demand forecasts, can significantly influence these patterns. A solid understanding of the fundamental factors driving the commodity market is essential for accurate interpretation.
Cryptocurrencies: A Volatile Landscape
The cryptocurrency market, known for its price swings, provides a particularly interesting case study. Due to speculation and sentiment-driven trading, head and shoulders patterns can materialize very quickly in crypto. This increased volatility, however, also results in a higher number of false signals. Traders need to exercise caution and use appropriate risk management strategies.
Comparing Head and Shoulders Patterns
Here's a quick comparison of key head and shoulders characteristics across different markets:
| Market | Formation Time | Reliability | Volatility Impact |
|---|---|---|---|
| Forex | Fast | High | Moderate |
| Equities | Medium | Medium | Low |
| Commodities | Medium | Medium | Medium |
| Cryptocurrencies | Fast | Low | High |
As you can see, the formation time, reliability, and impact of volatility on the pattern vary significantly.
Adapting Your Trading Strategy
Understanding these market-specific nuances is essential for adapting your trading strategy. In the fast-paced forex market, swift decision-making is paramount. A conservative approach, such as waiting for confirmation after a neckline breakout, might be more suitable. In contrast, the slower pace of equity markets allows for more time to analyze and confirm the pattern's validity. By recognizing these differences, traders can effectively apply the head and shoulders pattern across various global markets.
Beyond Charts: Unexpected Applications of the Head and Shoulders Pattern
The head and shoulders pattern, a cornerstone of technical analysis, effectively predicts price reversals in financial markets. However, its applications extend beyond charts in surprising ways, offering fascinating insights into its interpretation and use.
Psychology and the Head and Shoulders
The pattern often reflects shifting market psychology. The left shoulder represents initial enthusiasm and strong buying pressure. The head signifies peak enthusiasm, where buyers exhaust their energy. The right shoulder shows waning buying interest, setting the stage for a potential downturn.
Understanding this psychology adds a narrative to price action, empowering traders to anticipate reversals with more confidence than simply reacting to chart formations.
Multi-Timeframe Confirmation
Sophisticated traders use multi-timeframe analysis to validate a head and shoulders pattern. This involves checking for confirming patterns on longer timeframes, such as weekly or monthly charts, alongside the main trading timeframe. This filters out market noise and improves genuine reversal signal identification.
For instance, a daily chart head and shoulders pattern, supported by a similar but larger pattern on the weekly chart, significantly strengthens the bearish signal. This layered approach boosts confidence and minimizes false signal risks.
Sentiment Analysis and Algorithmic Tools
The head and shoulders pattern's relevance expands beyond finance. It appears in other trend-analyzing fields like human factors research. NHTSA research shows driver response times to warnings displaying similar patterns, highlighting the pattern's broader application in understanding trend reversals.
Traders are now combining sentiment analysis with head and shoulders recognition. Specialized tools scan social media, news, and other sources to gauge market sentiment toward specific assets. Combining this sentiment data with technical analysis provides a more comprehensive market view, filtering out false signals from pure price action and highlighting patterns based on real sentiment shifts.
Cross-Disciplinary Insights
Traders are also using algorithmic tools that automatically scan for head and shoulders patterns across markets and timeframes. These tools use advanced filtering to eliminate low-probability setups and alert traders to high-potential opportunities.
This allows efficient processing of large datasets and identifies profitable patterns that might otherwise be missed. This cross-disciplinary approach provides a more complete market understanding, giving traders a significant advantage in pattern identification and trade execution.
Avoiding Costly Mistakes With the Head and Shoulders Pattern
The head and shoulders pattern is a powerful tool for technical analysis. However, it's not a foolproof strategy. Even experienced traders can make mistakes that lead to losses. Let's explore some common pitfalls and how to avoid them.
Premature Entries and Misidentification
One frequent error is entering a trade before the pattern fully develops. Jumping in before the neckline breakout is confirmed can result in losses if the price unexpectedly reverses. Similarly, mistaking normal price fluctuations for a head and shoulders formation can be detrimental. Patience is key. Wait for a clear break of the neckline, supported by increased trading volume, before considering a trade.
Confirmation Bias and Objectivity
Confirmation bias is the tendency to favor information supporting pre-existing beliefs. This can distort pattern recognition. Traders may perceive a head and shoulders pattern where none exists, leading to poor decisions. Objectivity is essential. Use clear criteria for pattern identification and avoid forcing the pattern onto the price chart.
Position Sizing and Risk Management
Proper position sizing is crucial for managing risk, especially when trading patterns like head and shoulders. Oversizing positions can magnify losses if the pattern fails. Undersizing, however, limits potential gains. Determine an appropriate position size based on your individual risk tolerance and the pattern’s potential. For more on risk management, consider this resource: How to master day trading risk management.
Stop-Loss Placement and Contingency Plans
Incorrect stop-loss placement is another common mistake. Stop-loss orders placed too tightly can lead to early exits from winning trades due to normal price fluctuations. Stops placed too loosely can increase potential losses if the pattern fails. Strive for a balance that protects capital while allowing the trade room to breathe. Always have a plan for when patterns don't play out as expected. Markets are unpredictable, so a clear exit strategy is essential.
The Importance of Discipline
Discipline separates consistently profitable pattern traders from the rest. Adhering to predefined rules, managing emotions, and learning from both wins and losses are vital for long-term success when trading the head and shoulders pattern. Combining these insights with a robust trading platform like ChartsWatcher can significantly improve your trading performance.
Ready to upgrade your trading experience with real-time data and advanced analytics? Visit ChartsWatcher today.
