Your Guide to the Inside Bar Pattern
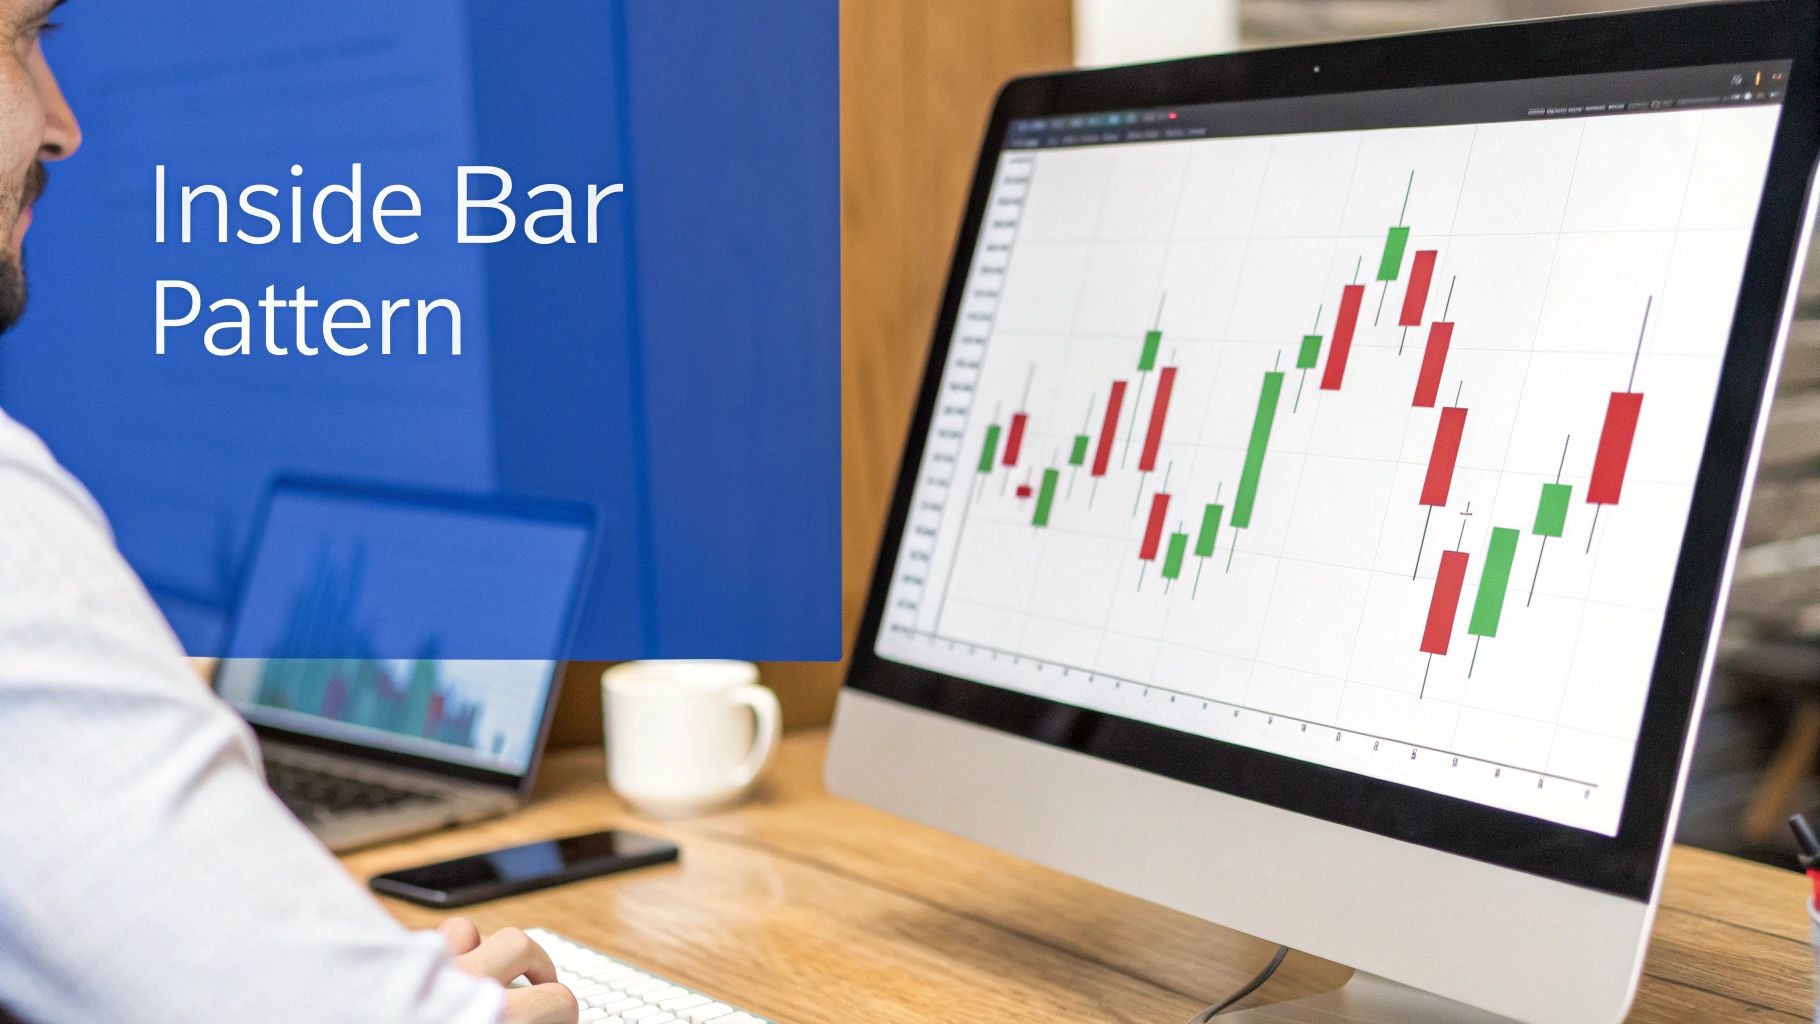
Of all the patterns you'll see on a price chart, the inside bar is one of the classics. It’s a simple, two-bar formation that tells a powerful story about what’s happening behind the scenes in the market.
At its core, the pattern shows up when a smaller candle—the “inside bar”—forms completely within the high-to-low range of the candle that came right before it. We call that bigger, first candle the “mother bar.”
Think of it as a temporary pause or a moment of consolidation. It’s a sign that the market is taking a breath before its next big move.
Understanding the Anatomy of an Inside Bar Pattern
The best way to think about an inside bar is to see it as a visual story of market indecision.
Imagine a heated tug-of-war between buyers and sellers. The mother bar represents a period of strong conviction, where price moved over a wide range. But the inside bar that follows shows that the fight has hit a temporary stalemate. Neither side could push the price beyond the previous period’s high or low.
This tightening of the price range is like a coiled spring, building up energy for its next release.
This simple two-bar structure is a cornerstone of price action trading because it signals a drop in volatility and a moment of equilibrium. Traders watch this pattern closely because a break outside of the mother bar's range often kicks off the market's next directional move. It’s a powerful clue that the period of indecision is over.
Key Components of the Pattern
To spot an inside bar pattern on your chart, you just need to confirm two simple conditions. Both are non-negotiable for a valid setup:
- The Mother Bar: This is the first, larger candle. It sets the high and low boundaries for the consolidation.
- The Inside Bar: This is the second, smaller candle. Its high must be lower than the mother bar's high, and its low must be higher than the mother bar's low.
Let's quickly summarize what makes this pattern tick.
Inside Bar Pattern Key Characteristics
| Component | Description | What It Signifies |
|---|---|---|
| Mother Bar | The first, larger candle that sets the trading range. | A period of higher volatility or a strong directional move. |
| Inside Bar(s) | One or more smaller candles fully contained within the mother bar's high and low. | A temporary pause, consolidation, or market indecision. |
| Context | Often appears after a strong trend or at key support/resistance levels. | The pause is significant and may lead to a continuation or reversal. |
This table gives you the essential ingredients. When you see these elements align, you know you're looking at a potential trading opportunity.
While the pattern itself is common, its true power comes from its high-probability nature when it shows up in the right context. If you're new to technical analysis, getting the basics of reading price charts down is the first critical step. To build that solid foundation, check out our complete guide to understanding candlestick graphs.
Why This Pattern Is a Trader's Favorite
The inside bar pattern isn't something you see every day, which adds to its significance when it does appear.
For instance, one study of the S&P 500 found that only about 22% of trading days qualified as "inside days." But here's the interesting part: when these days did occur, the price broke out of the previous day's range an impressive 77.78% of the time.
That suggests that nearly eight out of ten inside bars are followed by a breakout. It’s a high-probability setup that makes it a staple for traders looking for clear entry signals with well-defined risk.
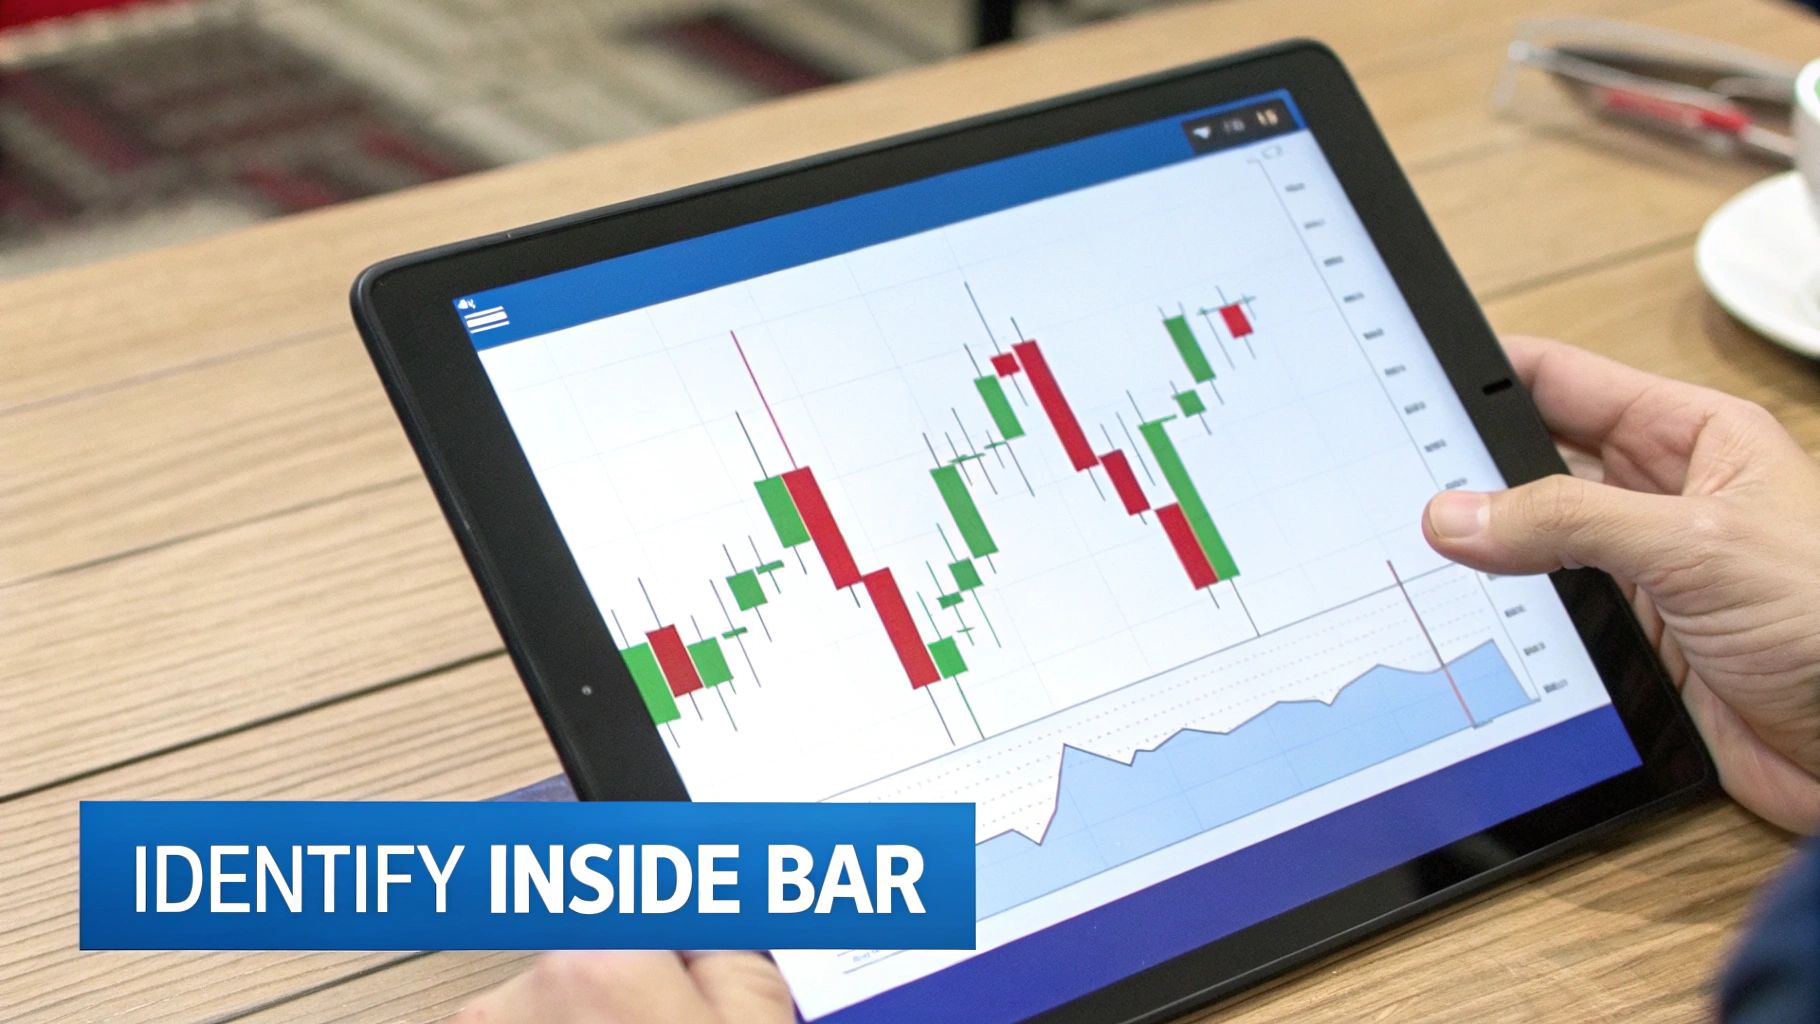
How to Identify an Inside Bar on Any Chart
Spotting an inside bar pattern in real time is a fundamental skill for any price action trader. The good news? The rules are incredibly straightforward, making it one of the easiest patterns to find once you know what to look for. Training your eye to catch these setups across different charts and timeframes is the first step toward building a solid trading strategy around them.
At its core, the principle is simple: an inside bar is a candle whose entire price range—from its high to its low—is tucked neatly inside the range of the candle that came right before it, called the mother bar. Think of it as a small candle nesting inside a larger one.
The Two Non-Negotiable Rules
To be sure you've found a valid inside bar pattern, you only need to check two things. These rules aren't flexible; they have to be met for the pattern to count.
- The High of the Inside Bar: It must be lower than the high of the mother bar.
- The Low of the Inside Bar: It must be higher than the low of the mother bar.
If both of those are true, you've got yourself a classic inside bar. It represents a clear tightening of price volatility, signaling that the market is taking a breather and consolidating after the bigger move made by the mother bar. This temporary standoff is often the quiet before a much bigger move.
The chart below shows a perfect example of an inside bar popping up after a strong bullish run.
See how the second candle's body and wicks are completely "inside" the range of the first one? That's your signal—a pause in the uptrend.
Watching for Coiling Patterns
Sometimes, the market's indecision lasts for more than just a single candle. When you see two, three, or even more inside bars forming one after another, all within the range of the same mother bar, you've found a coiling pattern. Each new inside bar is usually smaller than the one before it, showing that volatility is shrinking even more.
This coiling action is like winding up a spring. The longer the consolidation, the more energy gets stored up, which can lead to a much more explosive breakout when the price finally cracks the mother bar's high or low.
Many traders see these multi-bar setups as particularly powerful signals. That extended period of indecision builds up serious pressure, so the eventual breakout often comes with a ton of momentum.
Distinguishing True Setups from Noise
Not every small candle is a meaningful inside bar. Context is everything. A real inside bar gets its power from the market environment where it appears. For instance, a pattern forming after a strong, clean trend is far more reliable than one showing up in the middle of a messy, sideways market with no clear direction.
To get better at reading the market's cues, it helps to explore the broader concepts of technical analysis in crypto markets and other assets. A valid pattern is just one piece of the puzzle. Understanding the bigger picture is what helps you filter out the low-probability trades. By focusing only on inside bars that align with the dominant trend or form at key support and resistance levels, you can dramatically improve your odds and avoid getting faked out by market noise.
The Psychology Behind Market Indecision
Every chart pattern tells a story, and the inside bar is a fascinating one. It’s more than just two candles; it’s a snapshot of the market's collective mind hitting the pause button. Think of it as a temporary truce in the endless tug-of-war between buyers (bulls) and sellers (bears). The big candle that comes first—the mother bar—shows a period of strong conviction. But then, the smaller inside bar pops up, signaling that the momentum just ran out of steam.
This pause represents a moment of equilibrium. Neither side has the strength to push the price past the high or low of the previous candle. It's a phase of consolidation where the market is essentially taking a breath, coiling up energy for whatever comes next. Grasping this underlying psychology is what elevates a trader from just reading charts to truly analyzing the market.
Decoding the Story Within the Pattern
The location of the inside bar, relative to its mother bar, gives you some powerful clues about what might happen next. It tells you who could be winning the psychological battle, even during the quiet period.
- Continuation Signal: An inside bar huddled near the top of a bullish mother bar is often a sign that buyers are just catching their breath before another push higher. It suggests the underlying strength is still there, pointing to a likely upward breakout.
- Reversal Signal: On the other hand, if that inside bar forms near the bottom of the same bullish mother bar, it's a potential red flag. This hints that sellers are starting to step in and absorb the buying pressure, suggesting the bullish run is losing its power.
This infographic breaks down how the inside bar's position can hint at simple consolidation, a continuation of the trend, or a full-blown reversal.
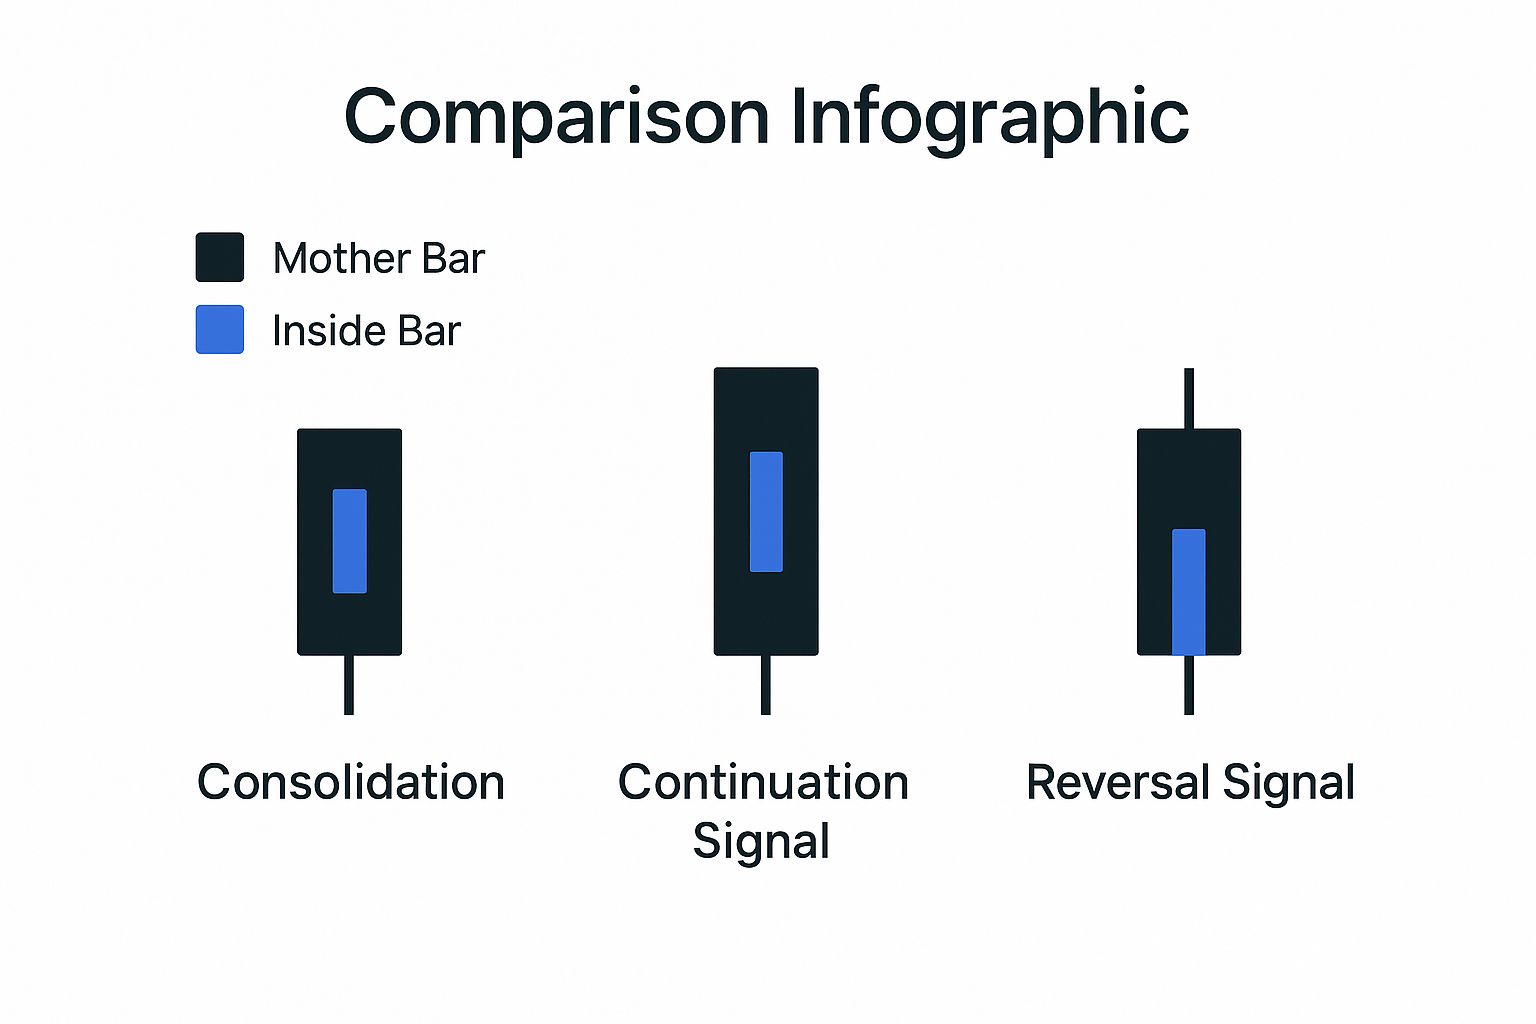
As you can see, a tiny inside bar right in the middle suggests simple consolidation. But when it leans toward one of the extremes of the mother bar, you're getting a much deeper insight into the market's mood.
The Calm Before the Breakout
This period of indecision often sets the stage for a powerful breakout. During this consolidation, big players might be quietly accumulating positions (buying without spooking the market) or distributing them (selling off their holdings) before the next major trend kicks in.
The core idea is simple: inside bars represent a temporary balance. Buyers and sellers have fought to a standstill before a new imbalance of power sends the price rocketing in one direction. This dynamic is why the inside bar is such a universal tool—it works across different assets and market conditions, making it a go-to for traders everywhere. You can dive deeper into how this equilibrium works on capital.com.
The inside bar is essentially a low-volatility pocket in the market. It’s this very drop in volatility that often precedes a sharp expansion, which is the breakout that traders are looking to capture.
By learning to read these subtle psychological cues, you stop just seeing shapes on a chart. You start to understand the market’s narrative—the tension, the indecision, and the potential energy building up for the next big move. That deeper understanding is what helps traders anticipate breakouts with much more confidence and precision.
Finding High-Probability Trading Setups
Let’s be honest: not all inside bar patterns are created equal.
While the pattern itself is simple enough to spot, its real power comes from the market environment where it shows up. Think of an inside bar as a tool—it’s only as good as the job you use it for. Trying to trade every single one you see, especially in a choppy, sideways market, is just a fast track to getting chopped up by false signals.
The secret is to get really good at reading the context. This means learning to filter for the high-probability moments and tune out the rest of the noise. When you focus only on inside bars that appear under the right conditions, you seriously stack the odds in your favor.
Luckily, there are two main scenarios where the inside bar pattern really shines. These are the situations where professional traders focus their energy because they offer the highest-quality opportunities.
Inside Bars as Powerful Trend Continuations
One of the most reliable ways to trade an inside bar is as a trend continuation signal.
Picture a market in a strong, obvious uptrend. Prices have been climbing, but eventually, the buying pressure needs to take a breather. This is where buyers pause to catch their breath and consolidate gains, and it’s a perfect spot for an inside bar to form.
This isn’t a sign of a reversal. It’s more like a momentary rest stop before the trend kicks back into gear. It's like a sprinter taking a quick breath mid-race before the final push.
- In an Uptrend: You'll want to see an inside bar form after a strong bullish run. A breakout above the mother bar’s high is your cue that the buyers are back in charge and the uptrend is likely to continue.
- In a Downtrend: On the flip side, in a powerful downtrend, an inside bar shows a temporary pause in the selling. A break below the mother bar’s low tells you the sellers have regrouped and are ready to push prices lower again.
Trading with the dominant trend is a core principle for a reason—it puts the market’s momentum at your back. Combine that with a clean inside bar, and you have a low-risk entry into what could be a very powerful move.
An inside bar in a strong trend is a sign of healthy consolidation, not weakness. It offers a chance to join the trend at a better price, with a clearly defined risk level just on the other side of the mother bar.
Inside Bars as Major Reversal Signals
The second high-probability setup happens when an inside bar pops up at a key support or resistance level. These are the big-money zones where the battle between buyers and sellers gets serious. An inside bar at one of these critical price levels can be a heads-up that a major trend reversal is on the table.
For example, imagine a stock has been tanking for weeks and finally hits a major historical support level. Seeing an inside bar form right there is a huge tell. It shows that the selling momentum has stalled out precisely where a wall of buyers was expected to show up.
Here’s how to read these setups:
- At Major Support: After a downtrend, an inside bar at a key support level suggests the sellers are running out of steam. A breakout above the mother bar’s high can signal the start of a brand new uptrend.
- At Major Resistance: Following an uptrend, an inside bar at major resistance indicates the buyers are losing their nerve. A breakout below the mother bar’s low can be the first sign of a new downtrend.
The combination of the inside bar pattern with a significant price level is potent. It tells you the market’s indecision is happening at a location that actually matters. Focusing on these scenarios is just one of many ways to improve your trading, and you can explore more in our guide covering 8 high-probability trading setups to boost your trading.
Inside Bar Setups Comparison
To put it all together, let's compare these two high-probability scenarios side-by-side. Understanding the subtle differences in what you're looking for and how you approach each trade is key to executing them effectively.
| Feature | Trend Continuation Setup | Reversal Setup |
|---|---|---|
| Market Context | Strong, established trend (uptrend or downtrend). | A key support or resistance level is being tested. |
| What It Signals | A temporary pause or consolidation before the trend resumes. | Potential exhaustion of the current trend and an impending reversal. |
| Ideal Location | Forms mid-trend, often after a strong directional move. | Forms directly at a well-defined horizontal support/resistance zone. |
| Entry Trigger | Breakout in the direction of the original trend. | Breakout in the opposite direction of the preceding trend. |
| Trader's Goal | To join an existing, powerful trend at a low-risk entry point. | To catch the very beginning of a new trend from a major turning point. |
Ultimately, learning to differentiate between inside bars that form in random, choppy markets and those that appear in these two key contexts is what separates disciplined traders from the rest. This selective approach allows you to filter out the weak signals and focus only on the best opportunities the market has to offer.
Actionable Inside Bar Trading Strategies
Spotting an inside bar is one thing, but knowing exactly how to trade it is where theory meets the real world. A solid strategy takes the emotion and guesswork out of the equation, giving you clear rules for your entry, risk, and exit. This is how you turn a simple chart pattern into a repeatable trading plan.
The beauty of the inside bar is its simplicity, and that extends to the strategies built around it. We'll focus on two main approaches: the breakout strategy for catching momentum, and the reversal strategy for capitalizing on trend changes at critical levels. Both hinge on the same core idea: using the mother bar's range to define the trade.

The Classic Inside Bar Breakout Strategy
This is the most direct and common way to trade the pattern, especially when it pops up as a trend continuation signal. The goal is simple: get into the market the moment the price breaks out of the mother bar's range and ride the wave of expanding volatility that follows.
The rules are straightforward and almost mechanical, which makes this a great strategy for traders who prefer a clear, rules-based system. It removes the need to guess the breakout's direction; you just react to what the market does.
Here’s a step-by-step look at how to pull it off:
- Find the Setup: Locate a valid inside bar pattern within a strong, obvious trend.
- Place Entry Orders: Set a buy stop order just a few pips above the mother bar's high and a sell stop order a few pips below its low.
- Wait for the Trigger: As soon as one of your orders gets filled, you immediately cancel the other one. You're in the trade.
This "set and forget" approach ensures you catch the move as it happens, without having to be glued to your screen.
Executing the Reversal Strategy at Key Levels
The reversal strategy requires a bit more finesse but can get you in at the very start of a new trend. This approach works best when an inside bar forms at a major support or resistance level after a long run, hinting that the trend might be running out of gas.
Unlike the pure breakout trade, you aren't just waiting for the price to pierce the mother bar. Instead, you’re looking for confirmation that the level is holding and that momentum is starting to shift.
- At Support: Imagine a downtrend hits a key support zone and an inside bar forms. Instead of just setting a buy order, you might wait for the next candle to break and close above the mother bar's high. This extra step provides stronger proof that buyers are wrestling back control.
- At Resistance: After a strong uptrend, seeing an inside bar at a resistance level is a major warning sign. A confirmed break and close below the mother bar's low can signal that sellers have won the fight and a new downtrend is kicking off.
Waiting for that extra confirmation can save you from "fakeouts"—those frustrating moments when the price pokes through the range only to snap right back inside.
Mastering Your Risk Management
No strategy is worth its salt without ironclad risk management. Thankfully, the inside bar pattern gives you an incredibly clear and logical way to define your risk on every single trade.
The most effective method is to place your stop-loss just beyond the opposite end of the mother bar. For a long trade, the stop goes below the mother bar's low. For a short trade, it goes above the mother bar's high.
This technique neatly contains your risk within a well-defined price structure. You know your exact invalidation point before you even enter, which is the key to precise position sizing and maintaining discipline.
It’s also crucial to think about your timeframe. Inside bar patterns are far more reliable on higher timeframes like the daily chart. Research suggests daily inside bars perform significantly better; one extensive backtest showed that daily signals outperformed hourly ones by a ratio of as much as 10 to 1. Trading on the daily chart often produces cleaner breakouts and much better risk-to-reward ratios, sometimes hitting 1:5 or more, because the stop-loss is proportionally tighter compared to the potential move. You can read more about how daily inside bars beat hourly setups on TradingStrategyGuides.com.
Setting Smart Profit Targets
Once you're in a trade and it's moving your way, the final piece of the puzzle is knowing when to cash out. Here are a few battle-tested techniques for setting profit targets:
- Fixed Risk-to-Reward Ratio: This is a simple but effective method. Aim for a target that's a multiple of your risk. For example, if your stop-loss is 50 pips away, you could set your profit target at 100 pips (2:1) or 150 pips (3:1).
- Next Key Level: Look left on your chart to find the next major support or resistance level. Place your profit target just before that area, as it's a logical spot for the price to stall or reverse.
- Trailing Stop: If you catch a monster trend, a trailing stop-loss lets you ride it for all it's worth. You'll move your stop-loss up (in an uptrend) or down (in a downtrend) as the price moves in your favor, locking in profits along the way.
By combining a clear entry trigger, a defined stop-loss, and a logical profit target, you’ve built a complete trading plan around the inside bar. This disciplined process is what separates consistent traders from those just getting lucky.
Common Questions About the Inside Bar Pattern
Even with a solid game plan, questions always pop up when you start applying a new pattern to live charts. The inside bar is no different. Getting straight answers to the most common sticking points will help you trade with more confidence and sidestep the simple mistakes that can eat away at your account.
Let's tackle some of the most frequent questions traders have about this powerful consolidation pattern.
Which Timeframe Is Best for Trading the Inside Bar Pattern?
You’ll see inside bars on every timeframe, from the frantic 1-minute chart all the way up to the monthly. But they are far more reliable on the higher ones. The daily and weekly charts are where this pattern really shines.
Think about it: a daily inside bar captures an entire day of market indecision. That carries a lot more weight than a brief pause on a 5-minute chart. This significance means you get more powerful breakouts and fewer frustrating false signals. For swing and position traders, sticking to the daily chart is the best way to get consistent results.
What Is the Difference Between an Inside Bar and a Harami?
In practice, there's almost no difference, and you'll hear many seasoned traders use the terms interchangeably. Both patterns show a small candle completely engulfed by the price range of the previous, larger candle.
The main distinction really comes down to their origins:
- Inside Bar: This is a classic Western price action term, where the focus is almost always on the breakout potential after the quiet consolidation.
- Harami: This is a Japanese candlestick term that translates to "pregnant." Traditionally, the Harami is seen more as a potential reversal signal, especially when it shows up after a long, runaway trend.
For trading purposes, you can treat them as the same thing. The name doesn't matter nearly as much as the market context where it appears.
Can I Trade the Inside Bar Pattern in Isolation?
Trying to trade any pattern in isolation is a recipe for disaster, and it's not a professional approach. The inside bar becomes a truly high-probability setup when it forms with other confirming signals—a concept we call confluence. A random inside bar in the middle of a choppy, directionless market is a low-probability gamble.
The best trades happen when an inside bar forms at a significant market level. This could be a major support or resistance zone, a key moving average the market has respected before, or a critical Fibonacci retracement level.
Always check the bigger picture first. An inside bar that lines up with the dominant trend and forms at a key price level is a far better setup than one that just appears out of nowhere.
How Do I Manage Risk When Trading an Inside Bar?
This is one of the best things about the inside bar—it gives you a crystal-clear framework for managing your risk. The most logical way to do this is to place your stop-loss just on the other side of the large "mother bar."
For example, if you take a long trade on a breakout above the mother bar's high, your stop-loss goes just a few pips below the mother bar's low. This immediately defines your maximum potential loss before you even enter the trade. That clarity lets you calculate your position size correctly and helps ensure you’re only taking trades with a healthy risk-to-reward ratio.
Ready to stop searching for patterns manually and start getting real-time alerts? ChartsWatcher provides powerful scanning tools that let you build custom filters to find inside bar setups across thousands of stocks instantly. Find your next high-probability trade with ChartsWatcher today.
