8 high probability trading setups: Boost Your Trading
Unlocking Market Success: Proven Trading Setups
In today's financial markets, characterized by constant change and occasional volatility, identifying high-probability trading setups is crucial for success. Whether you're managing a large institutional portfolio or trading independently, consistent profitability depends on recognizing and capitalizing on recurring market patterns. These patterns, honed through years of market observation and analysis, provide a structured approach to understanding price action, ultimately increasing the chances of profitable trades.
This shift from reactive, intuition-based trading to a proactive, data-driven approach has fundamentally changed how market participants trade. It has paved the way for strategies that prioritize risk management and objective analysis.
Understanding Trading Setups
The effectiveness of a trading setup lies in its ability to provide clear entry and exit points, defined risk parameters, and a solid rationale based on technical or fundamental analysis. These setups, drawing on principles from both classic charting techniques and modern algorithmic strategies, aim to take advantage of predictable market behaviors. These behaviors include breakouts from periods of consolidation, mean reversion tendencies, and reactions to key support and resistance levels. The historical roots of these approaches, tracing back to the work of market pioneers like Charles Dow and Richard Wyckoff, underscore their continued relevance in modern trading.
Eight Powerful Setups for 2025 and Beyond
This guide will explore eight powerful, high-probability trading setups designed to improve your trading performance in 2025 and beyond. You'll learn the core principles behind each setup, how to identify them on charts across different asset classes, and how to incorporate them into your existing trading plan.
- Understanding these setups can provide a significant advantage in navigating the complexities of the market.
- Clear entry and exit points help manage risk and maximize potential profits.
- Identifying recurring patterns allows traders to anticipate market movements.
Whether you're an experienced trader looking to sharpen your skills or a beginner seeking a solid foundation, this guide will provide you with the knowledge and tools you need to identify profitable opportunities and navigate the markets with confidence.
1. Price Action at Key Support and Resistance Levels
This strategy remains a popular choice for traders due to its effective simplicity. It leverages a core market principle: price tends to react predictably at support and resistance levels. By observing candlestick patterns at these points, traders can identify high-probability entries and manage risk effectively.
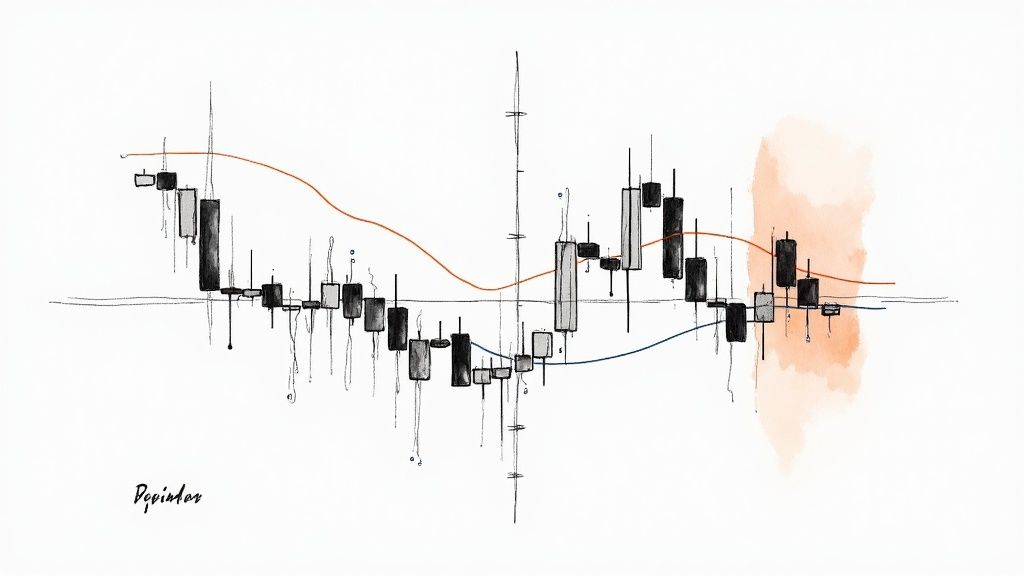
Understanding how these zones function is crucial. Support acts as a price floor, where buying pressure typically surpasses selling pressure. Resistance, conversely, serves as a price ceiling, where selling pressure dominates. Traders look for candlestick patterns at these levels to signal potential reversals or breakouts.
For example, a bullish engulfing pattern at support may indicate an uptrend reversal. A bearish pin bar at resistance could suggest a downtrend continuation. Consider the EUR/USD rejecting the 1.1000 resistance with a pin bar, signaling a potential short. Or Apple stock bouncing off the 200-day moving average with a bullish engulfing pattern, offering a potential long. Even Gold finding support at a previous swing high, marked by a morning star pattern, presents a trading opportunity.
Why This Strategy Remains Popular
Several factors contribute to this strategy's widespread use:
- Simplicity: Traders of all levels can quickly grasp the core concepts.
- Minimal Indicators: Often, only horizontal lines are needed to mark key levels, keeping charts clean.
- Versatility: The strategy applies across various timeframes and markets, from Forex to stocks, commodities, and cryptocurrencies.
For a deeper dive, check out this guide on Price Action Trading Strategies.
Mastering the Approach
Developed by prominent figures like Al Brooks, Steve Nison, and Martin Pring, the strategy combines technical level analysis with candlestick psychology. While conceptually simple, mastering the accurate identification of support/resistance and interpreting candlestick patterns takes practice.
Traders need to be mindful of false breakouts, which can lead to losses. Patience is also vital, as quality setups might not appear frequently.
Implementing the Strategy Effectively
Here are some helpful tips:
- Wait for Candle Closures: Confirm pattern completion before entering trades.
- Multiple Timeframes: Use higher timeframes to validate the strength of support/resistance.
- Volume Analysis: Incorporate volume to confirm signals. Increased volume adds validity.
- Risk-Reward Ratio: Aim for a favorable ratio (e.g., 2:1 or 3:1).
- Stop-Loss Placement: Set stop-loss orders beyond the pattern's high/low to limit risk.
With clear entry and exit points and the potential for high reward relative to risk, this strategy proves valuable for traders. While requiring practice and discipline, identifying and utilizing price action at key support and resistance can substantially improve trading outcomes.
2. Breakout Trading With Volume Confirmation
Breakout trading with volume confirmation is a powerful strategy. It capitalizes on momentum created when an asset's price breaks through resistance or support. This, combined with a surge in trading volume, signals a shift in market sentiment. It also indicates the potential for big price swings. This strategy's place on the list of high-probability trading setups is due to its potential for explosive moves and high win rates when done correctly.
This strategy works on the idea that significant price barriers represent areas of indecision. These barriers can be established through consolidation patterns (like triangles, rectangles, and flags) or key technical levels (like historical highs, moving averages, or trendlines). When these barriers are broken with conviction, and volume increases, it suggests a significant imbalance between buyers and sellers.
Features and Benefits
- Trades the breakout of chart patterns: This lets traders anticipate breakouts and position themselves.
- Requires above-average volume: Volume helps tell the difference between real breakouts and false signals.
- Uses volatility-based position sizing: This risk management technique tailors position sizes based on the asset's volatility.
- Can include trailing stops: Trailing stops help lock in profits as the price moves favorably.
- Often incorporates measured move targets: These targets, based on prior consolidation, provide clear profit objectives.
Real-World Examples
- Bitcoin breaking above $20,000 resistance with 3x average daily volume in 2020: This breakout started a significant bull run.
- Tesla breaking out of a bull flag pattern on earnings announcement with heavy volume: This shows how fundamental events can combine with technical breakouts.
- S&P 500 breaking through the 200-day moving average after prolonged consolidation: This often signals a broader market trend shift.
Historical Context and Popularization
Breakout trading has roots in early technical analysis. Traders like Jesse Livermore saw the importance of price movements beyond key levels. The importance of volume confirmation was later emphasized by figures like Mark Minervini and Thomas Bulkowski. They integrated it into their trading methodologies, helping popularize the strategy.
Pros and Cons
Pros:
- Captures explosive momentum moves early on
- Clear invalidation points for stop placement
- Well-defined profit targets
- Historically high win rates when volume confirms
- Works well in volatile markets
Cons:
- False breakouts common in choppy markets
- Requires fast execution for optimal entry
- May face slippage during fast moves
- Volume analysis can be tricky for beginners
- Not ideal for low-volatility markets
Practical Tips for Implementation
- Wait for the candle to close beyond the breakout level before entering.
- Look for volume at least 1.5x the 20-day average to confirm the breakout.
- Consider a half position on the initial break, adding more on a successful retest.
- Use the Average True Range (ATR) for stop placement to account for volatility.
- Be careful of breakouts during low-liquidity periods.
By understanding breakout trading with volume confirmation, and using these tips, traders can identify and capitalize on potentially profitable opportunities.
3. Mean Reversion With Oversold/Overbought Indicators
This strategy relies on a classic market principle: prices tend to return to their average after significant deviations. This is the core of mean reversion trading. When prices become overbought or oversold, this strategy anticipates a correction back toward the average, making it particularly useful in ranging markets.
To identify these extremes, traders use technical indicators called oscillators. Popular examples include the Relative Strength Index (RSI), Stochastic Oscillator, and Bollinger Bands. An RSI below 30 typically suggests oversold conditions, while an RSI above 70 suggests overbought. Bollinger Bands visually represent price volatility: touching the lower band often signals oversold, while touching the upper band signals overbought.
Mean reversion trading offers potentially strong risk-reward ratios by entering counter-trend positions at extreme price levels. However, it's important to remember that no strategy guarantees profits. In strong trending markets, mean reversion can lead to significant losses.
Features of a Mean Reversion Strategy
- Oscillators for Extremes: Use indicators like RSI, Stochastic, or Bollinger Bands to spot overbought/oversold conditions.
- Divergence Analysis: Look for divergence between price and an oscillator to confirm weakening momentum.
- Trend Awareness: Trade against the short-term trend, but ideally align with the longer-term trend.
- Defined Profit Targets: Use historical reversion distances or support/resistance levels to set profit targets.
- Multiple Timeframes: Analyze across multiple timeframes to confirm the mean reversion potential and filter out false signals.
Pros and Cons of Mean Reversion
| Pros | Cons |
|---|---|
| High probability in range-bound markets | Can lead to significant losses in trending markets |
| Favorable risk-reward ratios | Timing precise entries can be challenging |
| Clear entry and exit parameters | Requires patience waiting for extreme readings |
| Can be automated | Indicators can stay in extreme zones for extended periods |
| Psychological difficulty trading against momentum |
Real-World Examples
- S&P 500 bouncing back after the RSI falls below 30.
- EURUSD reversing after hitting the lower Bollinger Band with a low RSI.
- Apple stock rebounding after closing below the lower Bollinger Band for several days.
Practical Tips
- Confirmation: Look for candlestick patterns and use multiple indicators for confirmation.
- Position Sizing: Scale into positions to manage risk effectively.
- Stop-Loss Orders: Always use stop-loss orders to limit potential losses.
- Market Context: Consider the overall market conditions before trading.
You might be interested in: Our guide on mean reversion strategy tips.
Pioneers of Mean Reversion
Traders like Larry Connors, Linda Raschke, and John Bollinger have significantly influenced the development and popularity of mean reversion strategies.
Mean reversion, with its clear rules and potential for good risk-reward, is a valuable strategy, especially in ranging markets. Though not a perfect solution, it can be a powerful tool when implemented carefully with proper risk management.
4. Inside Bar Breakout Strategy
The Inside Bar Breakout strategy is a popular trading technique known for its simplicity and high probability setups. It centers around a two-bar pattern: the "mother bar" and the "inside bar." The inside bar is a price action bar that forms entirely within the high and low range of the preceding mother bar.

This pattern often suggests a period of consolidation or indecision in the market, which can precede a substantial price move. A breakout from the mother bar's range signals a potential trend resumption or reversal, creating a trading opportunity.
Understanding the Dynamics
Think of the Inside Bar pattern as a coiled spring. The contracting price range of the inside bar reflects decreasing volatility as traders pause and assess the market. These pauses can occur at key points, such as support/resistance levels, or during periods of news anticipation. The breakout signifies a resolution of this indecision, often leading to a strong directional move.
Real-World Examples
Here are some examples illustrating Inside Bar Breakouts:
- GBPUSD (Brexit): Before the Brexit referendum results, the GBPUSD daily chart displayed a prominent inside bar. The following downside breakout marked the beginning of a steep decline for the British pound.
- Gold (Support Level): During a corrective phase, Gold formed several inside bars near a key support level. The eventual breakout above the mother bar signaled a resumption of the bullish trend and sparked a rally.
- Amazon (Earnings Anticipation): Amazon stock often shows inside bar patterns before earnings announcements, reflecting market uncertainty. Breakouts from these patterns can offer insights into post-earnings price action.
Evolution and Popularization
While the concept of price breakouts has been around for a while, traders like Nial Fuller, Alexander Elder, and the Brooks Trading Course have popularized the Inside Bar Breakout as a distinct strategy. Their work has refined pattern identification and developed risk management techniques.
Practical Tips for Implementation
- Trend Alignment: Trade inside bar breakouts in the direction of the prevailing trend. Look for bullish inside bars in an uptrend and bearish inside bars in a downtrend.
- Stop Loss Placement: Place your stop-loss order just beyond the opposite end of the mother bar.
- Confirmation: Wait for the breakout candle to close beyond the mother bar's range for added confirmation. This reduces the risk of false breakouts.
- Key Levels: Inside bars forming at key support or resistance levels tend to have a higher likelihood of leading to big moves.
- Position Sizing: Use the Average True Range (ATR) indicator to manage position size based on the distance to your stop-loss.
Pros and Cons
Pros:
- Clear entry and exit points
- Well-defined stop-loss levels
- Works across various markets
- Signals potential volatility expansion
- High win rate when aligned with the trend
Cons:
- False breakouts can happen, especially in choppy markets
- Requires patience
- Low-volatility patterns can lead to smaller moves
- Requires careful filtering to avoid overtrading
- Risk-reward ratio can fluctuate
Why This Strategy Deserves Its Place
The Inside Bar Breakout strategy is valuable due to its clear setup, defined risk parameters, and high probability outcomes when executed correctly. It offers a structured approach to identifying potential breakouts, making it a useful tool for both new and experienced traders across various markets and timeframes. This strategy demonstrates the value of observing price action and understanding market dynamics.
5. Fibonacci Retracement Confluence Strategy
This strategy uses Fibonacci retracement levels to identify potential reversal zones in the market. These zones are areas where the price might find support or resistance after a significant move. The strategy's power lies in finding "confluence zones"—where Fibonacci levels intersect with other technical indicators or chart patterns. This overlap increases the probability of a reversal, giving traders a more reliable setup than using Fibonacci levels alone.
The Fibonacci Retracement Confluence Strategy is based on the idea that markets often retrace a predictable portion of a previous move before continuing the trend or reversing. These retracements frequently align with key Fibonacci ratios—38.2%, 50%, and 61.8%. By identifying swing highs and lows and using the Fibonacci tool, traders can anticipate potential support and resistance levels. The real strength comes from combining these levels with other technical elements.
Combining Fibonacci Levels With Other Indicators
Think of combining Fibonacci levels with:
- Moving averages
- Trendlines
- Support/Resistance zones
- Candlestick patterns
This confluence acts as a strong confirmation signal. For example, if the EUR/USD retraces to the 61.8% level, which also happens to be the 200-day moving average, it could signal a buying opportunity if the uptrend continues. If the S&P 500 finds support at the 50% retracement level, which also aligns with a previous resistance level now acting as support, it could indicate a bullish reversal. Even volatile markets like cryptocurrency show this pattern; Bitcoin has reversed at the 61.8% retracement level during bull market corrections.
This strategy's popularity is partly due to technical analysts like Scott Carney, known for his work on Harmonic Patterns, and others like Robert Miner and Constance Brown, advocates of Fibonacci analysis in trading. The concept's mathematical foundation, often reflected in market structures, and its applicability across different asset classes and timeframes contribute to its widespread use.
Features and Benefits
- Uses key Fibonacci ratios (38.2%, 50%, and 61.8%) to predict potential reversals
- Offers clear entry and invalidation levels based on price zones
- Works across different timeframes (minutes to weeks) and markets (stocks, forex, commodities)
- Helps find favorable risk-reward opportunities
- Adaptable to trending and ranging markets
- Fibonacci extensions (127.2%, 161.8%) can project profit targets
Pros and Cons
| Pros | Cons |
|---|---|
| Based on mathematical relationships in markets | Subjectivity in choosing swing highs and lows |
| Specific entry/exit points, risk management | Overlapping Fibonacci levels can be confusing |
| Adaptable to various markets and timeframes | Requires practice and experience |
| Identifies high-probability trading setups | Less effective in choppy markets |
| Potential for over-reliance without price action |
Practical Tips for Implementation
- Confirmation is Key: Wait for price action confirmation (like candlestick patterns or breakouts) at Fibonacci levels before entering a trade.
- Prioritize the 61.8%: In strong trending markets, the 61.8% retracement often provides the most reliable reversal points.
- Seek Confluence: Look for at least two or three technical factors converging at the same price zone.
- Tight Stops: Place stop-loss orders just below/above the confluence zone to minimize potential losses.
- Recent Swings for Short-Term: Use recent swing highs and lows when applying Fibonacci for short-term trades.
The Fibonacci Retracement Confluence Strategy is valuable because it provides a structured, mathematically-based approach to identifying high-probability trading setups. By combining Fibonacci levels with other technical indicators, traders can better pinpoint entry and exit points, manage risk, and improve their trading performance.
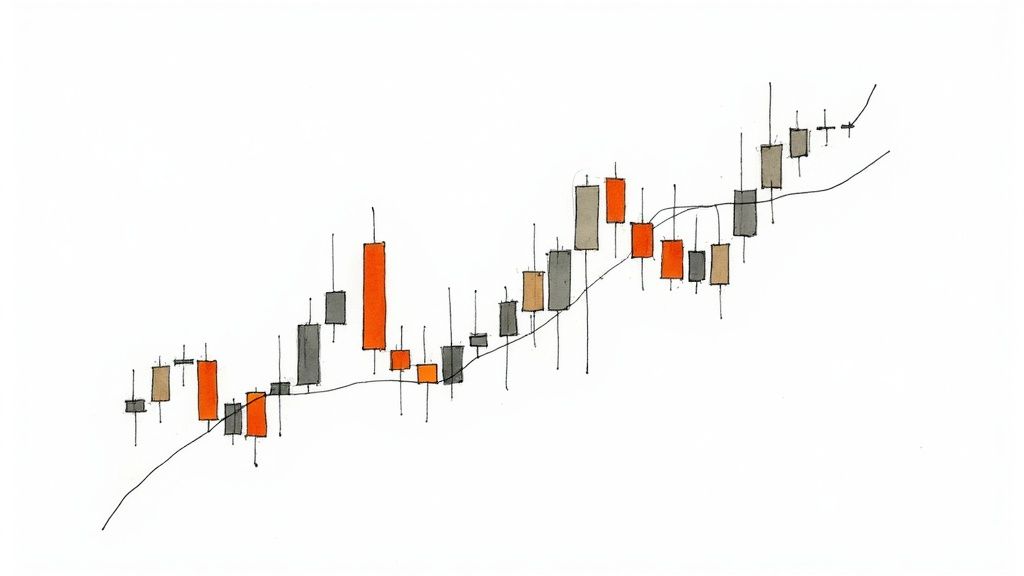
6. Moving Average Crossover With Volume Trends
Moving average crossovers are a common tool in technical analysis. But did you know their effectiveness gets a significant boost when combined with volume analysis? This combined approach, known as "Moving Average Crossover with Volume Trends," helps traders filter out weak signals and identify high-probability trading setups. It does this by confirming crossovers with the corresponding volume activity. This strategy earns its spot as a high-probability setup because it merges the simplicity of moving averages with the power of volume confirmation. The result? A more robust and dependable trading methodology.
How It Works
This strategy uses two or more moving averages (MA) of different periods. A common setup is a faster MA (like the 50-period) and a slower MA (such as the 200-period). A "golden cross" happens when the faster MA crosses above the slower MA. This signals a potential shift towards a bullish trend. On the flip side, a "death cross" occurs when the faster MA crosses below the slower MA, suggesting a potential bearish trend shift.
The crucial element is volume confirmation. A valid golden cross needs increasing volume along with the crossover. This shows strong buying pressure. Likewise, a valid death cross needs increasing volume accompanying the crossover, indicating strong selling pressure. This volume filter helps traders avoid the frustrating whipsaws that can happen with MA crossovers alone.
Features and Benefits
- Trend Identification and Confirmation: The strategy spots potential trend changes and uses volume to verify their strength.
- Multiple MA Combinations: Traders can test different MA periods (like 20/50 or 50/200) to find what works best for various market conditions and timeframes.
- Volume Filters: Traders might use volume moving averages or look at percentage above/below average volume to assess the strength of the volume confirmation.
- Additional Filters: Adding indicators like the Average Directional Index (ADX) can further refine the strategy, targeting strong trends and avoiding sideways markets.
- Versatility: This strategy can be used for swing trading, position trading, and even day trading by adjusting the MA periods and timeframes.
Pros
- Increased Reliability: Volume confirmation boosts the reliability of standard MA crossover signals.
- Objective Entry/Exit Criteria: The strategy offers clear rules for entry and exit points based on crossover and volume conditions.
- Effective for Major Trend Shifts: It effectively captures major trend reversals like golden and death crosses.
- Reduced Whipsaws: Volume filters help to minimize false signals in range-bound markets.
Cons
- Lagging Indicator: MAs are lagging indicators. This means entries and exits might happen after a significant part of the price move has already occurred.
- False Signals in Sideways Markets: Even with volume filters, false signals can still pop up in choppy markets.
- Requires Monitoring Multiple Indicators: Keeping track of multiple MAs and volume indicators can require more attention.
Examples
- The S&P 500's golden cross of the 50-day and 200-day EMAs in 2019, coupled with high volume, signaled a strong bullish run.
- Tesla's 20/50 EMA crossover, often preceded by rising volume, frequently comes before major rallies.
- The 2020-2021 Bitcoin bull market saw several winning trades using 21/55 EMA crossovers confirmed by strong volume spikes.
Tips for Implementation
- Use Exponential Moving Averages (EMAs): EMAs give more weight to recent price data, resulting in more responsive signals.
- Confirmation Candles: Wait for two or three candles to close after the crossover to confirm the signal before entering a trade.
- Combine with RSI: Using the Relative Strength Index (RSI) can offer further confirmation. Look for bullish crossovers with RSI above 50 and bearish crossovers with RSI below 50.
- Scale into Positions: Consider scaling into positions over multiple crossovers on various timeframes to manage risk more effectively.
- Market Regimes: MA crossover strategies work best in trending markets. Avoid using them in extended sideways or choppy markets.
Popularized By
This strategy has roots in the work of technical analysis pioneers like Gerald Appel (creator of the MACD), Richard Dennis (and his Turtle Traders), and Stan Weinstein (Stage Analysis). Their work emphasized the importance of trend following and the value of using multiple indicators for confirmation.
By combining moving averages with volume, traders can significantly improve their odds of successful trades and capture substantial market moves. While not a perfect system, the Moving Average Crossover with Volume Trends strategy offers a valuable framework for finding and taking advantage of high-probability trading opportunities.
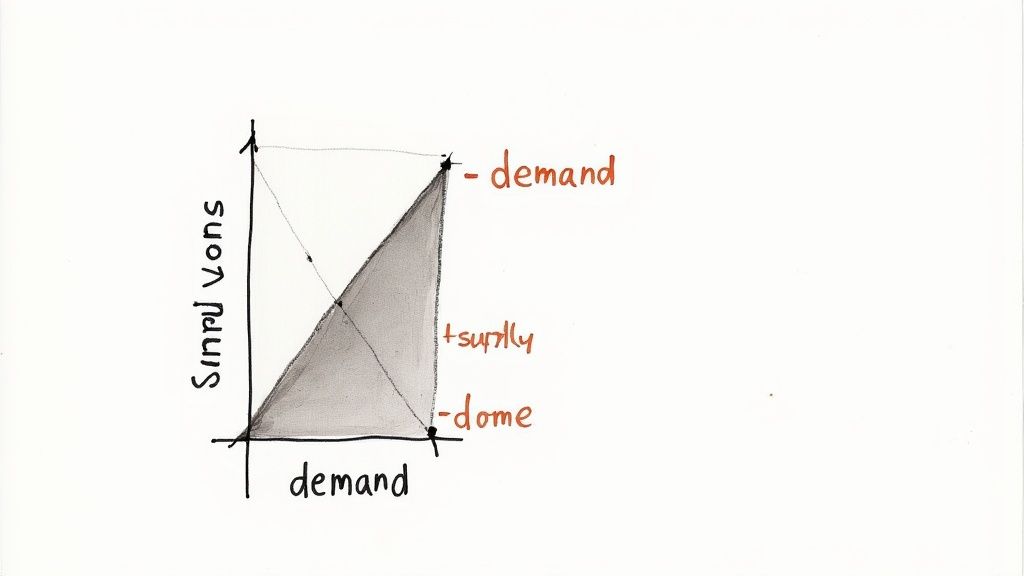
7. Supply and Demand Zone Trading
Supply and Demand Zone Trading sets itself apart by focusing on identifying real institutional order flow. It offers high-probability trading setups with clear entry and exit points. Unlike strategies based on indicators, this method emphasizes understanding the forces of supply and demand that truly move prices. It locates specific areas on a chart where substantial buying or selling imbalances have happened, creating "zones" that can act as strong support or resistance levels when revisited. This makes it a powerful tool for professional traders, analysts, and serious investors looking for an advantage in the market.
How It Works
The core principle revolves around finding areas where the price has moved sharply away from a relatively tight period of consolidation. A rapid upward movement suggests aggressive buying (demand), creating a potential demand zone. A sharp downward move indicates strong selling (supply), creating a potential supply zone. These sudden movements often represent how institutions accumulate or distribute assets.
This strategy doesn't rely on lagging indicators. Instead, it prioritizes raw price action. When the price returns to these zones, traders view it as an opportunity to enter a trade. They anticipate a similar imbalance between buyers and sellers to push the price in the initial direction of the zone's formation.
Key Features and Benefits
-
Focus on Sharp Price Movements: The clearest supply and demand zones come from quick, decisive price changes. These are often driven by major news, earnings releases, or substantial institutional orders.
-
Untested Zones Are Key: "Fresh" zones that haven't been retested hold the most potential. They represent areas where significant unfilled orders might still exist.
-
Candlestick Analysis at Zone Tests: Examining candlestick patterns when the price returns to a zone can provide extra confirmation of potential reversals. Strong bullish reversals at demand zones and bearish reversals at supply zones make the setup even stronger.
-
Time-Based Factor: More recent zones (formed within the last few candles/sessions) generally carry more weight than older ones.
-
Zone Strength Classification: Several types of zones exist, such as base, rally-base-rally (RBR), and drop-base-drop (DBD). Each offers different degrees of anticipated support or resistance.
Real-World Examples
-
Bitcoin (2021): Bitcoin established a significant demand zone around $30,000 after a sharp decline. When the price revisited this zone, it resulted in strong bounces, ultimately pushing Bitcoin to new all-time highs.
-
EUR/USD (Post-ECB Announcement): A supply zone formed in EUR/USD after a hawkish announcement from the European Central Bank. This zone acted as strong resistance, keeping the price contained for months after the initial movement.
-
Apple Stock (Market Correction): After a market-wide correction, Apple stock rallied significantly from an untested demand zone, highlighting the potential of these levels.
Pros & Cons
Pros:
- Relies on actual market order flow, not lagging indicators.
- Provides specific entry and stop-loss levels.
- Applicable across different markets and timeframes.
- Can offer favorable risk-reward ratios (3:1 or better).
- Aligns with institutional trading behavior.
Cons:
- Requires experience reading charts to identify valid zones.
- Some subjectivity exists in zone identification and evaluating strength.
- Zones weaken with multiple retests.
- Demands patience waiting for the price to return to identified zones.
- Beginners might mistake zones for regular support/resistance levels.
Practical Tips for Implementation
-
Patience is Key: Wait for the price to enter the zone and show clear rejection before entering a trade. Don't try to anticipate the zone.
-
Proper Stop Placement: Set stop-loss orders just beyond the zone boundary, adding a small buffer for potential volatility.
-
Time-Based Considerations: Untested zones formed within the last 1-3 candles/sessions tend to be strongest.
-
News and Events: Look for zones created by significant news or earnings releases for higher probability setups.
-
Trend Alignment: Concentrate on zones aligned with the larger trend for increased probability.
Popularity and Influencers
Supply and Demand zone trading gained traction through educators like Sam Seiden, ICT (Inner Circle Trader), and proponents of "Smart Money Concepts." These individuals have systematized the methodology and brought it to a wider audience.
Why It Deserves a Place in the List
Supply and Demand Zone Trading provides a solid framework for finding high-probability trading setups rooted in real market dynamics. By understanding these principles, traders can anticipate potential turning points and enter trades with well-defined risk management. This makes it an invaluable tool for any serious trader seeking a consistent edge.
8. Failure Test Strategy (False Breakout Trading)
The Failure Test Strategy, also known as False Breakout Trading, takes a contrarian approach. It focuses on the impatience and sometimes incorrect assumptions of other market participants. Essentially, it capitalizes on the tendency for price to "fake out" traders. This happens when the price briefly breaks a key support or resistance level, trapping traders in losing positions before aggressively reversing in the opposite direction. This creates exciting trading opportunities with defined risk and potentially significant rewards.
This strategy relies on identifying "trapped traders." Let's say the EUR/USD has strong support around 1.2000. Breakout traders, expecting a drop below this level, might short the pair as it briefly dips below 1.2000. If this break lacks real momentum, buying pressure can quickly reappear, trapping those short-sellers. As the price reverses upward, these traders are forced to cover their positions, which pushes the price even higher. This can lead to substantial and swift price swings.
How It Works
The Failure Test Strategy focuses on observing price action at crucial levels. These levels are typically:
- Round Numbers: These are psychological levels like 1.2000 in EUR/USD or 40,000 in Bitcoin.
- Significant Moving Averages: For example, the 200-day moving average can act as strong support or resistance.
- Trendlines: These lines represent established uptrends or downtrends.
The key is to look for specific candlestick patterns at these levels. Patterns like pin bars or engulfing patterns can signal rejection after a brief breakout. Confirming a failed breakout is critical. Waiting for a candle close beyond the breakout level before entering a trade helps avoid getting caught in a real breakout. Stop-loss orders should be placed just beyond the extreme of the false breakout to minimize potential losses.
Pros and Cons
Pros:
- Tight Stop-Loss Placement: This allows for excellent risk-reward ratios.
- Capitalizes on Trapped Traders: Their forced exits fuel the move in your favor.
- Clear Entry Criteria: Entries are based on objective price action.
- Effective in Manipulated Markets: Especially relevant in forex and crypto where "stop hunting" is prevalent.
- Strong Momentum Moves: These often occur with minimal retracement.
Cons:
- Timing Challenges: False breakouts can develop rapidly.
- Constant Monitoring: Requires vigilance at key levels.
- Psychological Difficulty: It can be tough to trade against apparent breakouts.
- Experience Needed: Discerning false breakouts from pullbacks requires practice.
- Potentially Lower Win Rate: However, the average winning trade can be larger.
Real-World Examples
- EUR/USD: A false breakout might involve the pair briefly dipping below 1.2000 support before quickly reversing higher.
- S&P 500: An example could be the index failing to stay below the 200-day moving average during a correction, leading to a rally.
- Bitcoin: A false breakout might occur above all-time highs, followed by a significant price drop.
Tips for Implementation
- Candle Close Confirmation: Wait for the candle to close beyond the breakout level before entering.
- Tight Stop-Loss: Place stop-loss orders just beyond the false breakout's extreme point.
- Volume Divergence: Look for decreasing volume during the initial breakout, which can signal weakness.
- Higher Timeframes: These often provide higher-probability setups.
- Limit Orders: Using limit orders at key levels can help anticipate false breakouts.
Popularity and Evolution
The concepts behind false breakouts have likely been understood by traders for a long time. However, the formalization of the strategy is often credited to traders like Victor Sperandeo, Grady Styles, and Al Brooks. They emphasized price action and market context in spotting these opportunities. The Failure Test Strategy, with its clear rules and potential for significant returns, remains a valuable tool for traders across various markets and timeframes. By grasping the psychology behind false breakouts and using these techniques, traders can improve their ability to identify and profit from these market inefficiencies.
High Probability Trading Setups: 8-Strategy Comparison
| Strategy | Complexity 🔄 | Resources 💡 | Outcomes 📊 | Use Cases ⚡ | Advantages ⭐ |
|---|---|---|---|---|---|
| Price Action at Key Support and Resistance Levels | Low to moderate; requires experience in reading chart levels | Minimal indicators; basic chart and candlestick analysis | ~65-75% success when risk managed | Works in both trending and ranging markets | Clear entry/exit points; defined risk parameters |
| Breakout Trading with Volume Confirmation | Moderate to high; quick execution and volume assessment needed | Volume indicators and pattern recognition tools | ~70-80% follow-through with volume confirmation | Volatile markets with institutional participation | Captures explosive moves with clear targets |
| Mean Reversion with Oversold/Overbought Indicators | Moderate; combining multiple oscillator readings | RSI, Bollinger Bands, and other oscillators on multi-timeframes | 75-80% in range-bound; lower in trending markets | Range-bound markets; corrective phases | High reward-to-risk; clear, indicator-based entries |
| Inside Bar Breakout Strategy | Low; visually identifiable pattern simplifies implementation | Price charts focusing on candlestick formations | Win rates can increase to 70-75% when aligned with trend | Trending markets with consolidation phases | Objective entries; well-defined stops |
| Fibonacci Retracement Confluence Strategy | Moderate to high; subjectivity in selecting swing points | Fibonacci tools and additional technical indicators for confluence | ~70-75% success when multiple factors align | Trending or ranging markets with clear confluence zones | Identifies precise reversal zones with favorable risk-reward |
| Moving Average Crossover with Volume Trends | Moderate; involves monitoring crossovers and volume filters | Multiple moving averages and volume data for confirmation | ~65-70% success with proper filtering and confirmation | Swing or position trading in trending market regimes | Objective signals; captures major trend shifts |
| Supply and Demand Zone Trading | High; requires advanced chart reading and zone identification skills | Detailed charting tools to locate and validate supply/demand zones | ~75-80% in pristine zones with confluence factors | Markets where institutional order flow is evident; any timeframe | Specific entry levels; superior risk/reward structure |
| Failure Test Strategy (False Breakout Trading) | Moderate to high; timing precision is critical | Candlestick pattern recognition and order flow analysis | ~60-65% win rate with high average reward ratios | Highly liquid markets with clear support/resistance | Tight stop placements; exploits false breakouts for strong reversals |
Mastering High-Probability Trading: A Path to Consistent Profits
This article explored eight high-probability trading setups. We covered classic strategies like price action at key support and resistance levels and breakout trading with volume confirmation. We also delved into more nuanced approaches, such as Fibonacci retracement confluence and failure test strategies. Other setups included mean reversion with oversold/overbought indicators, inside bar breakout strategies, moving average crossovers with volume trends, and the increasingly popular supply and demand zone trading. Understanding these setups can give you a real advantage in spotting potential trading opportunities.
However, simply recognizing these patterns isn't the key to success. Consistent profits require a more comprehensive approach. This involves sticking to strict risk management principles, thoroughly backtesting your strategies, and constantly refining your approach based on market feedback. As you work with these strategies, concentrate on the subtleties of each setup. Learn the underlying market dynamics that drive these patterns and how they interact with broader market trends.
Financial markets are constantly shifting, so adaptability is essential. Continuous learning and staying ahead of the curve are vital. Keeping up with emerging trends, such as algorithmic trading and the growing influence of artificial intelligence, will be key to future success. Also, refining your understanding of market sentiment, economic indicators, and geopolitical events will improve your decision-making process.
Key Takeaways
- Master the Nuances: Each setup has its own intricacies. Don't just identify the pattern; understand the context.
- Risk Management is Paramount: Protect your capital by implementing robust risk management strategies.
- Adapt and Evolve: Markets change constantly. Continuous learning and adaptation are essential for long-term success.
- Stay Ahead of the Curve: Keep an eye on developing trends and future advancements in the financial markets.
To truly benefit from these high-probability setups and confidently navigate market complexities, you need the right tools. ChartsWatcher is a stock market scanning software designed for professional traders. With features like customizable dashboards, real-time alerts, powerful backtesting capabilities, and flexible multi-screen configurations, ChartsWatcher gives you the tools to analyze market movements effectively and make informed trading decisions. Visit their website to learn more and choose the plan that suits your trading style.
