Mean Reversion Strategy: Expert Data-Driven Trading Tips
Breaking Down Mean Reversion Like a Pro
Mean reversion trading works on a simple principle: asset prices tend to move back to their average over time. While many traders understand this basic concept, successfully trading mean reversion requires much more than just theory. Let's explore how experienced traders put this strategy into practice to generate consistent returns.
Identifying True Mean Reversion Opportunities
Finding genuine mean reversion setups goes beyond just spotting price deviations. Smart traders examine multiple confirming signals and market conditions before taking positions. They analyze key factors like price volatility, trading volumes, and broader market sentiment. This comprehensive view helps distinguish real opportunities from false signals that could lead to losses.
Beyond the Basics: Real-World Applications
Success with mean reversion comes from practical application, not just understanding the theory. Top traders adapt their approach based on specific market conditions and asset types. They know that what works for stocks may not work for commodities or forex. Take Warren Buffett for example - his value investing strategy shares elements with mean reversion, as he buys quality companies when they're temporarily undervalued. Learn more about this strategy at the Corporate Finance Institute.
Why Some Traders Succeed and Others Fail
Like any trading method, mean reversion demands discipline and market knowledge. The traders who profit consistently tend to share certain traits. They have strong analytical skills, manage risk carefully, and patiently wait for the right setups. Those who struggle often lack these qualities and make impulsive trades, leading to inconsistent results. Having a solid trading plan and sticking to it makes a huge difference.
Key Takeaways for Mean Reversion Trading
- Look beyond price: Analyze multiple factors to confirm real reversion opportunities
- Stay flexible: Adjust your strategy for different markets and conditions
- Control risk: Use proper position sizing and stop losses
- Keep learning: Markets change constantly - successful traders evolve with them
Master these core elements and you'll be better equipped to profit from mean reversion trading while managing your risk exposure.
Mastering Technical Tools That Actually Work
Essential Mean Reversion Indicators
Let's explore the key technical indicators that form the foundation of successful mean reversion trading. Here's a comparison of the most effective tools:
| Indicator | Purpose | Best Use Case | Limitations |
|---|---|---|---|
| Moving Averages | Identifies dynamic support/resistance levels | Spotting potential reversal points | Lag in fast-moving markets |
| Bollinger Bands | Shows price volatility and extremes | Finding overbought/oversold conditions | Can give false signals in trends |
| RSI | Measures momentum and price velocity | Confirming extreme market conditions | Works best in ranging markets |
| Mean Reversion Metrics | Calculates deviation from average | Statistical probability analysis | May miss fundamental shifts |
Each of these tools serves a specific purpose in identifying potential mean reversion opportunities. The key is understanding how to apply them effectively.
Building Your Technical Foundation
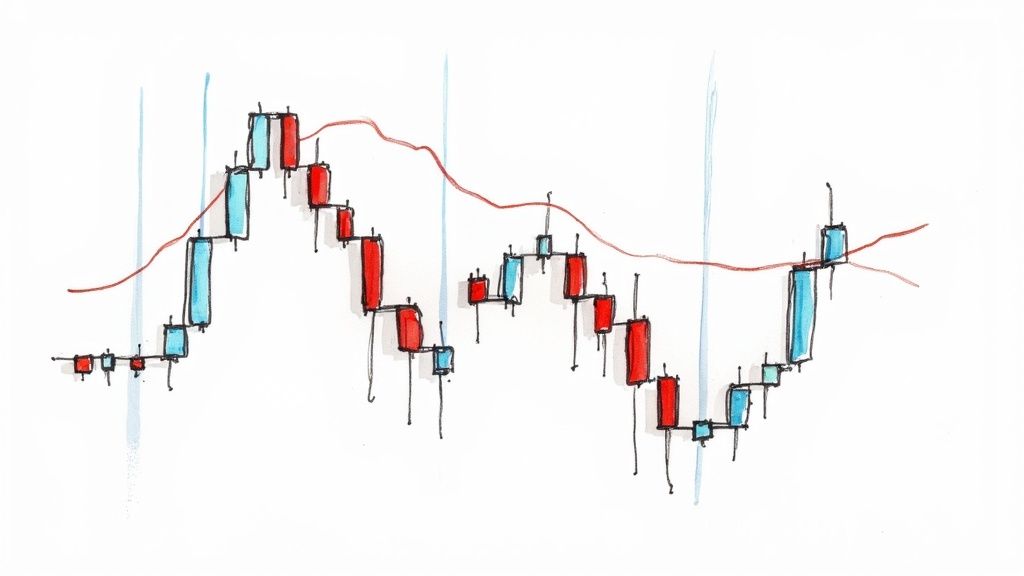
Moving averages act as dynamic levels where prices tend to reverse. When an asset moves far from its average, it often signals a potential return. Bollinger Bands expand and contract with volatility, providing visual cues for extreme price moves that may reverse.
The Relative Strength Index (RSI) measures price momentum on a scale of 0-100. Readings above 70 typically indicate overbought conditions, while readings below 30 suggest oversold conditions. These extremes often precede price reversals. Learn more about using these indicators effectively: How to master overbought and oversold indicators.
Mean reversion strategies rely on the tendency of prices to return to their average over time. For a deeper understanding of the statistical principles behind this concept, check out this overview of mean reversion in finance).
Combining Tools for Better Results
Using multiple indicators together creates a more reliable trading system. For example, when price hits the upper Bollinger Band while RSI shows overbought conditions above 70, it provides a stronger signal than either indicator alone. The goal isn't to use every available tool, but to select complementary indicators that work well together.
Common Technical Analysis Mistakes
Over-relying on indicators is a common error. Remember that these tools help identify opportunities but don't guarantee outcomes. Another frequent mistake is curve fitting - adjusting indicator settings to perfectly match past data. This often fails in live trading. Focus instead on developing flexible strategies that work across different market conditions.
Creating Your Technical System
The most effective technical approach matches your personal trading style and risk tolerance. Some traders prefer quick mean reversion trades, while others take a longer-term view. Your technical framework should include specific rules for:
- Entry criteria
- Exit points
- Position sizing
- Risk management
Example: Mean Reversion Trade Setup
Consider this scenario: A stock trading above its 200-day moving average suddenly spikes higher, touching the upper Bollinger Band while RSI reads above 70. This combination suggests an overbought condition that may soon reverse. It demonstrates how multiple indicators can work together to identify potential trading opportunities.
Remember that mastering technical analysis takes time and practice. Stay focused on continuous improvement and refining your approach based on real trading experience.
Reading Market Conditions Like a Master

Success with mean reversion requires more than just technical knowledge - it demands a deep understanding of market behavior. Top traders know how to adapt their approach based on current conditions rather than blindly following a strategy. This includes spotting ideal opportunities, adjusting parameters, and stepping aside when needed.
Identifying Optimal Trading Conditions
Mean reversion works best in specific market environments. Range-bound markets, where prices move within clear boundaries, create perfect conditions as prices reliably bounce between support and resistance. However, strong trending markets can quickly lead to losses with mean reversion strategies. Your first task is identifying the current market environment by studying price movement, volatility patterns, and broader market direction. For more background, check out Investopedia's guide to Mean Reversion.
Adapting Your Strategy
After assessing market conditions, you can fine-tune your approach. In sideways markets, consider tighter stops and smaller profit targets. For example, try adjusting Bollinger Bands to use narrower standard deviations for more precise reversal signals. The RSI indicator can help confirm overbought and oversold levels within the trading range.
In trending markets, it's often wise to reduce position sizes or pause mean reversion trading entirely. Forcing counter-trend trades during strong moves typically leads to multiple losses. Stay flexible and be ready to switch tactics as conditions change - whether that means moving to trend-following methods or waiting for clearer ranges to form.
Recognizing Warning Signs and Contingency Plans
Even excellent strategies face challenges. Smart traders know no approach works perfectly all the time, so preparation for potential issues is key. Watch for warning signs like multiple stopped-out trades or consistent losses, as these may signal shifting market dynamics.
Having clear backup plans is crucial. This could mean adjusting stop distances, trading smaller sizes, or temporarily stepping away. Setting specific rules ahead of time helps avoid emotional decisions during volatile periods.
Learning From Success and Failure
Review both winning and losing trades to improve your skills. Study what worked in profitable positions and understand what went wrong with losses. This analysis reveals valuable patterns about market behavior and helps refine your mean reversion methods. For instance, you might discover reliable indicator combinations for certain assets or learn important lessons about ignoring key warning signs. Regular trade reviews lead to better strategy development and execution over time.
Statistical Testing That Drives Real Results
Building a solid mean reversion trading strategy requires more than just spotting price swings. You need concrete statistical evidence to confirm that price movements represent genuine reversions rather than random market behavior. This demands going deeper than basic chart analysis to examine the statistical properties of assets.
Validating Your Mean Reversion Strategy
Testing your strategy against historical data is essential before putting real money at risk. This process, known as backtesting, helps identify potential issues and fine-tune your approach. While backtesting can be complex, the right tools make it manageable. ChartsWatcher provides robust backtesting capabilities with accurate historical data and adjustable parameters. You might also be interested in: How to backtest a trading strategy.
The Power of Statistical Tests
Statistical tests give you a clear framework to evaluate your strategy's performance. The Augmented Dickey-Fuller (ADF) test stands out as a key tool for determining if a price series truly exhibits mean reversion. This helps confirm whether an asset genuinely returns to its average price or just moves randomly.
Mean reversion testing often employs mathematical models like the Ornstein-Uhlenbeck process to analyze price behavior. This model differs from random walks by accounting for price history. Learn more about statistical mean reversion testing.
Avoiding False Signals: The Importance of Stationarity
Stationarity is crucial for reliable mean reversion trading. A stationary price series maintains steady average values and variation over time. The ADF test helps determine if your target asset shows this key trait. For instance, if a stock consistently returns to its average price after moving away, it may be stationary. Without stationarity, spotting real mean reversion becomes much harder.
Applying Statistical Tests in Practice
Putting these tests to work requires good software tools. ChartsWatcher makes this straightforward with its user-friendly interface and built-in statistical functions. Traders can quickly run tests like ADF to find truly mean-reverting assets and avoid misleading signals. This helps build data-backed strategies that rest on solid statistical evidence.
Conquering Multiple Markets With One Strategy

The real power of mean reversion trading comes from its ability to work across different markets. Instead of limiting yourself to just stocks, you can apply these techniques to bonds, currencies, and commodities. But success requires understanding how each market behaves differently and adjusting your approach accordingly.
Identifying Opportunities Across Markets
The key first step is finding markets where mean reversion works best. Currency pairs tend to work well since they often bounce between average exchange rates over time. More volatile assets like small-cap stocks may require extra care and stronger risk controls. Focus on markets that clearly demonstrate mean-reverting behavior based on their historical price patterns.
The timeframe you choose matters a lot. Short-term trading in volatile stocks could lead to getting whipsawed with losses. A longer-term approach focusing on stable assets like bonds often provides better opportunities. Take time to test different holding periods in each market.
Mean reversion isn't just for stocks - it's widely used in forex trading to profit from currency pairs returning to their average rates. Tools like the RSI and stochastic oscillator help spot overbought and oversold conditions. Learn more about mean reversion applications on Yieldstreet. Understanding these nuances helps you adapt across markets.
Let's look at how mean reversion compares across major asset classes:
| Asset Class | Key Indicators | Typical Timeframe | Success Factors |
|---|---|---|---|
| Stocks | RSI, Bollinger Bands | 1-5 days | High liquidity, clear price ranges |
| Forex | Moving averages, RSI | Hours to days | Strong historical averages |
| Bonds | Yield spreads, ratios | Weeks to months | Stable relationships |
| Commodities | Seasonal patterns, inventories | Weeks to months | Supply/demand drivers |
Managing Correlation and Building a Diversified Portfolio
Diversification is crucial for managing risk with mean reversion strategies. Trading across different markets can create a more balanced portfolio. But watch out for correlations - if two markets move together, problems in one could hurt the other. Proper diversification requires selecting markets that don't move in lockstep.
Practical Guidelines for Market Selection and Portfolio Balancing
- Market Research: Study each market's volatility patterns, liquidity levels, and price behavior thoroughly
- Indicator Selection: Pick technical tools that match the specific market and timeframe
- Risk Management: Use proper position sizing and stop losses to protect your capital
- Correlation Analysis: Check how different markets relate to ensure true diversification
- Regular Review: Monitor conditions and adjust your approach as markets change
By carefully selecting markets that fit mean reversion principles and following these guidelines, you can build a diversified portfolio that targets consistent returns while keeping risks in check. This systematic approach gives you the best chance of success across multiple markets.
Building Your Risk-Smart Trading System
Success with mean reversion trading requires solid risk management practices. It's not about hoping trades work out - you need a systematic approach to protect your money while maximizing potential profits. Let's look at the key elements that help traders consistently make money over time.
Position Sizing: The Cornerstone of Risk Control
How much money you put into each trade makes a huge difference. Most traders use a fixed percentage approach - risking 1-2% of their account per trade. For example, with a $10,000 account and 1% risk, you'd lose a maximum of $100 if a trade goes against you. You can also adjust position sizes based on how volatile each asset is.
Stop-Loss Strategies: Protecting Your Capital
Stop-loss orders automatically close trades at preset price levels to limit losses. You can use fixed stops at specific prices or trailing stops that move with price action. The tricky part is setting them right - too close and you'll get stopped out early, too far and you risk bigger losses.
Let's say you buy a stock at $50 with a stop at $48. That means you're willing to risk $2 per share. This kind of clear risk definition helps you trade mean reversion setups without blowing up your account. Take time to carefully plan stop placements based on the specific stock and market conditions.
Portfolio Management: The Big Picture
Smart portfolio management means spreading your risk across different investments. Don't put all your eggs in one basket. For instance, trading both stocks and bonds provides balance since they often move opposite each other. You might also combine mean reversion with other trading methods.
Risk Assessment Tools and Techniques
Several tools can help you evaluate trading risk. Backtesting shows how your strategy would have performed historically. Stress testing reveals potential worst-case scenarios. Software like ChartsWatcher offers extensive backtesting capabilities for mean reversion strategies.
Practical Steps for Building Your Risk System
- Define your risk tolerance: Know your maximum acceptable loss level
- Develop a position sizing strategy: Use consistent rules for trade size
- Implement stop-loss orders: Set protective stops on every trade
- Diversify your portfolio: Spread risk across different markets
- Monitor and adjust: Review and improve your approach regularly
Good risk management turns mean reversion from theory into a reliable trading method that can generate consistent profits over time.
Want to take your mean reversion trading to the next level? ChartsWatcher provides advanced tools to find opportunities, manage risk, and improve your results. Check out the platform today.
