Top Overbought and Oversold Indicators for Traders
Understanding Overbought and Oversold Markets
For most traders and investors, finding the right moments to enter and exit positions is essential for success in the financial markets. By identifying when a market is overbought or oversold, traders can spot potential price reversals before they happen. This knowledge provides a major advantage, since buying during oversold conditions and selling during overbought periods often leads to better returns.
The tools for detecting overbought and oversold conditions have come a long way since technical analysis first emerged. Today's traders can choose from a wide array of technical indicators and screening tools that help identify these key market conditions. While many tools exist, knowing which ones work best for your trading style and market environment makes all the difference.
What makes indicators effective at finding overbought and oversold levels? The best tools provide clear signals, react quickly to price changes, and work well across different market conditions. While no indicator can predict market moves with complete certainty, using a carefully selected combination of tools can significantly improve your trading decisions. Whether you focus on day trading or longer-term investing, understanding these core concepts will help you make more informed choices about market entries and exits.
1. Relative Strength Index (RSI)
The Relative Strength Index (RSI) is a popular momentum indicator created by J. Welles Wilder that helps traders identify potential market turning points. Operating on a scale from 0 to 100, RSI measures how quickly prices are moving to spot overbought and oversold conditions.
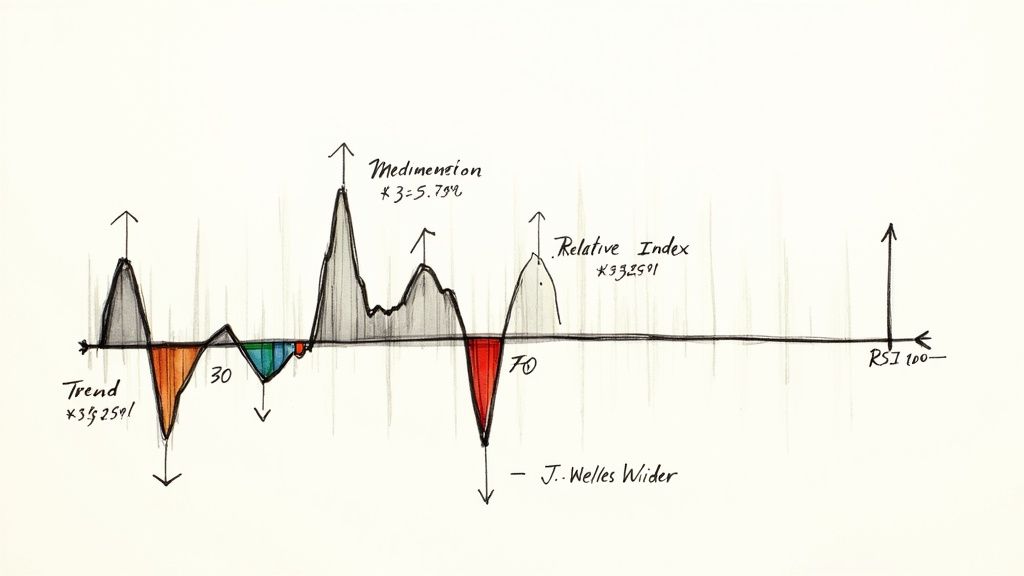
The standard RSI uses a 14-period calculation. Readings above 70 typically suggest an overbought market that may be due for a pullback, while readings below 30 indicate oversold conditions that could lead to a bounce. However, these levels serve more as warning signs rather than definitive trading signals.
Key Features:
- Simple Overbought/Oversold Scale: Easy-to-read 0-100 scale helps spot extreme market conditions
- Trend Strength Analysis: Shows how powerful price moves are in either direction
- Divergence Signals: Spots differences between price action and momentum that can signal reversals
- Multi-Timeframe Use: Works on any chart timeframe from minutes to months
Real Trading Example:
Consider a stock in an uptrend making new highs. If the RSI starts making lower highs while staying above 70, this bearish divergence suggests momentum is weakening. Traders might use this signal to reduce long positions or look for short opportunities.
Advantages:
- Reliable in Range-Bound Markets: Excellent at finding turning points when prices move sideways
- Simple to Read: Clear numerical values make interpretation straightforward
- Flexible Across Markets: Effective on stocks, forex, crypto and other assets
Limitations:
- Can Give False Signals: During strong trends, RSI can stay overbought/oversold for long periods
- Delayed Signals: As a lagging indicator, RSI reacts to price changes after they occur
Tips for Using RSI:
- Combine with Other Tools: Use RSI alongside trend analysis and other indicators
- Watch for Divergences: Pay attention when price and RSI move in opposite directions
- Adjust Your Settings: Consider using shorter periods for more signals or longer for fewer false alarms
- Test Different Strategies: Practice with historical data to see how RSI performs in various conditions
Want to learn more about technical analysis? Check out Technical Analysis Indicators Explained: Unlock Market Trends.
The RSI remains one of the most used technical tools because it helps traders spot potential market reversals through a clear, simple interface. While it works best as part of a complete trading approach, its ability to identify overbought and oversold conditions makes it valuable for traders at any experience level.
2. Stochastic Oscillator
The Stochastic Oscillator is a key technical analysis tool that shows potential overbought and oversold conditions in a security's price. It works by comparing a security's closing price to its price range over a set timeframe. This comparison reveals price momentum and can signal upcoming trend changes by showing where current prices sit within their recent trading range.
Created by George Lane in the late 1950s, this indicator has become essential for many traders. Lane noticed that price momentum often shifts before actual price changes occur. The indicator tracks this by measuring where closing prices fall within recent trading ranges - consistent closes near range highs suggest strong buying, while closes near lows indicate heavy selling.
The indicator uses two main lines: %K (fast) and %D (slow), which move between 0 and 100. Values above 80 typically show overbought conditions, while readings below 20 suggest oversold conditions. However, these levels serve as alerts rather than direct trading signals.
Features:
- Two Signal Lines: %K tracks immediate momentum while %D smooths the data for clearer signals
- Fixed Range: The 0-100 scale makes overbought/oversold levels easy to spot
- Multiple Versions: Fast and Slow variations suit different trading approaches
- Customizable Periods: Adjust calculation periods from 14 to 21 days or longer
Pros:
- Early Warning System: Often spots potential reversals before price charts show them
- Works Well in Range-Bound Markets: Provides reliable signals when prices move sideways
- Multiple Signal Types: Offers crossovers, divergences and overbought/oversold readings
- Timing Tool: Helps identify market cycle tops and bottoms
Cons:
- Less Reliable in Trends: Can give false signals during strong price trends
- Learning Curve: Takes time to understand the calculations and proper usage
- Noisy Signals: Can produce unclear readings in high-volatility conditions
Tips for Implementation:
- Combine with Trend Tools: Use moving averages or trendlines to filter signals and trade with the main trend
- Look for Divergences: When price and oscillator move in opposite directions, it often signals a coming reversal
- Use Longer Timeframes: Extended periods reduce false signals from short-term price swings
- Add Moving Averages: Apply them to smooth the indicator and confirm potential trades
The Stochastic Oscillator offers practical insights into market momentum and potential turning points. By understanding its strengths and limits while following best practices, traders can make more informed decisions. However, like any technical tool, it works best as part of a complete trading approach rather than in isolation.
3. MACD Histogram
The Moving Average Convergence Divergence (MACD) histogram is a powerful way to spot overbought and oversold market conditions. While it builds on the popular MACD indicator, the histogram format provides unique insights into price momentum and potential market turning points by showing the gap between the MACD line and its signal line.
The MACD histogram helps identify market extremes through its visual format. When the histogram shows very high positive values, it often means buying pressure is starting to fade - a potential overbought signal. On the flip side, deeply negative readings can indicate selling pressure is running out of steam, suggesting oversold conditions. Keep in mind these signals aren't fixed levels and need to be viewed in context of the broader trend.
Key Features:
- Momentum Strength: Bar size shows how strong or weak the price momentum is
- Clear Visual Signals: Easy to spot divergences and trend changes
- Zero-line Crossovers: Signals potential momentum shifts when crossing above/below zero
- Multi-Timeframe Analysis: Using different time periods helps confirm trade signals
Real Example: Picture a stock making new highs while the MACD histogram forms lower highs - this bearish divergence warns of weakening momentum despite rising prices. The opposite is also true - if price makes new lows but the histogram shows higher lows, it could signal a bullish reversal opportunity.
Background: Created by Gerald Appel in the late 1970s, the MACD and its histogram caught on with traders because it blends trend following with momentum readings in an easy-to-read format.
Usage Tips:
- Watch Extreme Readings: Very high or low histogram values often mark potential reversals
- Look for Divergences: When price and histogram move in opposite directions, it can signal trend changes
- Check Multiple Timeframes: Analyzing different time periods helps confirm signals
- Combine with Price Action: Don't trade solely on histogram signals - use them alongside price analysis
Advantages:
- Merges trend and momentum analysis
- Shows signals clearly
- Works well in trending markets
- Good for spotting divergences
Disadvantages:
- Lags behind price
- No set overbought/oversold levels
- Can be late with signals
Want to learn more about finding market trends? Check out our Complete Guide to Finding Hidden Opportunities.
The MACD Histogram stands out for its unique approach to identifying market extremes. While not meant to be used alone, it excels at visualizing momentum shifts and highlighting divergences - making it valuable for both professional and individual traders. When combined with other technical tools and price analysis, it helps create a fuller picture of market conditions.
4. Williams %R
The Williams %R is a powerful momentum indicator created by Larry Williams to spot overbought and oversold market conditions. This indicator works similarly to the Stochastic Oscillator but is plotted in reverse, measuring where the current close sits relative to the high-low range over a period (usually 14 bars). The indicator oscillates between 0 and -100, with key levels at -20 (overbought) and -80 (oversold).
The Math Behind Williams %R:
The formula is straightforward: %R = (Highest High - Close) / (Highest High - Lowest Low) * -100
Where:
- Highest High = Peak price in the lookback period
- Lowest Low = Bottom price in the lookback period
- Close = Current closing price
A reading of 0 shows price closed at the period's high, while -100 means it closed at the period's low. Values above -20 suggest overbought conditions that may lead to a pullback. Readings below -80 indicate oversold conditions that could spark a bounce.
Real Trading Examples:
Take a stock moving in a range - when price climbs near resistance and Williams %R rises above -20, that overbought signal might present a short opportunity if price starts turning down. Similarly, when price drops to support and Williams %R falls under -80, traders may look to buy in anticipation of a rebound.
Remember that no indicator predicts the future with certainty. Use Williams %R alongside other technical tools for better results.
Historical Context:
Larry Williams shared this indicator in his 1973 book "How I Made One Million Dollars Last Year Trading Commodities." Its ability to identify key market turning points has made it a favorite among technical traders ever since.
Key Trading Tips:
-
Look for Confirmation: Don't trade based solely on Williams %R. Wait for supporting signals from price action, volume, or other indicators. A bearish candlestick pattern with an overbought reading makes a stronger case for selling.
-
Consider the Trend: Williams %R works well with trend indicators like moving averages. An oversold reading during an uptrend can signal good buying spots.
-
Check Multiple Timeframes: Looking at Williams %R across different time periods gives better context. A weekly uptrend plus oversold daily readings can highlight swing trade entries.
-
Watch for Divergence: When price makes new highs/lows but Williams %R doesn't follow, it may signal a coming reversal. Bullish divergence shows up when price makes lower lows but Williams %R makes higher lows.
Benefits:
- Spots reversals early
- Easy to calculate
- Clear signal levels
- Suits swing trading
Drawbacks:
- False signals in choppy markets
- Extreme readings during strong trends
- Needs trend confirmation
The Williams %R stands out among momentum tools for its clear signals and simple math. Used properly within a complete trading approach, it can help pinpoint key market turning points and improve trade timing.
5. Commodity Channel Index (CCI)
The Commodity Channel Index (CCI) is a powerful momentum indicator created by Donald Lambert that helps traders identify potential market reversals and trend strength. While initially developed for commodity markets, it has proven highly effective across stocks, forex, and other financial instruments.
At its core, the CCI compares the current price to an average price over time, showing how far prices have moved from their average. The indicator oscillates above and below a zero line, without being confined to specific upper or lower limits.
Key CCI Components:
- Zero Line: The baseline representing average price levels
- Positive Values: Show prices trading above average, indicating buying pressure
- Negative Values: Show prices trading below average, indicating selling pressure
Main Benefits:
- Clearly shows when prices move too far from average levels
- Helps identify trend strength and potential market turns
- Works effectively across different markets and timeframes
- Strong trends often show sustained readings above +100 or below -100
Advantages:
- High adaptability across various markets
- Reliable for finding market turning points
- Multiple uses beyond just overbought/oversold signals
Limitations:
- Takes time to understand the calculations
- Can produce occasional false signals
- Requires practice to interpret effectively
Trading Tips:
- Use +100 and -100 as key overbought/oversold levels for potential reversals
- Watch for zero line crossovers to spot momentum shifts
- Combine with moving averages for stronger trade signals
- Note extreme readings that may signal trend exhaustion
Real Trading Example:
A stock trending higher sees its CCI move above +100, suggesting overbought conditions. The price then starts moving sideways and eventually turns lower, validating the CCI signal. Similarly, during a sharp decline, the CCI drops below -100. When price finds support and the CCI crosses back above -100, it presents a possible buying opportunity.
Growth in Popularity:
The CCI has earned widespread adoption because it consistently helps traders identify key market turning points and confirm trend strength. While it started in commodities, its proven track record across all markets has made it a go-to tool for many traders.
By mastering the CCI's signals and combining it with other analysis tools, traders can make more informed decisions. Though it takes time to fully understand, the CCI's ability to highlight important market shifts makes it worth the learning investment for serious traders.
6. Money Flow Index (MFI)
The Money Flow Index (MFI) is a momentum indicator that combines both price and volume data. Think of it as a volume-weighted cousin of the RSI that tracks money inflow and outflow from a security. It helps traders spot oversold and overbought conditions by looking at how strongly money moves in and out.
How MFI Works:
The MFI moves between 0 and 100. It looks at typical price (the average of high, low, and close) along with volume to calculate money flow ratios. When typical price goes up, that's positive flow. When it drops, that's negative flow. The indicator typically uses a 14-day period to generate its readings.
Key Features and Benefits:
- Volume Insight: By factoring in volume, MFI offers a deeper view than price-only tools like RSI. This helps filter out fake signals when price moves without strong volume backing.
- Clear Reversal Signals: Readings above 80 suggest overbought conditions, while below 20 points to oversold. These often mark potential trend changes.
- Divergence Spotting: When price and MFI move in opposite directions, it can signal upcoming reversals. A rising price with falling MFI often warns of weakness ahead.
- Best for Active Stocks: MFI shines when analyzing stocks or ETFs with steady, high trading volume.
Pros:
- Validates price moves with volume data
- Reliable reversal indicators
- Strong at finding divergences
- Most effective on high-volume securities
Cons:
- Not ideal for thinly traded securities
- Can be noisy in sideways markets
- Complex calculations make manual tracking difficult
Real-World Example:
Picture a stock making new price highs while its MFI reading drops lower. This divergence hints that buying momentum is weakening despite higher prices. Smart traders might see this as a signal to reduce long positions or consider shorting.
Historical Context:
Gene Quong and Avrum Soudack developed the MFI. It gained followers because it added volume analysis to traditional overbought/oversold signals, giving traders a fuller market view.
Practical Tips for Implementation:
- Double-Check Signals: Use MFI alongside price analysis and other indicators for confirmation
- Watch Key Divergences: Pay attention when price and MFI move in opposite directions
- Monitor Volume: Make sure overall volume trends support what MFI shows
- Look for Extremes: Consider using 90/10 levels for stronger overbought/oversold signals
Why MFI Matters:
MFI earns its spot in this list by combining price and volume data into one clear momentum gauge. This dual approach helps traders and investors better identify market turning points. When used properly, MFI can improve trading decisions by showing both price movement and the conviction behind it.
7. Bollinger Band %B
The Bollinger Band %B takes the classic Bollinger Bands and makes them more precise for traders looking to spot overbought and oversold conditions. It shows exactly where price sits within the bands as a percentage, making it easier to identify extreme moves and potential reversals.
The calculation is simple: %B = (Price - Lower Band) / (Upper Band - Lower Band)
This gives you a value that typically moves between 0 and 1. When %B goes above 1, price has moved above the upper band (overbought). Below 0 means price is under the lower band (oversold). At 0.5, price sits right at the middle band - usually a simple moving average.
Understanding and Application
What makes %B special is how it adapts to changing market conditions. During high volatility when bands are wide, a price spike might not hit extreme %B levels - suggesting more room to run. But in quiet markets with narrow bands, even small moves can push %B to extremes, hinting at a possible reversal.
Real Examples
Take a stock trading sideways. Good news hits and price jumps, pushing %B above 1. This flags it as overbought and warns of a potential pullback. Or picture a falling stock where panic selling drives %B below 0. This oversold reading could signal a bounce is coming. While basic examples, they show how %B helps spot key turning points.
History and Adoption
John Bollinger developed %B to add more precision to his famous bands. While the bands give a visual guide to volatility and extremes, %B puts hard numbers to these relationships. This makes it perfect for systematic trading strategies and screening tools, driving its popularity with professional traders.
Tips for Using %B
-
Follow the Trend: Don't use %B alone. An overbought reading in an uptrend often means a brief pause, not a major reversal. An oversold reading in a downtrend could signal more downside ahead.
-
Watch Extreme Readings: When %B moves far beyond 1 or 0, pay attention. These rare signals pack extra power when backed by other indicators.
-
Consider Volatility: A %B of 0.8 means different things in calm vs choppy markets. Always view readings in context.
-
Use With Other Tools: Combine %B with indicators like BandWidth for a complete view of price action and volatility.
Key Benefits
- Adjusts to market volatility
- Clear reference levels at 0 and 1
- Works in trending markets
- Great for mean reversion trading
Drawbacks
- Can be slow in fast markets
- Requires understanding of statistics
- More complex calculations needed
Why It Made The List
The Bollinger Band %B brings mathematical precision to volatility analysis. With its self-adjusting levels, clear signals, and wide applicability, it's a vital tool for serious traders. By turning visual band analysis into hard data, it fits perfectly into modern systematic trading approaches used by professionals and institutions.
8. DeMarker Indicator
The DeMarker Indicator helps traders spot potential market turning points by examining recent price highs and lows. Created by market expert Thomas DeMark, this tool measures price momentum and exhaustion by comparing current price levels to previous ones. This makes it especially useful for finding good entry and exit points.
Key Mechanics:
The indicator moves between 0 and 1, analyzing differences between current and previous price highs/lows over a set period (usually 14 bars). When readings go above 0.7, markets may be overbought, while readings below 0.3 suggest oversold conditions.
Main Features:
- Fixed Range: The 0-1 scale provides clear reference points for trading decisions
- Price Focus: By tracking highs and lows, it captures important momentum shifts
- Trend Strength: Helps measure how much power is left in a price move
- Clear Signals: The 0.7 and 0.3 levels offer specific action points
Advantages:
- Quick Response: Reacts faster to price changes than many other indicators
- Reversal Detection: Particularly good at spotting when trends are running out of steam
- Multi-Timeframe: Works well on both short and long-term charts
- Direct Signals: Clear overbought/oversold levels remove guesswork
Drawbacks:
- False Readings: Like all indicators, can give incorrect signals in choppy markets
- Limited Availability: Not as widely available as RSI or Stochastics
- Needs Backup: Should be used with other indicators, not alone
Real Example:
Picture a stock in a strong uptrend. The DeMarker climbs above 0.7 showing overbought conditions. At the same time, the price forms a bearish evening star pattern and volume drops off. These aligned signals suggest it may be time to take profits or consider shorting.
Usage Tips:
- Level Setting: Start with standard 0.7/0.3 levels but adjust based on the asset and market conditions
- Watch Divergences: Look for times when price and indicator move in opposite directions
- Follow Trends: Focus on overbought signals in uptrends and oversold in downtrends
- Multiple Views: Check multiple timeframes for better confirmation
The DeMarker stands out for its ability to catch potential reversals early by tracking recent price extremes. While it has limitations and can generate false signals, when combined with other analysis tools and proper risk management, it becomes a powerful addition to any trading approach. It's especially helpful for traders and analysts seeking early signs that a trend may be ending.
Overbought & Oversold Indicators: 8-Point Comparison
| Indicator | Implementation Complexity 🔄 | Expected Outcomes 📊 | Ideal Use Cases ⚡ | Key Advantages ⭐ | Tips 💡 |
|---|---|---|---|---|---|
| Relative Strength Index (RSI) | Simple | Identifies momentum, overbought/oversold conditions, divergences | Ranging markets, multi-timeframe analysis | Clear, easy-to-interpret signals | Use trend confirmation; adjust periods based on timeframe |
| Stochastic Oscillator | Moderate | Provides early reversal signals and momentum insights | Ranging markets; cycle identification | Early signals with multiple confirmation | Combine with trend indicators; watch for divergences |
| MACD Histogram | Moderate | Combines trend and momentum; highlights divergence signals | Trending markets; multi-timeframe analysis | Clear visual cues with momentum strength | Look for extreme histogram values; confirm with price action |
| Williams %R | Simple | Detects overbought/oversold conditions using an inverted scale | Swing trading; momentum measurement | Simple calculation with clear level demarcations | Wait for confirmation; use with trend indicators |
| Commodity Channel Index (CCI) | Complex | Measures price deviation and cyclical turns | Multi-market analysis; trend strength evaluation | Versatile indicator for cycles and trends | Monitor zero-line crossovers; combine with moving averages |
| Money Flow Index (MFI) | Moderate | Provides volume-weighted overbought/oversold signals and divergences | High-volume securities; divergence detection | Volume confirmation aiding reversal signals | Use price confirmation; watch volume trends and divergences |
| Bollinger Band %B | Complex | Indicates price position relative to volatility bands | Trending markets; mean reversion strategies | Adapts to volatility with clear reference points | Use with trend analysis; consider volatility context |
| DeMarker Indicator | Moderate | Identifies trend exhaustion with clear overbought/oversold levels | Multi-timeframe analysis; trend sustainability checks | Less lag with clear, actionable signals | Apply 0.7/0.3 levels; verify with divergence and trend analysis |
Mastering Overbought and Oversold Indicators
Understanding how to use overbought and oversold indicators can help identify critical market turning points. Common tools like the Relative Strength Index (RSI), Stochastic Oscillator, MACD, Williams %R, and other oscillators reveal when an asset's price has moved too far in one direction. These signals often precede price corrections or reversals, though they should not be used in isolation.
Each indicator has unique characteristics you'll want to master. For example, the RSI uses 70 and 30 as key levels, while the Stochastic works with 80 and 20. However, these default settings can be adjusted based on the specific asset and market conditions. The best approach combines these indicators with other tools like trend analysis, support/resistance levels, and volume studies to build a complete trading view.
Success requires ongoing practice and refinement of your strategy. Test different indicators and settings to find what aligns with your risk tolerance and trading goals. Backtesting your approach using historical data shows how the indicators perform in various conditions. Stay alert to how market volatility and news events impact indicator readings, and be ready to adapt your methods as markets change.
Key Points to Remember:
- Overbought/oversold signals help spot potential reversals
- Use multiple indicators together for better confirmation
- Test and adjust your approach to match market conditions
- Keep learning and refining your trading methods
Take your technical analysis to the next level with ChartsWatcher. This professional-grade platform offers comprehensive tools for tracking markets, testing strategies, and getting real-time alerts. From customizable dashboards to advanced filters, ChartsWatcher gives you everything needed to spot opportunities and make informed trading decisions.
