How to Identify Market Trends: A Complete Guide to Finding Hidden Opportunities
Unlocking Profit Potential with Chart Patterns
Reading market charts is a vital skill for any day trader looking to succeed. These visual price patterns help traders identify market opportunities and make profitable trading decisions. The ability to spot and interpret chart patterns has been an essential trading tool for generations, with classic formations like head and shoulders and triangles consistently helping traders navigate markets.
Success with chart patterns requires three key elements: understanding the core principles behind each pattern, combining pattern analysis with other technical indicators, and dedicating time to practice pattern recognition. The study builds on time-tested concepts from Dow Theory and other foundational market analysis frameworks that recognize how price movements tend to repeat themselves.
This guide will walk you through 8 powerful chart patterns that every day trader should know. You'll learn how to identify these patterns, understand what they signal about future price movement, and effectively use them in your trading strategy. Whether you're just starting out or have years of experience, mastering these essential patterns will help you spot emerging trends earlier, make smarter entry and exit decisions, and ultimately improve your trading results.
1. Bull Flag Pattern
The Bull Flag is a powerful price pattern that day traders rely on to spot potential upward price movements. It shows up as a brief pause during an uptrend, giving traders a chance to enter before the next move higher. Many traders favor this pattern because it has clear rules and a good track record of success.

The pattern has two main parts:
- Flagpole: A sharp upward price move that shows strong buying pressure and sets the trend direction
- Flag: A period where price moves sideways in a channel between parallel lines, like a flag shape. Volume typically drops during this consolidation phase before the next move up.
Bull Flags usually form over 1-4 weeks, though you can spot them on shorter timeframes too. The best patterns have a slight downward tilt in the flag portion, showing sellers getting absorbed by buyers. Studies suggest these patterns work about 75% of the time, though no pattern is guaranteed.
Real-World Examples:
We've seen the Bull Flag work beautifully in major market moves. When Bitcoin broke above $20,000 in December 2020, it formed a textbook Bull Flag first. Tesla showed several Bull Flags during its 2020 rally, giving traders multiple chances to profit from the uptrend. These cases show how the pattern works across different markets and timeframes.
Pros:
- High Success Rate: Historical data shows good reliability
- Clear Entry Points: The break above the flag gives a precise entry signal
- Defined Risk Levels: The lower trendline provides a natural stop-loss point
Cons:
- Look-Alike Patterns: Can be confused with bearish setups if not careful
- False Breaks: Some breakouts fail to follow through
- Waiting Game: The consolidation phase requires patience to avoid early entries
Tips for Implementation:
- Check Volume: Look for higher volume on the breakout as confirmation
- Place Stops: Put your stop loss just under the flag's bottom line
- Watch the Slope: Slightly downward-sloping flags tend to work better
- Follow the Trend: Trade these patterns in the direction of the main trend
For more ways to spot profitable trades, check out our guide on 10 Best Day Trading Indicators: A Complete Guide To Profitable Trading. Adding other indicators to confirm Bull Flag signals can help boost your trading results.
2. Double Bottom Pattern
The Double Bottom pattern is one of the most effective reversal patterns that signals a shift from downward to upward price movement. Both new and seasoned traders rely on this pattern because it offers clear entry points and measurable profit targets.

Formation and Identification
This pattern emerges at the end of a downtrend. The price drops to a support level, rebounds, then tests that same support level again - creating two bottoms. Between these bottoms is a peak that forms the "neckline." The pattern is complete when price breaks above this neckline level.
Key Features:
- Two Bottoms: These should be at roughly equal price levels, though small differences are normal
- Bottom Shape: Can be rounded (suggesting steady reversal) or V-shaped (indicating sharp reversal)
- Volume: Often decreases during second bottom formation, then jumps during breakout
- Neckline: Acts as key resistance - breaking above confirms the pattern
Real-World Example
Consider a stock at $50 that drops to $40, bounces to $45, falls back to $40, then climbs above $45. With strong volume on the breakout above $45, this confirms a Double Bottom pattern.
Price Target Projection
To find the profit target, measure from the bottom to neckline and add this to the breakout point. Example: If bottoms are at $40 and neckline at $45, the target would be $50 ($45 + $5).
Pros:
- Strong Signal: High probability of trend change
- Clear Targets: Easy to set profit objectives
- Visual Pattern: Simple to spot on price charts
Cons:
- Time Investment: Can take weeks to form
- Breakout Required: Pattern needs neckline break to confirm
- False Signals: Price can break out then reverse
Trading Tips:
- Watch Volume: Strong volume confirms breakouts
- Calculate Targets: Use pattern height for objectives
- Study Bottom Type: Rounded bottoms often more reliable
- Check Multiple Timeframes: Confirm pattern across different time periods
Historical Context
Technical analysts like Thomas Bulkowski and John Murphy helped establish the Double Bottom as a core chart pattern. While the basic rules remain unchanged, modern charting tools have made pattern identification more precise.
Understanding this pattern's details helps traders spot potential reversals and make smarter trading decisions. Remember to use proper risk management and combine with other indicators for best results.
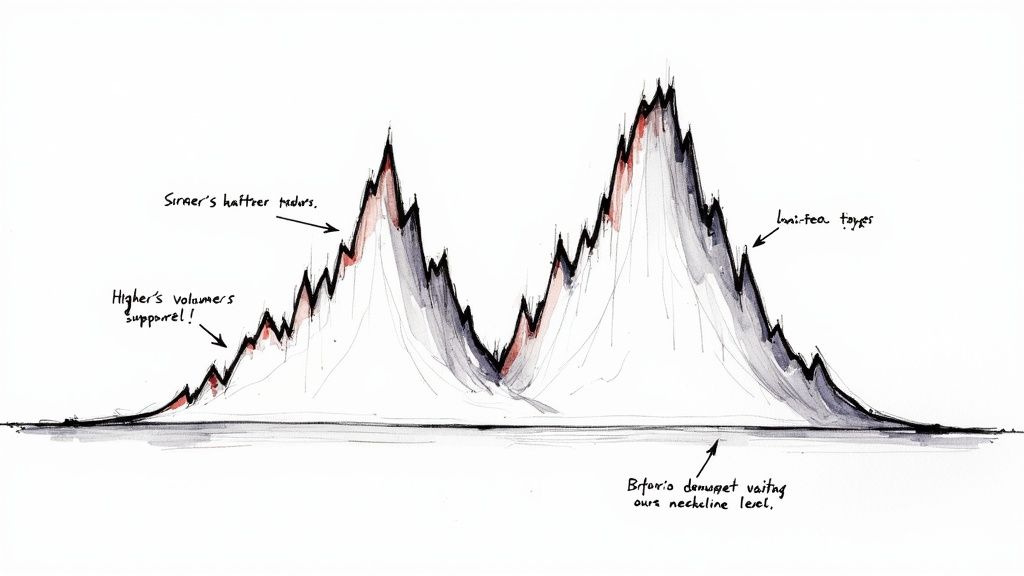
3. Head and Shoulders Pattern
The Head and Shoulders pattern is a powerful chart formation that helps traders spot potential market reversals. When this pattern appears at the end of an uptrend, it often signals an upcoming downward price movement. Many professional traders rely on it because it provides clear entry points and measurable targets.
The pattern's name comes from its visual resemblance to a person's head and shoulders. It forms with three peaks - two lower peaks of similar height (the shoulders) with a higher peak between them (the head). Drawing a line connecting the low points creates the "neckline," which helps confirm the pattern and set price objectives.
Key Features:
- Three Distinct Peaks: Two shoulders at similar heights and one higher head
- Neckline: Support line connecting the troughs between peaks
- Volume Pattern: Should decrease during formation, showing weakening upward momentum
- Shoulder Balance: More reliable when shoulders are symmetrical
Advantages:
- Strong Track Record: Shows high reliability when confirmed by neckline break
- Clear Price Targets: Offers specific objectives based on pattern measurements
- Risk Management: Allows precise stop-loss placement above the neckline
Limitations:
- Time Investment: Can take weeks or months to fully develop
- False Signals: Pattern can fail if volume confirmation is lacking
- Learning Curve: Requires practice to identify and trade effectively
Trading Guidelines:
- Wait for Confirmation: Enter short positions only after clear neckline break with strong volume
- Watch Volume Trends: Look for declining volume during formation and increased volume on breakdown
- Calculate Targets: Measure head-to-neckline distance and project down from breakdown point
- Protect Position: Set stop-loss just above neckline
Historical Background:
This pattern gained widespread recognition through Robert D. Edwards and John Magee's 1948 book "Technical Analysis of Stock Trends." Their work established the Head and Shoulders as an essential trading tool that continues to guide traders today.
Pattern in Action:
Consider a stock that rises to new highs (left shoulder), pulls back, then pushes even higher (head). After another pullback, it makes one final push that fails to reach the previous high (right shoulder). When price breaks below the neckline connecting the lows, it confirms the pattern and suggests more downside ahead.
Why Traders Value This Pattern:
The Head and Shoulders pattern earns its place among top trading tools through its blend of reliability, measurable targets, and clear risk management levels. While mastering it takes time and practice, its ability to identify major market turns makes it valuable for traders at all experience levels. Learning to spot and trade this pattern effectively can significantly improve your market timing skills.
4. Cup and Handle Pattern
The Cup and Handle pattern is a bullish continuation pattern that predicts when a previous uptrend will likely resume after a period of price consolidation. This pattern stands out for its strong predictive power in bull markets, predictable price targets, and usefulness across all trading timeframes. As the name suggests, it forms a "U"-shaped cup followed by a shorter "handle" consolidation before breaking out higher.
The pattern typically develops over 7 to 65 weeks, with prices pulling back 12% to 33% during the cup phase. The handle represents one final shakeout of weak holders before the uptrend continues. This consolidation builds up buying pressure needed for the eventual breakout.
The Cup and Handle was made famous by William O'Neil and his publication Investors Business Daily. Their research proved it to be a reliable signal of upcoming bullish moves. A notable example was Netflix's stock in 2009, which formed a textbook Cup and Handle before a major rally. This and many other cases documented by O'Neil's team helped establish the pattern as a key analysis tool.
Key Elements of a Valid Cup and Handle:
- U-shaped cup: Look for smooth, rounded bottoms rather than V-shapes, indicating steady price recovery
- Shorter handle phase: Handle should retrace less than half the cup's depth and form more quickly
- Lower handle volume: Trading activity should decrease during handle formation
- Clear breakout: Price must decisively break above handle resistance with increased volume
Benefits:
- High success rate in bull markets for predicting upward moves
- Easy to calculate targets by measuring cup depth from breakout point
- Works on any timeframe from daily to monthly charts
Drawbacks:
- Takes time to form - may not suit short-term traders
- Pattern recognition skills needed to identify valid setups
- Similar to other patterns like rounding bottoms, causing potential confusion
Trading Tips:
- Focus on smooth, rounded cup bottoms
- Confirm handle retraces under 50% of cup depth
- Watch for declining volume in handle
- Wait for strong breakout on high volume
Want to learn more about chart patterns and technical analysis? Check out How to Read Stock Charts: The Complete Guide for Beginner Investors for a thorough introduction to reading charts and improving your trading approach.
5. Ascending Triangle Pattern
The Ascending Triangle is a reliable and widely used chart pattern in day trading. It shows up during upward price movements and suggests the trend will keep going up. Once you know how to spot this pattern, you can find good entry points for trades with solid profit potential.
The pattern has two main lines that come together: a flat top line (resistance) and a rising bottom line (support). The flat top shows where sellers keep stepping in to stop prices from rising further. The rising bottom line reveals buyers stepping in at higher and higher prices, forming a triangle shape.
Key Features:
- Flat Upper Line: Shows where prices repeatedly hit resistance
- Rising Lower Line: Connects higher price lows as buying increases
- Volume Drops During Formation: Trading activity usually decreases as the pattern develops
- Time to Form: Takes about 1-3 months typically, but varies by timeframe
Benefits:
- Strong Success Rate: When properly identified, these patterns often lead to profitable breakouts
- Clear Price Targets: You can estimate likely price moves by measuring the triangle's height
- Easy Risk Management: Stop-loss levels are simple to set below the support line
Drawbacks:
- Takes Time: Pattern needs patience to fully develop
- False Signals: Sometimes prices break out briefly then reverse
- Requires Discipline: Important to wait for confirmation before entering trades
Real Examples:
- Apple (AAPL): Showed this pattern before breaking $100 in 2020
- Amazon (AMZN): Displayed similar formation in Q2 2021 before major rally
Trading Tips:
- Look for Volume: A spike in trading volume helps confirm real breakouts
- Use the 2/3 Rule: Consider trades when price reaches two-thirds up the triangle
- Set Smart Stops: Place stop-loss orders just under the support line
- Measure Targets: Project moves by adding triangle height to breakout point
The Ascending Triangle works well because it gives clear signals and defined risk levels. While no pattern is perfect, using this setup along with good risk management can help traders spot profitable opportunities in rising markets.
6. Wedge Pattern
The Wedge Pattern is one of the most practical chart patterns for spotting market reversals. It's made up of two lines that come together at a point, creating a shape that looks like a wedge. Traders love this pattern because it gives them clear signals for entering and exiting trades.
Let's break down the two main types of wedge patterns:
-
Rising Wedge: You'll see two upward-sloping lines, with the bottom line rising more gradually than the top one. This usually means prices are about to drop, as buying momentum starts to fade.
-
Falling Wedge: Both lines point downward, but the top line falls more steeply. This often signals that buyers are quietly building positions, suggesting prices might soon rise.
Key Elements of a Wedge Pattern:
- Lines That Meet: The two boundary lines must come together
- Lower Trading Volume: As the pattern forms, you'll typically see fewer trades
- Time to Form: Most wedges take 3-4 weeks to develop
- Narrowing Price Range: The space between the lines gets smaller until they meet
Benefits:
- Works on Any Time Frame: From 5-minute charts to monthly views
- Easy to Spot Entry Points: The breakout direction shows you when to trade
- Clear Stop Levels: You can set precise exit points based on pattern boundaries
Drawbacks:
- Look Similar to Triangles: You need practice to tell them apart
- Not Always Reliable: Market conditions affect how well they work
- Timing is Tricky: False moves can trap traders too early or make them miss good trades
Real Examples:
- S&P 500 in Early 2020: A rising wedge appeared before the March crash
- Gold's Price Action in 2021: A falling wedge showed up before prices jumped higher
Trading Tips:
- Follow the Breakout: Buy when prices break above a falling wedge, sell when they break below a rising wedge
- Check Volume: Look for more trades when the breakout happens
- Don't Wait Too Long: Trade when you see a clear breakout, not at the very end
- Use Other Tools: Check indicators like RSI or MACD to back up your trades
As trading software has become more common, more traders have started using wedge patterns. Better charting tools have made these patterns easier to find and trade. While no pattern works every time, wedge patterns can help improve your trading results when used with good risk management.
7. Symmetrical Triangle Pattern
The Symmetrical Triangle is a vital chart pattern that day traders use to spot potential breakout opportunities. It shows a market consolidation period where neither buyers nor sellers dominate, usually leading to the trend continuing in its original direction. Traders value this pattern for its reliability and clear price targets.
The pattern forms when you draw lines connecting lower highs and higher lows, creating a triangle shape as the price range narrows. The key is that both trendlines slope at about the same angle, making it different from ascending or descending triangles. A valid pattern needs at least two highs and two lows and typically takes 1-3 months to form. Trading volume usually drops during this consolidation.
Key Characteristics:
- Two converging trendlines with matching slopes
- Declining volume as pattern forms
- 1-3 month formation period
- Minimum of two peaks and two valleys
Advantages:
- Pattern stays neutral until breakout, enabling objective trading plans
- Works on multiple timeframes - from hourly to weekly charts
- Clear price targets based on triangle height
Disadvantages:
- Breakout direction unknown until it happens
- Pattern can take a while to complete
- False breakouts can trigger losing trades
How It Works: The pattern reflects a struggle between buyers and sellers, with both sides gradually losing momentum. As the price range tightens, it shows market indecision. A breakout signals one side has won, and the price often continues the previous trend.
Example From Trading: Picture a stock in an uptrend that starts moving sideways in a symmetrical triangle. When price breaks above the upper trendline, it confirms the uptrend is resuming. Alert traders who spotted this setup and waited for confirmation could profit from the move.
Historical Background: Early market analysts like Charles Dow and Richard Schabacker helped establish the symmetrical triangle pattern in the 1900s. Their work built the foundation for modern chart analysis, and this pattern remains a key tool.
Trading Tips:
- Confirm the breakout first: Don't jump in too early. Look for a clear break through the trendline with strong volume.
- Watch volume closely: Heavy volume on breakout suggests a real move. Light volume often means a false signal.
- Follow the trend: The previous trend usually continues after the pattern completes.
- Use the 2/3 rule: Consider entering when price reaches about two-thirds through the pattern to catch the breakout.
By learning how symmetrical triangles work and applying these tips, traders can better identify and capitalize on breakout opportunities. While no pattern guarantees profits, the symmetrical triangle offers clear signals and measurable targets for disciplined traders.
8. Double Top Pattern
The Double Top pattern is one of the most reliable bearish reversal signals on price charts. Day traders and investors value this pattern for its clear entry points and defined risk parameters. When correctly identified, it can signal when a bullish trend is running out of steam and about to reverse.
What is a Double Top?
A Double Top forms when price reaches a high point twice but fails to break through that resistance level on the second attempt. Between these two peaks is a lower point that forms the "neckline" or support level. This pattern suggests buyers are losing momentum and sellers may soon take control.
Key Features:
- Two Distinct Peaks: The pattern shows two tops at about the same price level. Small differences in the peak heights are okay, but large gaps weaken the signal.
- Support Level (Neckline): A clear support line connects the valleys between the two peaks. Breaking below this line confirms the pattern.
- Volume: Trading activity is typically higher at the first peak and drops at the second, showing weakening buyer interest.
- Pattern Length: Double Tops can take weeks to form but also appear in shorter and longer timeframes.
Pros:
- Strong Signal: A confirmed break below the neckline reliably indicates more downside ahead.
- Clear Targets: Traders can project price targets by measuring the height from peaks to neckline.
- Risk Management: Stop-loss levels are easy to set just above the second peak.
Cons:
- False Signals: Sometimes what looks like a Double Top is just a pause before prices move higher.
- Time Investment: The pattern needs time to develop and confirm.
- Needs Confirmation: Don't trade until price breaks the neckline with strong volume.
Real Examples:
- Bitcoin (BTC): Showed a textbook Double Top in April and November 2021 before a major decline.
- Netflix (NFLX): Formed this pattern before its big drop in 2022.
Trading Tips:
- Wait for the Break: Only enter short positions after price clearly breaks below the neckline.
- Check Volume: Look for increasing volume on the breakdown for confirmation.
- Protect Capital: Place stop-loss orders above the second peak.
- Set Targets: Measure from peaks to neckline to estimate how far price might fall.
Why This Pattern Matters:
The Double Top gives traders a reliable way to spot potential trend changes. Its clear entry points and built-in risk management guidelines make it especially useful for day traders and investors who want to make informed decisions.
(Note: No image was provided to include in this markdown response.)
Chart Patterns Performance Analysis: 8 Key Trading Strategies Compared
| Method | Difficulty | Time Required | Results | Best For | Key Benefit |
|---|---|---|---|---|---|
| Bull Flag Pattern | Moderate 🔄 | ⚡ 1–4 weeks | 📊 Continuation signal | Bullish trends | Clear entry/exit points |
| Double Bottom Pattern | Easy 🔄 | ⚡ Weeks-long | 📊 Reversal signal | Downtrend reversals | Clear price targets |
| Head and Shoulders Pattern | Difficult 🔄 | ⚡ Several weeks | 📊 Reversal signal | Trend reversal identification | Well-defined risk parameters |
| Cup and Handle Pattern | Moderate 🔄 | ⚡ 7–65 weeks | 📊 Continuation pattern | Bullish markets | Reliable breakout setups |
| Ascending Triangle Pattern | Moderate 🔄 | ⚡ 1–3 months | 📊 Bullish breakout | Trend continuation | High probability entries |
| Wedge Pattern | Moderate 🔄 | ⚡ 3–4 weeks | 📊 Reversal signal | Reversal opportunities | Definite entry/exit points |
| Symmetrical Triangle Pattern | Moderate 🔄 | ⚡ 1–3 months | 📊 Consolidation/continuation | All timeframes | Clear post-breakout targets |
| Double Top Pattern | Easy 🔄 | ⚡ Several weeks | 📊 Reversal signal | Bearish reversals | Defined risk levels |
Mastering Chart Patterns for Day Trading Success
Understanding eight essential day trading chart patterns - Bull Flag, Double Bottom, Head and Shoulders, Cup and Handle, Ascending Triangle, Wedge, Symmetrical Triangle, and Double Top - helps strengthen your market analysis skills. While recognizing these patterns is important, proper interpretation within market context makes all the difference. Pay attention to key factors like trading volume, broader market direction, and individual asset behavior when evaluating potential trades. Keep in mind that no pattern guarantees profits and false signals do happen.
Developing your chart pattern skills takes dedicated practice and ongoing education. Start by studying historical price charts to spot these patterns and learn their typical behavior. Testing your strategies on past data helps refine your approach and identify potential issues before trading real money. As you gain experience, adapt your methods based on changing market conditions and your personal trading style. Being able to read and respond to shifting market dynamics is essential for success.
The trading world keeps changing as new technology shapes how markets move. Computer-driven trading and advanced data analysis are impacting how chart patterns form and perform. Staying current with these changes while building on time-tested principles gives you the best chance of success.
Key Takeaways:
- Chart patterns offer useful clues about potential price moves
- Using patterns alongside other indicators improves accuracy
- Sound risk management is essential
- Keep learning and adapting your approach
Ready to improve your day trading with professional-grade tools? ChartsWatcher provides everything you need to identify, analyze and act on market opportunities. Our platform includes customizable dashboards, instant alerts, thorough backtesting capabilities and advanced filtering - everything you need to develop winning strategies and make smarter trading decisions. See how our dynamic tools can enhance your trading approach. Visit ChartsWatcher today to explore our comprehensive trading platform.
