10 Best Day Trading Indicators: A Complete Guide to Profitable Trading
Understanding Price Action Trading: From Ancient Wisdom to Modern Success

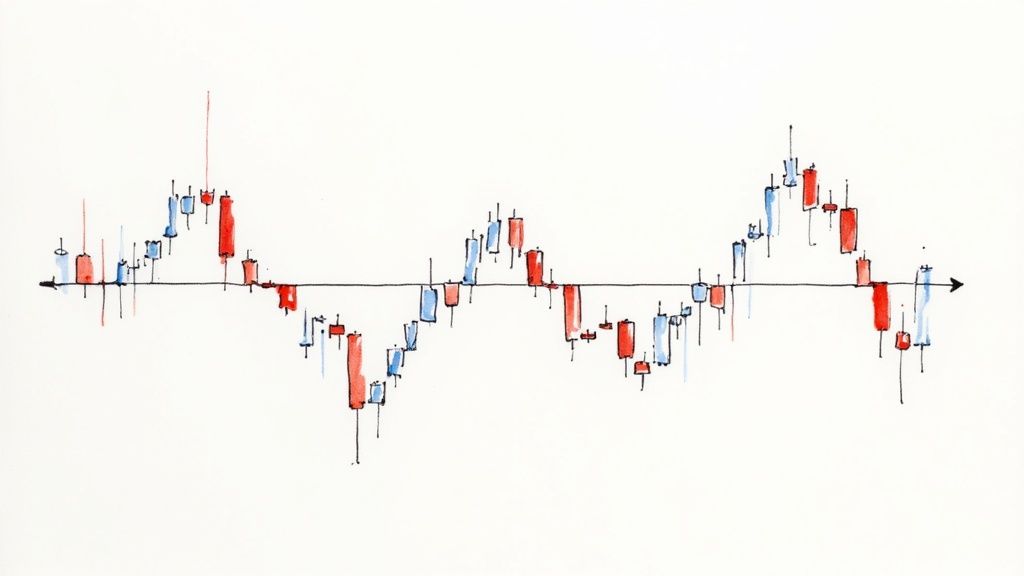
Price action trading focuses on analyzing pure price movements to make trading decisions. This method has deep historical roots, starting in 17th-century Japan where rice farmers developed candlestick patterns to track and forecast price changes. In the early 1900s, Richard Wyckoff expanded on these ideas by adding volume analysis to create a more complete trading approach.
Thanks to modern technology and online communities, more traders can now access and learn price action methods. For a detailed overview of price action trading concepts, check out Price Action Trading Explained.
Timeless Principles in a Modern Context
The core ideas developed by early price action traders work just as well in today's markets. These traders mastered key concepts like support and resistance levels, trend analysis, and chart patterns. They also recognized how crowd psychology affects price movements - an insight that remains crucial for modern trading.
Want to learn more about spotting market trends? Read How to Identify Market Trends: A Complete Guide to Finding Hidden Opportunities.
Bridging the Gap: Ancient Wisdom Meets Modern Tools
While today's traders have access to powerful charting software and instant market data, the fundamental skills haven't changed. Tools like ChartsWatcher help traders analyze markets more precisely, but success still depends on understanding price movements and market context. This combination of time-tested principles and new technology gives traders an edge in current markets.
Adapting and Thriving: The Future of Price Action
Being able to adjust to changing markets is key for trading success. Price action trading shines here because it's based on direct market observation. Markets constantly create new patterns while old ones become less reliable. Price action traders who truly grasp market dynamics can spot these changes and update their strategies accordingly. This flexibility makes price action trading effective for handling today's complex financial markets.
Mastering Historical Data Analysis for Trading Success
Learning to analyze past market data is key for effective price action trading. When you study how prices moved before, you can spot patterns that repeat and use those insights to make smarter trades. Looking at historical data helps you understand market dynamics and plan your trading strategy.
Identifying Reliable Patterns
By examining historical price data, you can spot dependable trading patterns. These range from basic price support and resistance to more complex formations. For example, when you see a head and shoulders pattern in past data, it often signals a trend change. Learning to spot these patterns helps you predict price moves instead of just reacting to them.
Understanding Market Context
Past data shows you how markets behave in different conditions. For example, seeing how a stock performed during previous economic downturns gives clues about what might happen in future slumps. Historical data reveals important patterns and cycles in price movements. When you study this data, you can find key support and resistance levels and better predict future moves. Some stocks tend to rise during specific times of year - knowing this helps you time your trades better. Learn more about using historical data in your trading here.
Developing High-Probability Trading Strategies
When you combine pattern recognition with market context understanding, you can build trading strategies with higher odds of success. While patterns often repeat, remember that past performance doesn't guarantee future results. Historical analysis works best when used alongside other analysis methods and solid risk management. This balanced approach helps maximize potential gains while limiting possible losses.
Building Your Price Action Database with ChartsWatcher
Tools like ChartsWatcher make analyzing historical data much easier. The customizable dashboards let you track and study past price data for multiple assets efficiently. This helps you build your own database of price action patterns and develop better trading strategies. ChartsWatcher also lets you test your strategies using historical data to improve your trading approach.
High-Probability Price Action Patterns That Actually Work
Trading with price action means watching how prices move on charts to spot recurring patterns. While there are many patterns traders look for, some have proven more reliable than others for predicting where prices might go next. Let's look at the patterns that consistently deliver results.
Understanding Key Price Action Patterns
The most dependable patterns include:
- Head and Shoulders: Shows a possible trend change with a higher peak (head) between two lower peaks (shoulders)
- Double Top/Bottom: Forms when price tests the same high/low level twice and fails to break through
- Triangles: Price consolidates into a triangle shape before breaking out, often continuing the main trend. Can be symmetrical, ascending, or descending
- Flags and Pennants: Brief pauses in a strong trend that look like flags or pennants on a pole, usually followed by more movement in the same direction
Pin Bar Strategy: A Powerful Reversal Signal
The Pin Bar Strategy focuses on a specific candle pattern with a long "tail" or "wick" and small body. This setup often signals that the market may change direction. Many traders enter at the 50% point of the pin bar or when price breaks past its tip. The strategy works best when combined with other signals like strong trends or key support/resistance levels. For more details on this approach, check out this guide to price action trading strategies.
Combining Patterns for Stronger Signals
Single patterns can point to good trades, but using multiple signals together improves your odds. For example, seeing a pin bar form at a major support level during a downtrend gives a much stronger signal than finding one by itself.
Mastering Pattern Recognition with ChartsWatcher
ChartsWatcher offers tools that help spot and confirm price patterns across different markets. Its dashboard lets you watch multiple timeframes at once, making it easier to verify patterns using different data views. By learning to use these features well, traders can develop better pattern recognition skills and make more informed trading decisions based on proven price action methods.
Risk Management Strategies That Preserve Your Capital
Smart trading starts with protecting your money. While finding good trades is important, managing risk is what keeps you in the game long-term. Let's look at key ways to control risk while maximizing potential gains.
Position Sizing: The Foundation of Risk Control
Position sizing determines how much money you risk on each trade. This basic but critical concept helps protect your account from big losses. Most experienced traders recommend risking no more than 1-2% of your account on a single trade. For example, with a $10,000 account using the 1% rule, you'd risk maximum $100 per trade. This prevents one bad trade from seriously damaging your trading capital.
Stop-Loss Placement: Protecting Against Adverse Moves
Stop-loss orders automatically close trades that move against you to limit losses. Place stops based on the price action signals you're trading. With pin bar reversals, put your stop just beyond the pin bar's high or low. For breakout trades, place stops below the breakout level to protect against false moves.
Trade Management: Adapting to Changing Conditions
Good trade management means adjusting positions as the market moves. This includes moving stops to lock in profits, taking partial profits at key levels, or adding to winning trades carefully. Stay alert and ready to adjust your plan based on how price action develops. Tools like ChartsWatcher can help by providing real-time data and customizable alerts.
Managing Multiple Positions and Scaling: Advanced Techniques
When trading multiple positions, watch your total risk exposure carefully. While diversifying across different assets helps reduce risk, you still need clear rules for managing overall exposure. Scaling in and out means gradually entering or exiting trades - especially helpful in volatile markets. But set specific price action rules for scaling to maintain discipline and avoid emotional decisions. Used together, these methods help preserve capital while pursuing profits.
Building Your Professional Trading System
We've covered key price action patterns and risk management foundations. Now let's put these pieces together into a complete trading system that will guide your market decisions.
Documenting Your Trading Rules
Start by writing down clear rules for every part of your trading process. This includes specific entry and exit criteria based on price action setups, how you'll size positions, and where you'll place stops. Think of this as your trading handbook - a reference guide that keeps you consistent and helps prevent emotional decisions.
Maintaining Detailed Trading Records
Keep detailed logs of all your trades, including:
- Entry and exit prices
- Position sizes
- Stop-loss levels
- Notes about the setup and market conditions
- Date and time
This data helps you track performance and spot what's working. For instance, you can calculate your win rate and average profit per trade to identify your strongest setups.
Conducting Effective Performance Reviews
Schedule regular reviews of your trading results. Look closely at your records to find patterns - both good and bad. Ask yourself:
- Which setups give you the most wins?
- What market conditions work best for your strategy?
- Where are you taking unnecessary losses?
Use these insights to refine your approach. You might find this helpful: How to backtest your trading strategy.
Integrating Tools and Automation
ChartsWatcher provides features to support your trading system:
- Custom price alerts
- Pattern recognition tools
- Automated trade execution
- Performance tracking dashboards
These tools help maintain consistency and save time without replacing your judgment.
Adapting to Changing Markets
Markets evolve, so your system needs flexibility. Review and update your rules periodically based on changing conditions. This might mean:
- Adding new effective patterns
- Adjusting position sizing
- Updating risk parameters
Regular refinements keep your system sharp while maintaining your core strategy principles.
Advanced Price Action Concepts for Market Mastery

Price action trading becomes much more powerful when you understand how major market participants influence prices. Let's explore some key strategies that can give you better insights into market movements and price patterns.
Reading the Footprints of Institutional Traders
Big market players like hedge funds and pension funds move serious money that shapes price movement. When you spot a big volume spike along with strong price movement, that often signals institutional buying or selling. Learning to spot these patterns helps you better predict where prices might go next.
Decoding Order Flow: Seeing Supply and Demand in Action
Think of order flow like looking under the hood of price movement. While price charts show you completed trades, order flow reveals the buying and selling pressure building up behind the scenes. This deeper view often helps traders spot potential breakouts or reversals before they show up on regular charts.
Identifying Significant Market Shifts
Smart traders watch for key changes in momentum, volatility, and overall market structure. Just like a good sailor reads wind and wave patterns, successful traders track these market conditions to stay profitable. Tools like ChartsWatcher help monitor these important shifts in real-time.
Adapting Your Approach for Different Market Phases
Markets move through distinct phases - accumulation, markup, distribution, and markdown. Each phase needs its own trading approach. During accumulation periods, look for basing patterns and signs of big buyers stepping in. In distribution phases, watch for weakness in upward momentum and signs of selling pressure.
Maintaining Profitability in Challenging Conditions
Rough markets happen to everyone. Whether it's high volatility, surprise news, or economic problems, protecting your capital becomes key during tough times. This means smaller position sizes, tighter stops, and being extra selective with trades. Good price action skills help you spot potential turning points and navigate these tricky periods more safely.
Ready to improve your trading with ChartsWatcher? Get better price action analysis tools and gain an edge in the markets with ChartsWatcher.
