What Is Trading Volume Explained for Smarter Trading
Trading volume is simply the total number of shares or contracts that change hands for a security over a set period. Think of it like the roar of the crowd at a stadium—a deafening cheer signals intense action and conviction, while a quiet murmur suggests nobody's really paying attention.
Unpacking the Meaning of Trading Volume
At its heart, trading volume is one of the most fundamental measures of market activity. It’s a straightforward count of how many shares of a stock or contracts of a derivative were traded between buyers and sellers within a given window—be it a day, an hour, or even a single minute. This number is a crucial clue about a market's liquidity and the real strength behind any price move.
When a price shoots up or down on high volume, it’s like a powerful statement backed by a massive crowd; it suggests strength and confidence in the move. On the flip side, a price change on low volume feels more like a whisper—it could just be noise, signaling a lack of real conviction from the market.
Volume as a Measure of Market Activity
This metric gives you a transparent look into the supply and demand dynamics of a security. When you see high trading volume, it means a ton of market participants are actively buying and selling. That typically leads to better price discovery and tighter bid-ask spreads, and it shines a spotlight on the assets everyone is watching right now.
And the scale of this activity can be absolutely massive. For example, the New York Stock Exchange (NYSE) now sees an average daily trading volume of roughly 1.36 billion shares as of 2025. The tech-heavy Nasdaq is even busier, with an average of over 9 billion shares traded daily. These numbers show just how much liquidity flows through major markets every single day. If you want to dig deeper, you can explore more stock market statistics to see how volume plays out across different exchanges.
Volume is the fuel that drives the market. Without it, even the most promising price trend can stall out. It provides the context you need to validate price action and separate the meaningful moves from the random noise.
High Volume vs Low Volume Trading Scenarios
To really nail this down, it helps to compare high and low volume situations side-by-side. Think of this table as a quick cheat sheet for interpreting what the market is telling you through its activity level.
| Indicator | High Trading Volume Implication | Low Trading Volume Implication |
|---|---|---|
| Market Conviction | Strong belief in the current price trend. Traders are voting with their wallets. | Weak conviction or uncertainty. The price move might not be sustainable. |
| Trend Strength | Confirms the strength of a price move. A breakout on high volume is significant. | A breakout on low volume is suspect and could be a "fakeout." |
| Liquidity | High liquidity, making it easy to enter and exit positions with minimal price impact. | Low liquidity. It may be harder to trade without affecting the price (slippage). |
| Trader Interest | The stock is "in play," attracting significant attention from traders and institutions. | Low interest. The stock is likely consolidating or being ignored by the market. |
Essentially, high volume acts as a confirmation signal, adding weight and credibility to whatever the price is doing. Low volume, on the other hand, often signals that you should be skeptical of the current price action until more participants jump in.
How to Read Trading Volume on a Chart
Take a look at almost any stock chart, and you'll see a series of vertical bars lined up along the bottom. That's your trading volume indicator. Each one of those bars tells you the total number of shares that changed hands during a specific period—be it a day, an hour, or even just five minutes.
It’s really just a simple tally. If one trader buys 100 shares from another, the volume for that period goes up by 100. The height of the bar is your visual cue: taller bars mean heavy trading, while shorter bars signal lighter, quieter activity.
Interpreting Volume Bar Colors
You’ve probably noticed the bars are usually colored red or green. This isn't just for show; the color gives you immediate context by connecting the volume to what the price was doing.
- Green Volume Bar: This tells you the stock's price closed higher than it did in the previous period. It's a sign that strong buying interest was likely fueling that upward move.
- Red Volume Bar: This means the price closed lower than the prior period, signaling that significant selling pressure was probably driving the price down.
It's a common mistake to think the color represents more buyers than sellers. Remember, for every buyer, there's a seller. The color simply tells you whether the price ended up (green) or down (red) during that burst of activity.
Using a Volume Moving Average
To make sense of the noise and instantly spot unusual activity, many traders overlay a moving average line on their volume indicator. This line smooths things out by showing the average volume over a specific number of periods, like 20 or 50 days.
Now, any volume bar that spikes way above this moving average line jumps right off the chart. It's a flag for a day with abnormally high interest. This could signal a major shift in market sentiment or a potential trading opportunity that’s worth a closer look. It's a simple but effective way to filter for what really matters.
Why Volume Is Your Market Lie Detector
Think of trading volume as your built-in market lie detector. Price charts tell you what is happening, but volume reveals the conviction behind the move. It’s the tool that separates a genuine market shift from simple, everyday noise.
Let’s use an analogy. A powerful, rushing river can easily sweep objects downstream. That's a price trend backed by high volume—it has real strength and momentum because lots of people are participating. On the other hand, a weak trickle of water can barely move a leaf. That’s a price move on low volume; it has no force behind it and is far more likely to fizzle out or reverse.
The Power of Confirmation
At its core, volume is all about confirmation. When a stock breaks out to a new high, you want to see a big spike in volume right along with it. This surge tells you that a ton of traders are jumping in, validating the move and suggesting it has enough fuel to keep going.
Conversely, a price move on thin volume should make you suspicious. It could just be a "fakeout" caused by one or two big orders instead of broad market agreement. Without that widespread participation, the trend is fragile and can easily fall apart.
This is more critical than ever in today's markets. Historical data shows a massive increase in trading activity over the last decade, thanks to more participants and new technologies. A quick look at U.S. equities data reveals a clear upward trend in both daily shares traded and the sheer number of trades. You can dig into the specifics yourself on Cboe Global Markets.
High volume doesn't guarantee a price will keep moving in a certain direction, but it confirms the strength and validity of the current move. It’s the difference between a whisper and a shout.
Spotting Reversals and Liquidity
Volume is also a fantastic tool for spotting when a trend might be running out of steam. If a stock has been climbing for weeks and suddenly gets a massive volume spike with very little upward price movement, that’s a huge red flag. This is often called "exhaustion volume"—it signals the last of the buyers have piled in, and a reversal could be just around the corner.
Finally, consistent, high trading volume is a sign of strong liquidity. This is crucial. It means you can get in and out of your positions easily without your own trades moving the stock’s price too much. For any trader, that smooth execution is key.
Decoding Common Volume Patterns and Signals
Once you get a feel for what trading volume is, you can start using it to spot specific, actionable patterns on a chart. Think of these signals as the market’s body language—they reveal the underlying psychology and offer powerful clues about where the price might go next.
Instead of just seeing volume as a single number, seasoned traders look for the story it tells alongside price. These patterns often repeat themselves, giving you a framework for making much more informed decisions. It’s the difference between simply watching the market and actually anticipating its next move.
This infographic breaks down the core relationship between trading volume and price action, touching on key ideas like trend confirmation and volume spikes.
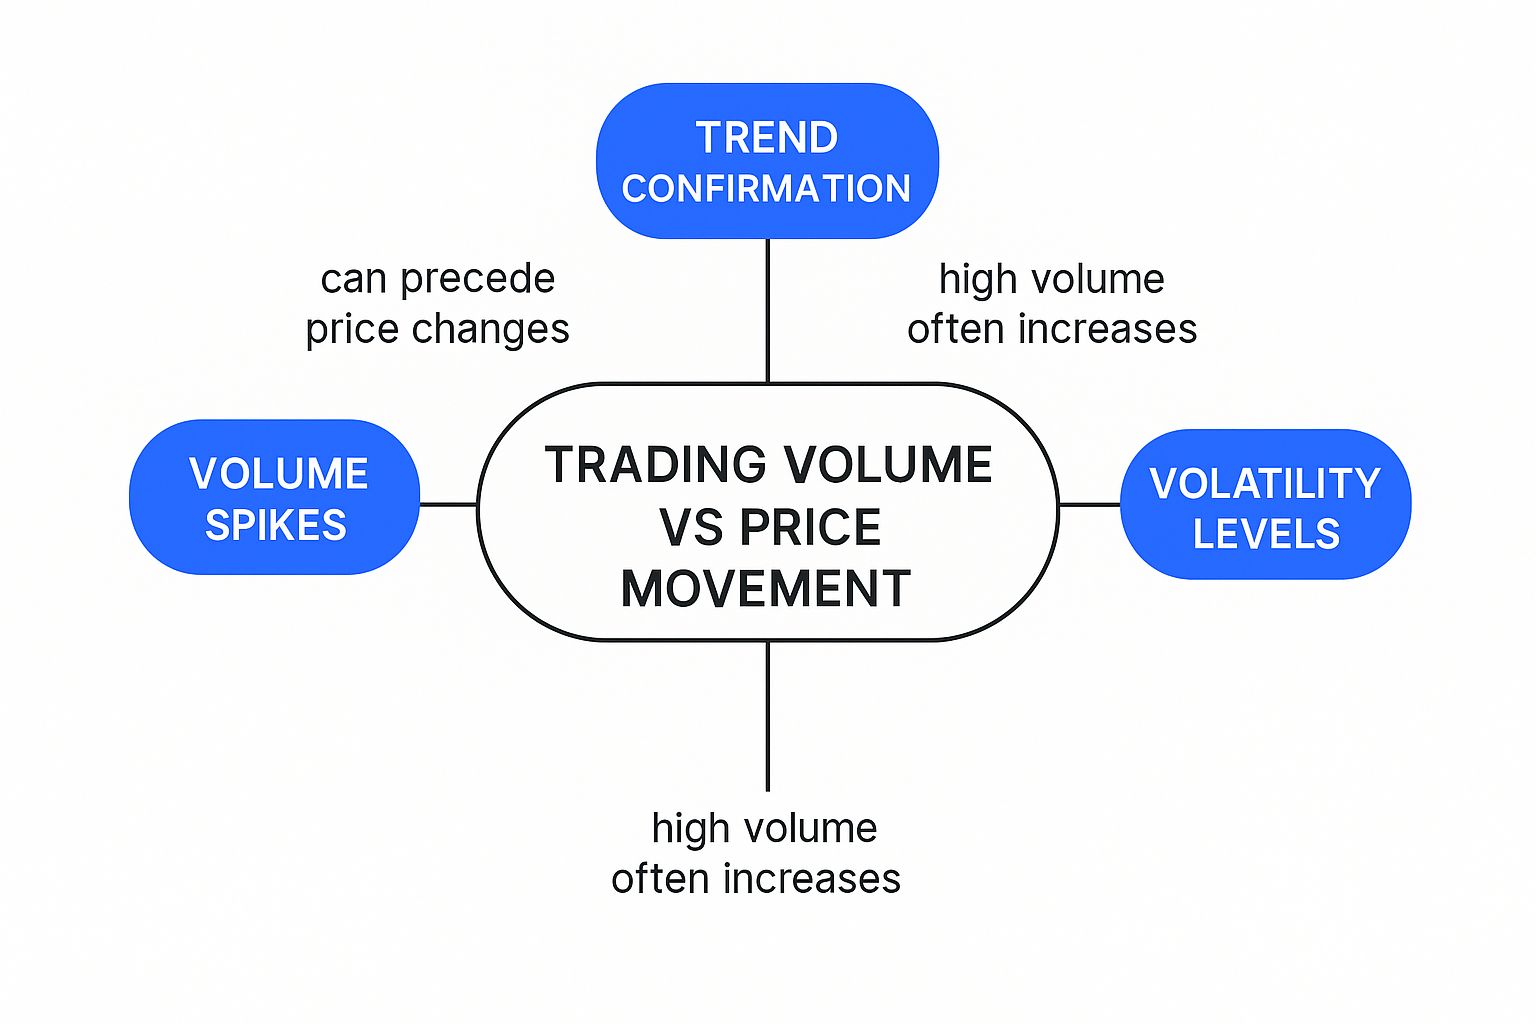
As you can see, volume isn't just a static number. It’s a dynamic indicator that helps confirm trends, flag potential reversals, and measure the market’s conviction.
Volume Spikes and Breakout Confirmation
One of the most reliable signals you can find is breakout confirmation. When a stock’s price punches through a key resistance level or drops below support, you want to see a massive surge in volume. This spike is your proof that a large number of traders are getting involved and believe in the new direction.
A price breakout without a corresponding volume spike is a major red flag. It often signals a "fakeout"—a move that lacks the broad participation needed to keep going.
Another critical pattern is the exhaustion spike. This usually happens after a long, established trend. A huge spike in volume with very little price change can signal that the trend is running out of steam. In an uptrend, it suggests the last of the buyers have finally piled in. In a downtrend, it means panic selling might be hitting its peak.
Fading Momentum and Volume Divergence
Perhaps the most subtle—yet powerful—signal is volume divergence. This is when the price and volume start telling two completely different stories.
Imagine a stock is pushing to new highs, but each new peak happens on less volume than the one before it. This is a classic bearish divergence.
- What Price Says: "Everything is great! We're reaching new heights."
- What Volume Says: "Yeah, but fewer and fewer people are showing up for each new push higher."
This conflict suggests the upward momentum is getting weaker and the trend is becoming fragile. The conviction is fading, and a reversal could be just around the corner. Learning more about decoding unusual stock volume for smarter trades can give you a real edge in spotting these critical market shifts before they become obvious to everyone else.
Combining Volume Analysis with Your Strategy
Trading volume on its own is interesting, but it rarely tells the whole story. Its real power comes alive when you pair it with other technical indicators, turning it into a fantastic confirmation tool that can seriously sharpen your entries and exits.
Instead of looking for volume signals in a vacuum, think of it as a layer of validation for whatever strategy you're already using. It helps you sidestep false signals and trade with more confidence, whether your go-to tools are moving averages, momentum oscillators, or something else entirely.
Using Volume with Other Indicators
Volume can confirm signals from almost any indicator out there, adding that crucial layer of context to what you're seeing on the chart. It helps you answer the big question: "Is there real conviction behind this move?"
- Moving Averages: A bullish crossover—like when the 50-day moving average crosses above the 200-day—is a classic buy signal. But if that crossover happens on a huge surge of trading volume, it confirms there’s strong buying pressure behind the move. That adds some serious weight to the signal.
- RSI (Relative Strength Index): Let's say the RSI shows a stock is overbought (typically a reading above 70). Many traders would see that and start thinking about selling. But what if the volume is low and drying up while the RSI is high? That could just mean the buying pressure is taking a breather, not reversing. Checking the volume can help you avoid getting shaken out too early.
Volume adds the why to the what that other indicators show you. A price pattern tells you what happened; volume tells you how much conviction was behind it.
It's also worth knowing where the action is happening. The distribution of trading volume across different exchanges tells you where the most liquidity is. For instance, in August 2025, the Nasdaq Stock Market handled about 13.9% of U.S. equities volume, which works out to an average of 2.3 billion shares traded every day. You can see more details on this from the source with the market share data at Nasdaq Trader. For active traders, knowing where the liquidity is concentrated is vital for getting good fills on your orders.
By weaving volume analysis into your process, you stop just reading charts and start understanding the market's underlying dynamics. To go deeper, our guide on trading with volume provides a modern look at market analysis and explores these concepts in more detail. This approach helps you make more robust, data-backed decisions.
Common Questions About Trading Volume
As you start weaving volume into your analysis, a few questions always pop up. Let's tackle some of the most common ones to clear things up and get you using this tool with more confidence.
Does High Trading Volume Automatically Mean the Price Will Go Up?
Not at all. Think of high volume as an amplifier, not a crystal ball. It simply confirms that there's a lot of conviction and participation behind whatever move is happening right now.
For instance, a big price jump on massive volume tells you that a ton of enthusiastic buyers are piling in, which validates the strength of that rally. On the flip side, a sharp price drop on huge volume signals intense selling pressure and panic. It confirms the strength of the current trend, but it doesn't predict the future on its own.
A sudden, massive volume spike at the peak of a long rally can even signal a "blow-off top," where the last of the buyers rush in right before the smart money starts selling. Volume is about context, not prophecy.
What’s Considered “High” or “Low” Volume for a Stock?
This is one of the most important things to get right: volume is always relative. A huge volume day for a small-cap biotech stock might be a snoozer for a giant like Apple. The only thing that matters is comparing a stock's volume today to its own recent history.
Most traders use a 50-day moving average of volume as a simple baseline. Charting platforms, including the ones in ChartsWatcher, let you overlay this average right on your volume bars. This makes it incredibly easy to spot any day with unusual activity that jumps out from the norm.
Can I Use Trading Volume for Crypto or Forex?
The short answer is yes, but with a big asterisk. For stocks, which trade on centralized exchanges, the volume data you see is consolidated and very reliable. In other markets, the story gets a bit murkier.
- Crypto: The data is useful but fragmented. Since crypto trades on dozens of different exchanges (like Coinbase or Binance), the volume you see on one platform is just a piece of the puzzle. You're not getting a single, total market picture.
- Forex: The foreign exchange market is completely decentralized (over-the-counter), which means there is no single source for true, consolidated traded volume. Instead, platforms often provide "tick volume," which just measures the number of price changes in a given period. It's a decent proxy for activity, but it’s definitely not the same as the actual share or contract count you get with stocks.
Ready to put powerful volume analysis to work? ChartsWatcher provides a dynamic platform with customizable dashboards, advanced alerts, and real-time data to help you spot market-moving volume signals. Build and backtest your strategies with the precision you need. Explore ChartsWatcher today.
