What is Market Liquidity? Key Insights for Traders
In simple terms, market liquidity is just a fancy way of asking: "How quickly can I sell this thing for a fair price?" If you can sell it fast without the price crashing, the market is liquid. If you're stuck waiting for a buyer or have to slash your price to get rid of it, the market is illiquid.
Understanding Market Liquidity and Its Key Players
Think of a busy farmers' market on a Saturday morning. It's packed. You’ve got a crate of apples to sell, and there are dozens of people walking around, ready to buy. You'll find a buyer in minutes and get the going rate for your apples. That's a highly liquid market.
Now, imagine you're at a lonely roadside stand on a Tuesday afternoon. You have the same crate of apples, but maybe one car drives by every hour. To make a sale, you'll probably have to drop your price way down or just sit there hoping someone shows up. That's an illiquid market.
In the financial world, the "apples" are just stocks, currencies, or whatever else you're trading. The principle is exactly the same. A liquid market lets you turn your assets into cash quickly, without tanking the price in the process. An illiquid market makes it slow, painful, and potentially expensive.
The Three Pillars of a Liquid Market
So, what actually makes a market liquid? It really boils down to three key ingredients that have to be there.
- Tons of Buyers and Sellers: The more people in the game, the better. A high volume of participants means there's almost always someone on the other side of your trade, ready to take your offer.
- Willingness to Trade: It's not just about having people around; they need to be actively placing orders. This constant flow of buy and sell orders is what keeps the market moving smoothly.
- Stable Prices: In a truly liquid market, one big trade won't send shockwaves through the price. Prices are set by the collective force of everyone trading, not just one or two big players.
A liquid market is an efficient market. It cuts down on the friction and costs of trading, letting capital move where it needs to go and helping everyone agree on what an asset is actually worth. For traders, that means less risk and more confidence when you hit the "buy" or "sell" button.
This concept isn't just theory—it has a direct impact on your ability to manage your trades and protect your money from nasty surprises.
The Core Mechanics of a Liquid Market
To really get what market liquidity is all about, we need to pop the hood and look at the engine that drives it. Think back to our bustling farmers' market—it only works with a steady stream of buyers and sellers. Financial markets are no different, and they rely on a few key mechanics to keep things flowing smoothly.
Two of the most critical pieces of this puzzle are market depth and the bid-ask spread.
Deconstructing Market Depth
When you look at a trader's screen, you'll see something called an order book. It’s not just a static list; it’s a living, breathing ladder of all the "buy" and "sell" orders waiting to be filled at different prices. Each rung on that ladder represents a specific price level.
Market depth tells you how many rungs are on that ladder and, more importantly, how much volume is stacked on each one, especially near the current market price.
A market with deep liquidity has a thick, densely packed order book. This means a huge order can be dropped into the market and get absorbed without causing a massive price swing because there are plenty of counter-orders ready and waiting to be filled. It’s like a deep ocean that can handle a big splash without much disturbance.
On the flip side, a shallow market has a sparse order book with big gaps between price levels. Placing a large order here is like tossing a giant rock into a tiny pond—it creates huge ripples and causes significant price slippage.
The infographic below really brings home how these key factors work together to create a healthy, liquid market.
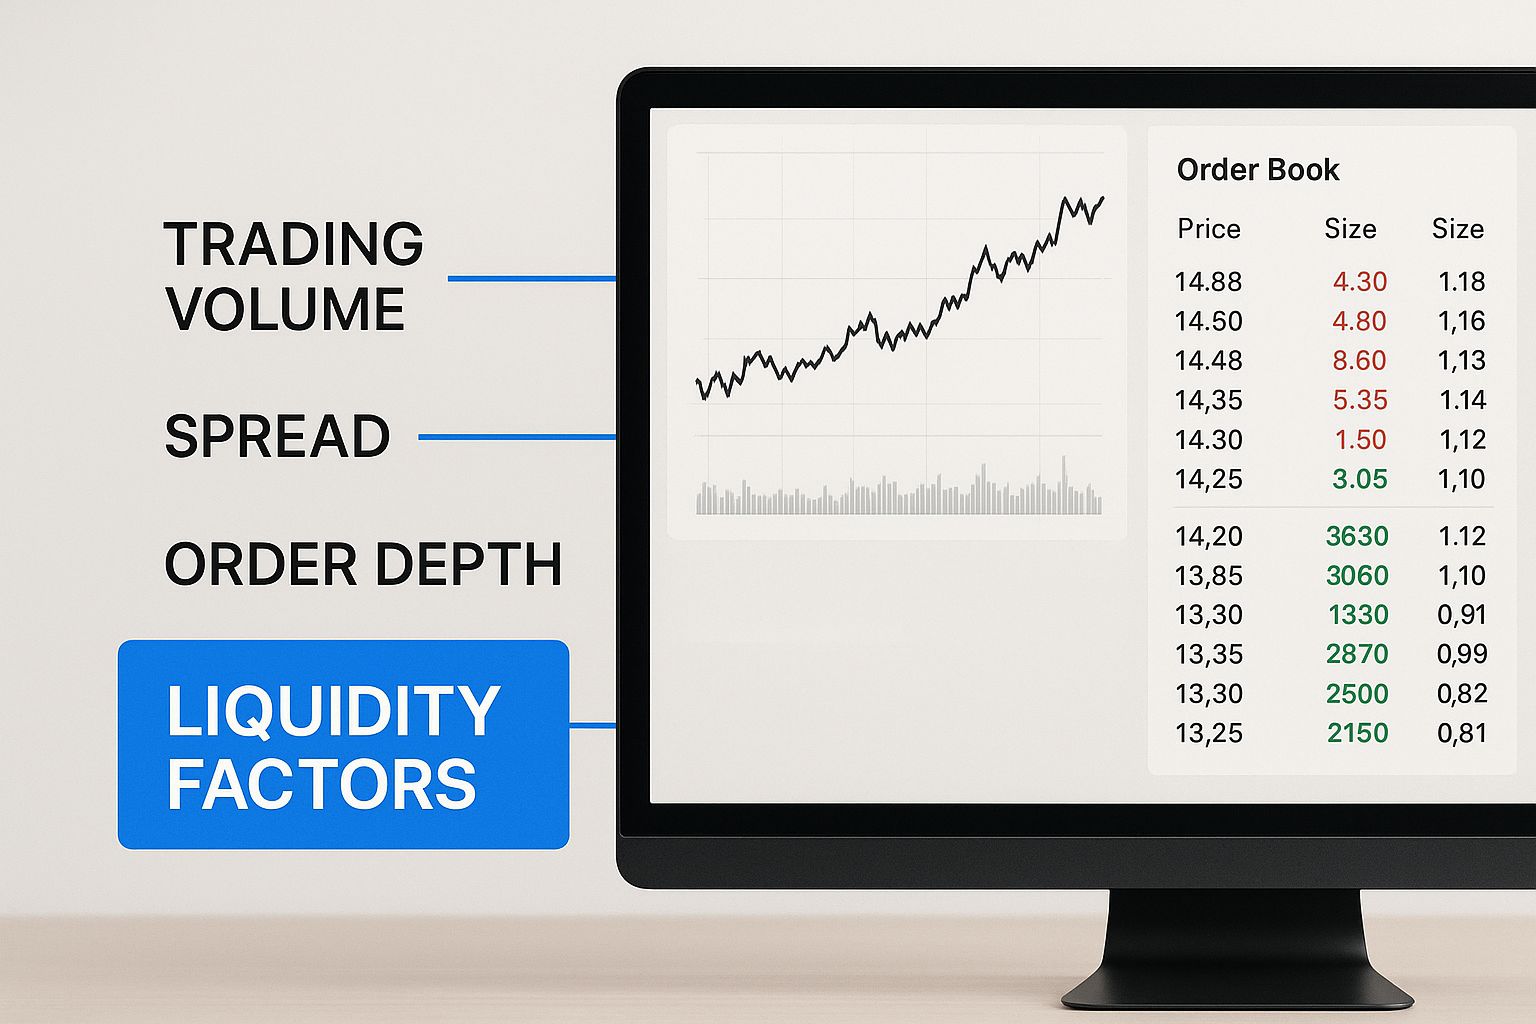
As you can see, trading volume, market depth, and a tight bid-ask spread aren't separate concepts. They're interconnected pillars that hold up the entire structure of market liquidity.
Understanding the Bid-Ask Spread
The second crucial component is the bid-ask spread. Simply put, this is the tiny gap between the highest price a buyer is willing to pay for an asset (the bid) and the lowest price a seller is willing to accept (the ask).
A narrow bid-ask spread is a classic sign of high market liquidity. It signals strong agreement on the asset's value and intense competition between buyers and sellers, which keeps transaction costs low for traders.
A wide spread, however, is a red flag for low liquidity and means you'll pay more to get in and out of a trade. To really nail down this fundamental concept, check out our essential guide for traders on the bid-ask spread. Understanding how these factors play off each other will completely change how you see the markets.
Historically, the perception of global liquidity can swing wildly. For instance, from the early 2000s until around 2007, financial markets felt like they were swimming in liquidity. This was fueled by rapid growth in money supply that outpaced economic growth, leading to asset price booms in stocks and real estate before paving the way for the inevitable correction.
High Liquidity vs Low Liquidity Markets at a Glance
To make this crystal clear, let's break down the key differences between a liquid and an illiquid market side-by-side. This table gives you a quick cheat sheet for spotting the conditions you're dealing with.
| Characteristic | High Liquidity Market | Low Liquidity Market |
|---|---|---|
| Trading Activity | High volume of buyers and sellers | Few active buyers and sellers |
| Bid-Ask Spread | Narrow (tight) | Wide |
| Price Stability | Prices are stable; low volatility | Prices are volatile; frequent large swings |
| Transaction Speed | Orders are filled quickly | Orders can take a long time to fill |
| Transaction Costs | Low | High |
| Slippage Risk | Minimal risk of slippage | High risk of slippage on large orders |
| Example Assets | Major currencies (EUR/USD), large-cap stocks (Apple), major indices (S&P 500) | Penny stocks, real estate, exotic collectibles, some cryptocurrencies |
This table should help you quickly assess a market's environment. Recognizing these traits in real-time is a skill that separates novice traders from the pros.
Why Liquidity Is Your Best Friend in Trading
So, we've nailed down what market liquidity is. Now for the million-dollar question: why should you actually care?
Put simply, liquidity is one of the most powerful allies you can have in the markets. It has a direct hand in your costs, your execution speed, and the overall stability of your trading experience. Think of a liquid market as a fair, efficient, and well-oiled machine.
High liquidity acts as a crucial buffer, shielding you from wild price swings and nasty, unexpected costs. When you’re placing trades in a market buzzing with buyers and sellers, you can execute your orders smoothly and with confidence, knowing the price you click is the price you'll get.
Lower Costs and Tighter Spreads
The most immediate and tangible benefit of a liquid market is lower transaction costs. As we've seen, tons of trading activity naturally leads to a narrow bid-ask spread. This tiny gap is basically the fee you pay the market for the privilege of an instant transaction. In a liquid market, that fee is minimal.
It's a bit like exchanging currency. At a busy international airport, the exchange kiosks have super competitive rates (a tight spread) because they're all fighting for your business. But if you find a single booth in a remote town, the rates will be awful (a wide spread) because they have a monopoly. Every single trade you make is just a little more profitable when that spread is tight.
Minimizing Slippage Risk
Another critical advantage is the reduction of slippage. We've all been there. You place an order at a specific price, but by the time it gets filled, the market has moved, and you get a worse price. In illiquid markets, this isn't just a minor annoyance; it's a common and costly problem.
A liquid market offers price stability. With a deep order book, even large orders can be absorbed without causing a major price disruption. This ensures you can get in and out of your positions at predictable levels, which is the absolute bedrock of effective risk management.
Imagine trying to sell a rare, one-of-a-kind classic car. You might have to wait for months to find the right buyer and end up accepting an offer far below what you initially wanted. Now, picture selling a popular, mass-produced Toyota. You’ll get multiple offers within days, and the final sale price will be right around what you expected. That same logic applies directly to trading assets.
The Dangers Lurking in Illiquid Markets
The risks of dabbling in illiquid markets are the mirror opposite of these benefits—and they can be absolutely devastating to your bottom line.
- High Transaction Costs: Wide bid-ask spreads are like a leaky bucket, constantly draining profits from your account with every trade.
- Significant Slippage: The price you thought you were getting can be miles away from the price you actually get, turning a potential winner into a loser before it even starts.
- Inability to Exit: This is the trader's nightmare. You could be stuck in a losing position, watching it bleed, simply because there's nobody on the other side willing to buy it from you.
For example, trying to offload a huge block of shares in some obscure, small-cap company can be a disaster. Your own sell order might be big enough to crash the price, forcing you to sell for pennies on the dollar. This is exactly why seasoned traders always check for liquidity before they even think about putting capital on the line.
How Global Events Can Make Liquidity Vanish
Market liquidity isn’t some permanent feature baked into an asset’s DNA. It’s a fragile, dynamic state—more like the collective mood of the market than a fixed number on a screen.
Think of it like the water level in a reservoir. During sunny, prosperous times, the reservoir is full, and the supply seems endless. But when a major storm hits—an economic crisis, a war, a pandemic—that water can evaporate with terrifying speed.
This happens because liquidity is deeply, fundamentally tied to human psychology. When fear and uncertainty take over, buyers simply vanish. Suddenly, everyone wants to sell, and nobody wants to buy. That massive imbalance is what causes the water level to plunge, turning once-liquid assets into immovable burdens almost overnight.
A perfect, painful example is the 2008 global financial crisis. As panic ripped through the system, the markets for certain mortgage-backed securities didn't just slow down; they completely seized up. Assets that were actively traded one day had zero buyers at any sane price the next. Sellers were trapped, triggering catastrophic losses and bringing down legendary institutions. This wasn't a niche problem, either. The fear cascaded across all markets, draining liquidity from stocks, bonds, and everything in between.
The Ripple Effect of Economic Shocks
Major economic events are like earthquakes for the financial system, and liquidity is often the first casualty. The mechanisms that cause this rapid evaporation are usually a mix of raw panic and the institutional reactions that follow.
Central bank policy is a huge one. When a central bank cranks up interest rates to fight inflation, it’s effectively sucking money out of the system. Borrowing becomes more expensive, capital for trading and investment shrinks, and market depth thins out.
Regulatory changes can have the same effect. After the 2008 crisis, new rules were put in place to make banks safer. A noble goal, but a side effect was that these reforms limited their ability to act as market makers, the very entities that provide liquidity. The numbers tell the story: between 2010 and 2015, European corporate bond trading volumes plummeted by up to 45%. Globally, banks’ holdings of trading assets fell by over 40% from 2008 to 2015 as they were forced to de-risk. You can explore the full study on post-crisis liquidity shifts for a deeper dive.
A liquidity crisis is always, at its core, a crisis of confidence. When trust in the financial system breaks, market participants run for the sidelines, hoard cash, and refuse to take risks. That collective retreat is what turns a market downturn into a full-blown freeze.
Understanding these dynamics is more than just an academic exercise. It teaches us a crucial lesson: market liquidity is never guaranteed. It’s a delicate state that depends on stability, confidence, and the smooth operation of the entire global financial machine. As a trader, recognizing the warning signs of a liquidity drain—widening spreads, sudden violent price swings, and a disappearing order book—is a critical survival skill.
Practical Ways to Measure Market Liquidity
Knowing the theory behind market liquidity is great, but spotting it on a live chart is what actually makes you money. The good news? You don’t need a fancy degree or complicated tools to become a liquidity detective. Most of the vital signs are sitting right there on your trading platform, just waiting to be read.
Learning to interpret these clues lets you size up the trading environment before you put any capital on the line. By checking just a few key metrics, you can tell whether you’re about to jump into a deep, calm ocean or a shallow, choppy pond. It’s a fundamental skill for making smarter, more confident trading decisions.
Reading the Bid-Ask Spread
The quickest, most immediate sign of liquidity is the bid-ask spread. We've touched on this before, but it's simply the gap between the highest price a buyer is willing to pay (the bid) and the lowest price a seller is willing to accept (the ask).
- A tight spread (a tiny gap) is a fantastic sign of high liquidity. It tells you there’s fierce competition between buyers and sellers and plenty of participants, making it cheap and easy to get in or out of a trade.
- A wide spread (a large gap) is a major red flag for poor liquidity. It means fewer players are in the game, and the cost to trade is higher—a cost that can quickly chew up your profits.
A trader's mantra should be: "Always check the spread." A surprisingly wide spread on a typically popular asset can be an early warning of weird market conditions or a sign that volatility is about to pick up.
Analyzing Trading Volume and Market Depth
While the spread gives you a quick snapshot, trading volume and market depth tell a much deeper story about what's really going on.
Trading volume is the total number of shares or contracts that have changed hands over a set period. Think of it as the crowd size at a party—high volume means the party is packed, a strong indicator of high liquidity. If you want to dig deeper, check out our guide on what trading volume is and how it helps with smarter trading.
But volume alone isn't enough. You also need to look at the order book to see the market's depth. This is a live list of all the buy and sell orders waiting to be filled at different price levels. A market with good depth has large orders stacked up right near the current price, ready to absorb trades.
Here's what a typical order book looks like, with the buy orders (bids) on the left and the sell orders (asks) on the right.
This visual instantly shows you where the biggest pockets of supply and demand are sitting, giving you a clear picture of the market's ability to handle large trades without the price slipping too much.
Another simple metric is the turnover ratio, which compares the total shares traded against the total shares available. A high turnover ratio is a great sign, suggesting the asset is changing hands frequently and confirming you're looking at a liquid, active market.
Of course. Here is the rewritten section, designed to sound completely human-written and natural, following all the provided instructions and examples.
Spotting Liquid vs. Illiquid Markets in the Wild
Theory is great, but the real skill is being able to spot liquidity—or the lack of it—in a live market. Let's ditch the textbook definitions and look at how this plays out in the real world across different asset classes, from the most free-flowing to the most gridlocked.
Think of major forex pairs like the EUR/USD. With trillions of dollars flying back and forth daily, it’s the undisputed heavyweight champion of liquidity. This constant flood of trades means you can move massive amounts of money in an instant with a bid-ask spread so tight it’s almost invisible. Blue-chip stocks like Apple (AAPL) are in the same boat, attracting millions of investors who ensure the market is deep enough to absorb huge orders without even flinching.
Another rock-solid example is the U.S. Treasury market. It’s often considered the ultimate safe haven for a reason—its depth is typically immense, acting as a stable foundation for the entire global financial system.
But remember, even the deepest pools can get choppy. A sudden shock can make liquidity vanish in a flash, a stark reminder that no market is ever perfectly safe.
Navigating the Illiquid Territories
Now let's wander over to the other side of the tracks, where markets are thin and liquidity is hard to come by. Penny stocks are the classic cautionary tale. Their super-low prices might look tempting, but the trading volume is often next to nothing. Trying to unload even a small position can be a nightmare, and you might single-handedly crash the price just by hitting the sell button.
Exotic currency pairs, like the USD/THB (U.S. Dollar vs. Thai Baht), are another good example. The spreads are much wider, and the trading volume is just a tiny fraction of what you’d see in the major pairs. This makes them both riskier and more expensive to trade.
For a true picture of illiquidity, look at physical assets. You can't just click a button to sell a multi-million-dollar painting or a luxury mansion. Finding the right buyer at the right price can take months—sometimes years—and the transaction costs are huge.
Even the mighty U.S. Treasury market isn't invincible. During the March 2020 pandemic panic, liquidity dried up so badly that the stress levels were compared to the 2007-09 financial crisis. It was a powerful lesson that systemic shocks can rattle even the deepest, most trusted markets on the planet. If you're curious about these vulnerabilities, you can explore research on Treasury market liquidity events to see just how fragile things can get.
Your Market Liquidity Questions, Answered
Once you get the hang of liquidity, a few common questions always seem to pop up when it's time to apply the theory to a live trading screen. Let's tackle the most frequent ones to clear up any confusion and make sure the concept is crystal clear.
Think of this as your quick-reference guide for navigating the real-world nuances of liquidity.
Can a Market Be Too Liquid?
It's a great question, but for all practical purposes, high liquidity is a trader's best friend. It’s the hallmark of an efficient, stable, and healthy market.
Now, some might argue that in extreme cases, liquidity driven by high-frequency, speculative algorithms can contribute to those sharp, sudden price moves we call "flash crashes." But for the vast majority of retail and professional traders, this is a very minor concern.
Higher liquidity almost always means lower costs, better execution, and reduced risk.
The takeaway is simple: while extreme scenarios exist, you should almost always seek out liquid markets. The benefits of easy entry and exit, tight spreads, and price stability far outweigh the rare risks of "too much" liquidity.
How Does Market Liquidity Affect Options Trading?
Liquidity is absolutely mission-critical in the world of options. You can spot a liquid options contract by two key metrics: high open interest (the total number of outstanding contracts) and high trading volume.
- Liquid Options: These contracts have tight bid-ask spreads, making it much cheaper to get in and out of your trades. You can hit the buy or sell button and expect to get filled quickly at a predictable price.
- Illiquid Options: Here’s where the danger lies. These suffer from massive spreads that can instantly eat into potential profits. Even worse, you might find it impossible to sell your contract—even if the trade is theoretically a winner—simply because there are no buyers on the other side.
Is Trading Volume the Same as Liquidity?
Not exactly, but they are very close cousins. High trading volume is one of the best indicators of high liquidity, since it proves a ton of assets are actively changing hands. It’s a sign of a busy, active market.
However, true market liquidity also needs market depth—that's the volume of buy and sell orders stacked up in the order book right around the current price. An asset could have high trading volume but poor depth, which can lead to price gaps or slippage if a big order hits the market.
Think of it this way: volume is the amount of traffic on the highway, while depth is the number of available lanes. You need both for a smooth ride.
What Is a Liquidity Provider?
A liquidity provider is typically a large financial institution or a designated market maker whose job is to stand ready to both buy and sell a particular asset. They operate in huge volumes, adding depth and order to the market.
By constantly quoting both a buy price (bid) and a sell price (ask), they create a more stable and reliable trading environment for everyone else. Their activity is what helps tighten those bid-ask spreads and ensures the rest of us can execute our orders smoothly without causing major price disruptions.
Gain a decisive edge by tracking market movements with precision. ChartsWatcher provides a dynamic platform with customizable dashboards for alerts, toplists, charts, and news, all synced for deep analysis. Develop, test, and execute your strategies with the real-time data you need. Explore our powerful scanning tools at https://chartswatcher.com.
