What is Bid Ask Spread? Essential Guide for Traders
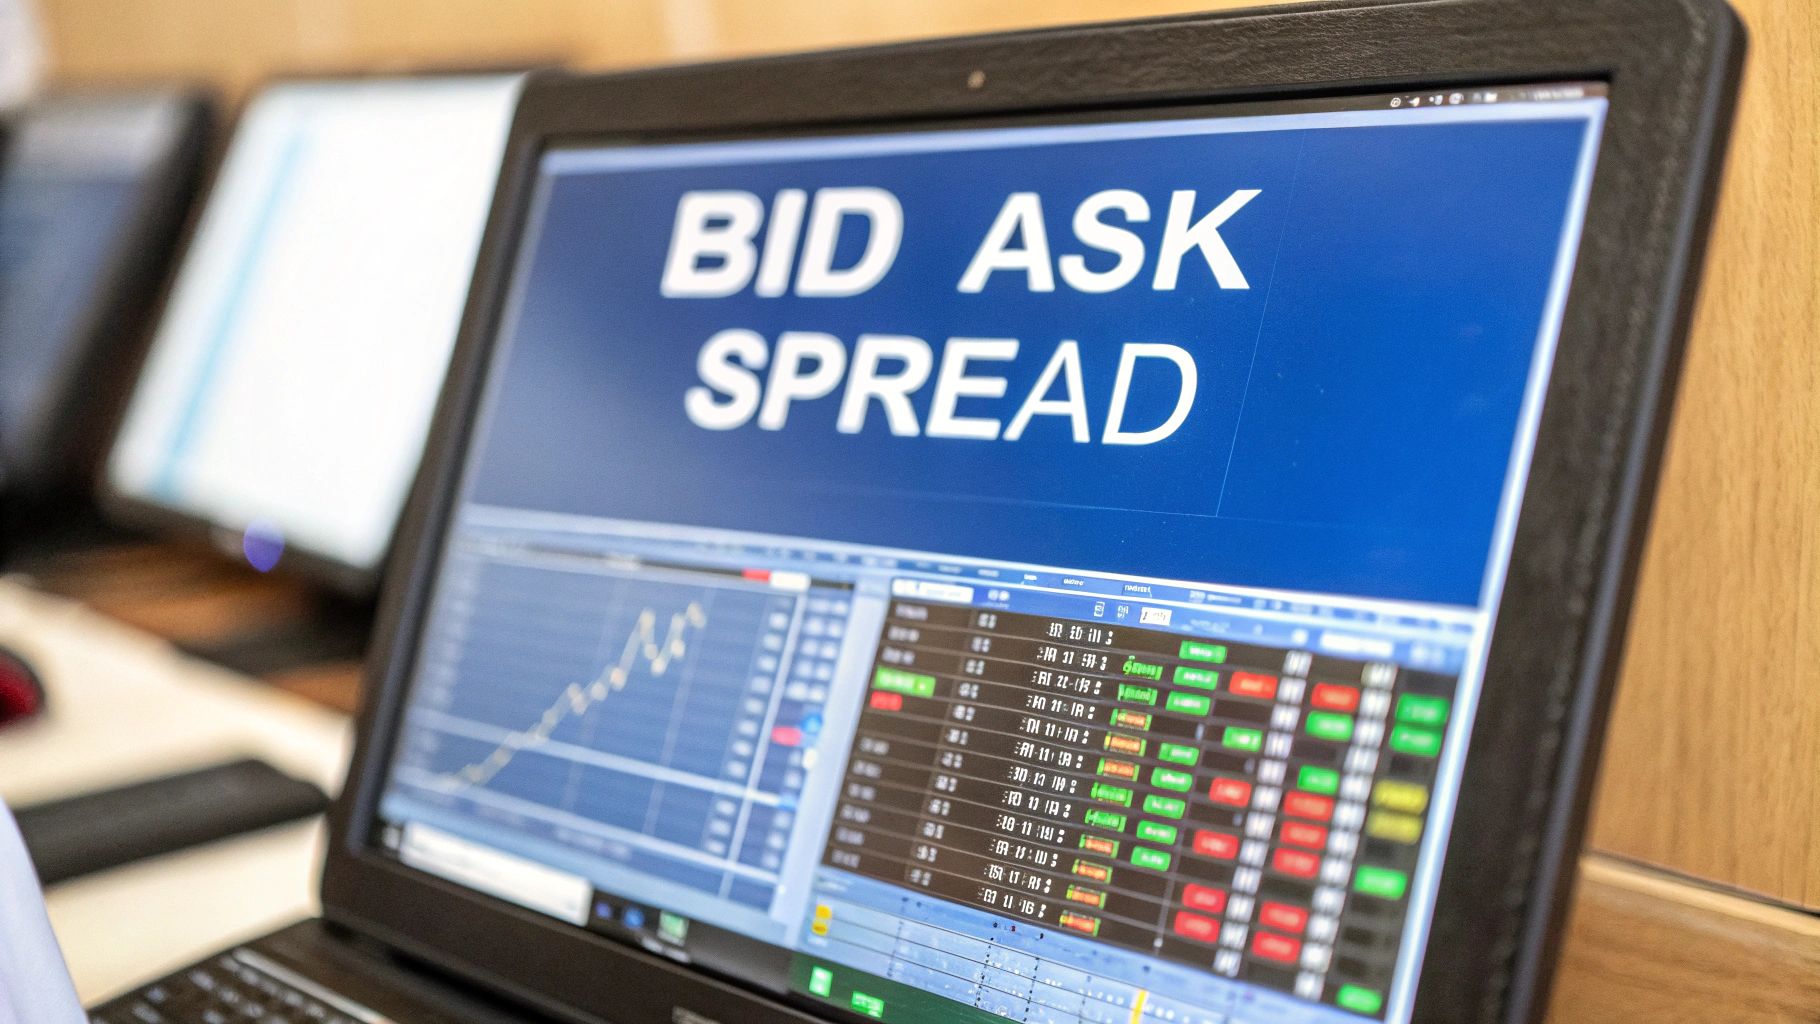
If you’ve ever traded anything, from stocks to options, you’ve encountered the bid-ask spread. It’s the difference between the highest price a buyer is willing to pay for something (the bid) and the lowest price a seller is willing to accept for it (the ask).
This gap isn’t just market noise; it's a direct, though often overlooked, transaction cost. In fact, it's the primary way the "market makers"—the big players who facilitate trading—make their money.
What Are the Bid and Ask Prices, Really?
Before we get tangled up in charts and numbers, let’s use a simple analogy. Think about selling an old car. You list it online for $5,000—that's your ask price. A potential buyer comes along and offers you $4,500—that's their bid. The $500 difference between your asking price and their offer is the spread.
Financial markets work exactly the same way, just at lightning speed with thousands of buyers and sellers. This spread is a built-in cost for every single trade you place. If you want to buy a stock right now, you have to pay the higher ask price. If you need to sell immediately, you have to accept the lower bid price.
Why Does This Price Gap Even Exist?
That gap isn't random. It’s the engine that keeps the market liquid. Market makers are the institutions that stand in the middle, creating a two-sided marketplace. They are constantly buying from sellers at the bid price and turning around to sell to buyers at the ask price.
The spread is their reward for taking on the risk of holding an asset and for making sure there's always someone on the other side of your trade. A tight, or narrow, spread usually means a stock is highly liquid, with tons of trading activity.
Understanding this is the first real step to managing your trading costs. Every time you enter a trade, you instantly start in the red by the amount of the spread. This means the price has to move in your favor just for you to break even.
To get a clearer picture of how these prices appear in a real trading platform, it helps to understand how to read an options chain. Seeing the bids and asks laid out visually is crucial for getting a feel for market depth and liquidity at a glance. Once you start noticing the spread, you can start making smarter, more cost-effective trading decisions.
Key Terms at a Glance
To make these concepts stick, here’s a quick rundown of the terms we've just covered. Think of this as your cheat sheet for understanding the core mechanics of a trade.
| Term | What It Represents | Who It Pertains To |
|---|---|---|
| Bid Price | The highest price a buyer is currently willing to pay for an asset. | You, when you want to sell immediately. |
| Ask Price | The lowest price a seller is currently willing to accept for an asset. | You, when you want to buy immediately. |
| Bid-Ask Spread | The difference between the highest bid and the lowest ask. | The market maker's profit and your trading cost. |
| Market Maker | An institution that provides liquidity by quoting both a buy and a sell price. | The facilitator of the trade. |
Getting these terms down is fundamental. They are the building blocks for understanding how market prices are set and how you interact with them every time you click "buy" or "sell."
How to Calculate the Bid-Ask Spread
Alright, let's get down to brass tacks. Calculating the bid-ask spread isn't some complex Wall Street secret; it's simple subtraction that instantly tells you the cost of making a trade.
All you need are two numbers you can find on any trading platform: the current bid price and the current ask price.
Formula for the Bid-Ask Spread: Ask Price - Bid Price = Spread
This quick calculation shows you the immediate, built-in cost of your trade. Think of it as the hurdle your investment has to clear just to get back to zero.
A Real-World Example
Let's make this tangible. Imagine you're looking at a stock, we'll call it "Company XYZ," and you see these prices on your screen:
- Bid Price: $49.90 (This is the highest price a buyer is currently willing to pay.)
- Ask Price: $50.00 (This is the lowest price a seller is currently willing to accept.)
Plugging these into our formula is a piece of cake:
$50.00 (Ask) - $49.90 (Bid) = $0.10 Spread
So, the spread is 10 cents per share. If you were to buy one share at the ask price of $50.00, your position would instantly show an unrealized loss of $0.10. Why? Because the best price you could immediately sell it for is the bid price, $49.90.
Calculating the Spread as a Percentage
Now, while knowing the dollar amount is helpful, it doesn't give you the full picture. A $0.10 spread on a $10 stock is a massive hurdle, but on a $500 stock, it's almost nothing. To truly understand the impact on your trade, you need to look at it as a percentage.
This simple conversion gives you the context needed to compare trading costs across different assets, no matter their price.
Formula for the Spread Percentage: (Spread / Ask Price) x 100 = Spread Percentage
Let’s go back to our Company XYZ example:
($0.10 / $50.00) x 100 = 0.20%
The spread for Company XYZ is 0.20% of the asking price. This percentage is a far more powerful gauge of liquidity and cost efficiency. For any active trader, especially those profiting from small, quick price moves, hunting for assets with the tightest possible spread percentage is a fundamental part of a winning strategy.
Why the Spread Is a Critical Factor in Your Success
That little gap between the bid and ask prices on your screen? It’s more than just a number. It’s a direct reflection of the market’s health and one of the biggest, yet most overlooked, factors affecting your trading profits.
Think of it like paying a toll to get on the highway. A small toll barely registers, but a big one can make you question if the trip is even worth it. Understanding this "toll" is a game-changer because it tells you two things you absolutely need to know: the market’s current liquidity and the true cost of your trade.
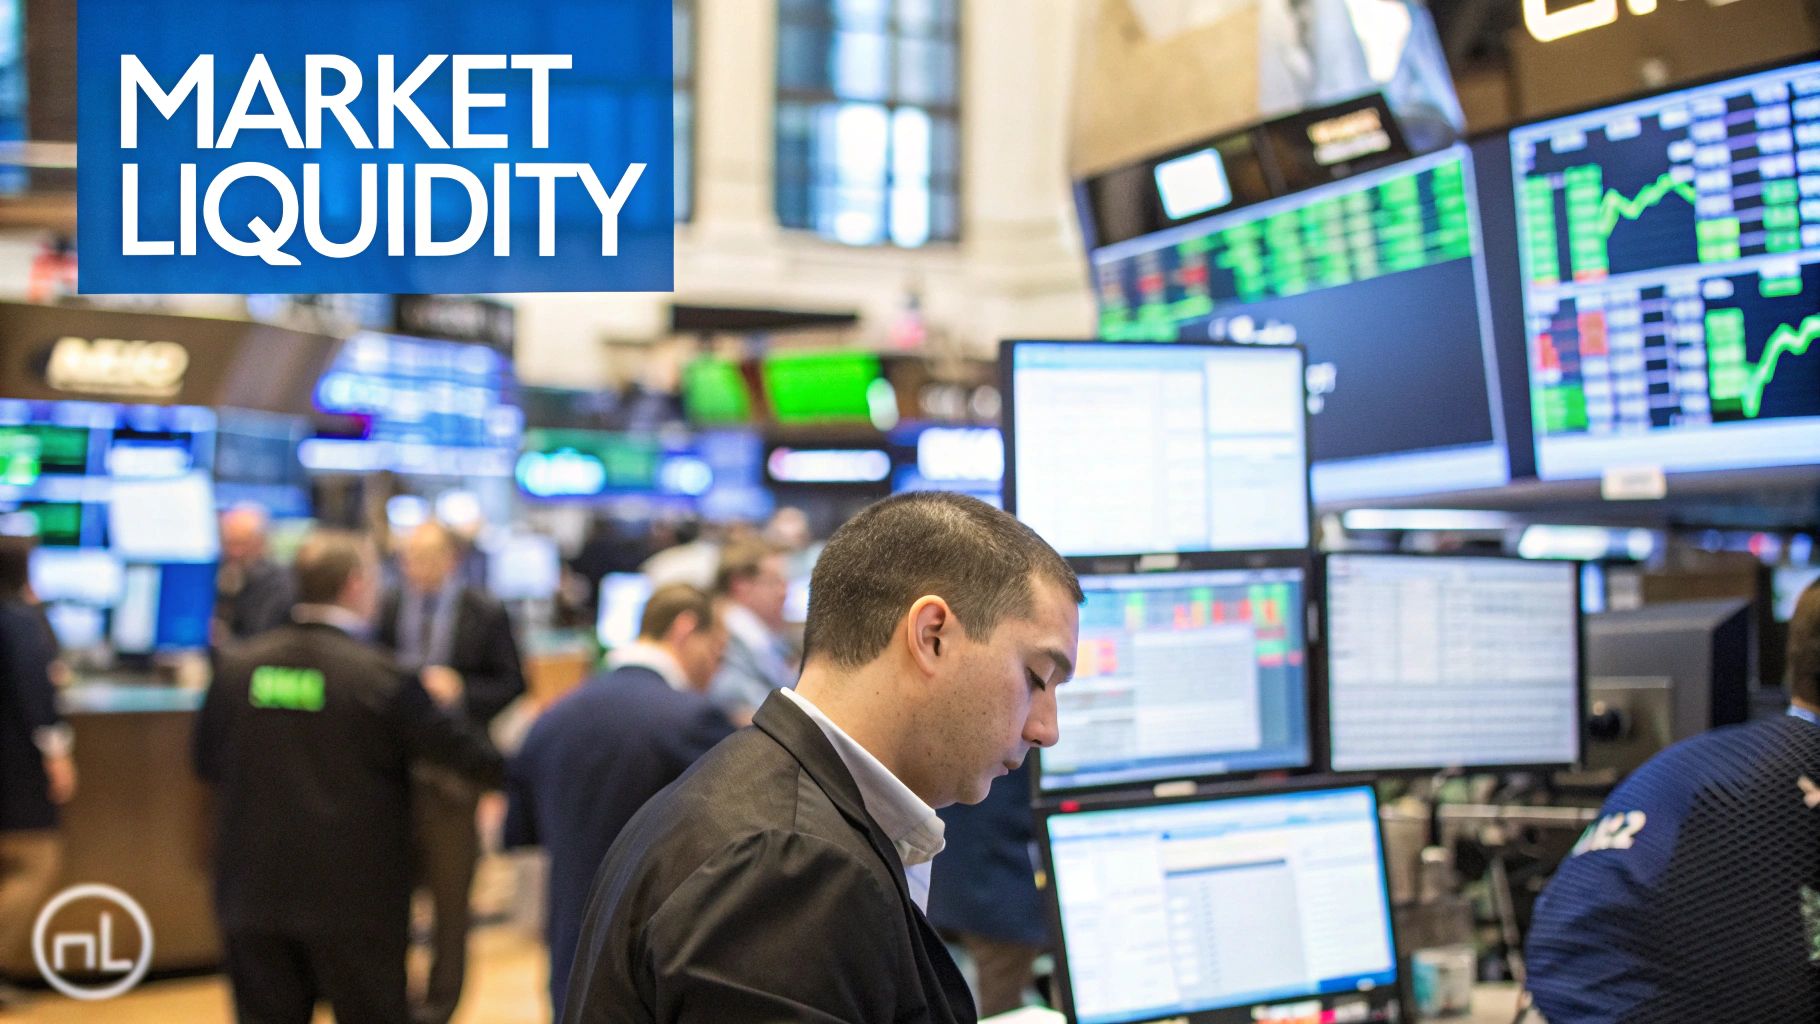
The Spread as a Measure of Liquidity
Liquidity is the lifeblood of any healthy market. It’s a simple measure of how easily you can buy or sell something without the price moving against you. The bid-ask spread is your real-time window into that liquidity.
- Narrow Spread: When the spread is tight, it’s a sign of high liquidity. Lots of buyers and sellers are in the market, actively competing. This means you can get your trades filled quickly and close to the price you see.
- Wide Spread: A wider spread, on the other hand, points to low liquidity. There are fewer people to trade with, which makes it harder to get your order filled and drives up the cost of doing business.
As a trader, you always want high liquidity. It means lower costs and less friction, which is why keeping an eye on the spread is a fundamental skill for navigating the markets.
How the Spread Impacts Your Profitability
Here’s a crucial concept every trader needs to internalize: every single trade you open starts out in the red by the exact amount of the spread.
When you buy an asset at the ask price, the market has to move in your favor just for the bid price to catch up to your entry point. Only then do you break even.
Your asset must not only move in your favor but move enough to overcome the initial cost of the spread. This makes the spread a direct hurdle to profitability on every single position you open.
This hits frequent traders the hardest. If you're in and out of the market dozens of times a day, those small "tolls" add up fast and can seriously eat into your bottom line. Ignoring the spread is like trying to run a race without realizing you’re starting behind the finish line.
Spreads Across Different Markets
The size of the spread isn't the same everywhere; it changes dramatically depending on the asset. A long-term study looking at 23 years of U.S. stock data found a clear link between a company's size and its average spread.
Big, popular stocks on major exchanges like the NYSE almost always have razor-thin spreads, sometimes just a few basis points, because they have massive trading volume and deep liquidity. In contrast, smaller, thinly-traded stocks will naturally have much wider spreads. It’s a reflection of lower liquidity and higher risk for the people making the market. You can dig into the specifics of that research on stock spread dynamics for a deeper dive.
By understanding what the spread really represents, you start to see the market differently. You can set more realistic profit targets, build a smarter risk management plan, and stop just chasing price. It’s a shift toward managing your costs—a hallmark of every disciplined, successful trader.
The Market Forces That Shape the Bid Ask Spread
The bid-ask spread isn't some fixed, static number; it's a living, breathing indicator of market sentiment that widens and narrows in real-time. Three big market forces are always in the mix, deciding whether the spread on an asset is razor-thin or surprisingly wide.
If you really want to read the market’s underlying conditions, you need to get a feel for these three dynamics: liquidity, volatility, and competition.
The Role of Liquidity
Liquidity is, without a doubt, the most powerful factor. Think of it as the amount of traffic in the market for a particular stock or currency.
A super liquid asset, like a popular stock such as Apple (AAPL), has millions of shares changing hands every single day. With that many buyers and sellers all clamoring to trade, the competition is fierce. This pressure forces the gap between the bid and ask prices to become incredibly narrow.
On the other hand, a thinly traded small-cap stock might only see a few thousand shares traded daily. With fewer people in the game, market makers take on a lot more risk just trying to find someone to take the other side of their trades. To make up for that risk and the hassle of offloading their position, they widen the spread. This is exactly why you'll almost always see tighter spreads on well-known assets compared to obscure ones.
This infographic does a great job of showing how spreads can vary wildly across different asset classes, which is a direct reflection of their unique liquidity and risk profiles.
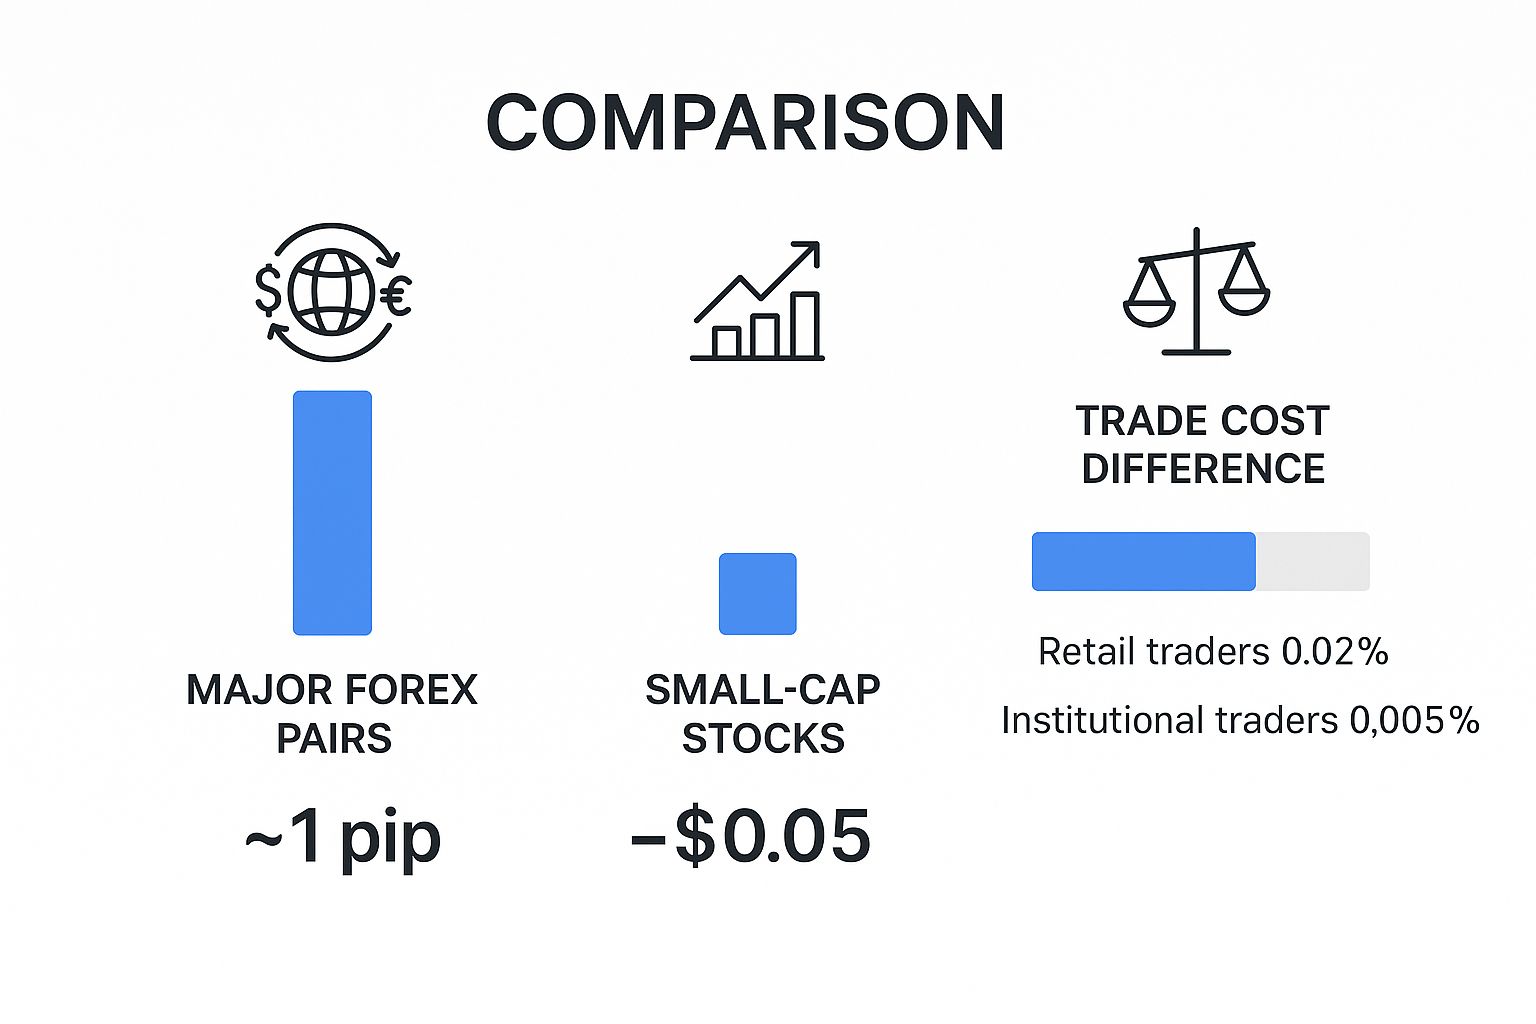
As the graphic shows, high-volume forex pairs have almost nonexistent spreads. Meanwhile, less liquid small-cap stocks carry a much higher transaction cost baked into their spread, something that directly eats into a trader's bottom line.
Volatility and Its Impact
Volatility is the next major player, and it's almost always responsible for widening spreads. When the market is calm and predictable, market makers are confident in their pricing. They keep spreads tight because the risk is low.
But when uncertainty hits—maybe from a surprise earnings report or some major geopolitical news—risk skyrockets.
During these chaotic periods, prices can swing wildly in a matter of seconds. To protect themselves from getting caught on the wrong side of a sudden price move, market makers blow out the spread. This wider gap acts as a buffer, giving them a bigger margin of safety for handling trades in an environment that's become unpredictable. For you, as a trader, a suddenly widening spread can be an early warning that turbulence is right around the corner.
Understanding how different market environments push the spread around is crucial. Here's a quick cheat sheet:
How Market Conditions Affect the Bid Ask Spread
| Market Condition | Impact on Spread | Reason |
|---|---|---|
| High Liquidity | Narrows | More buyers and sellers create intense competition, forcing market makers to offer better prices. |
| Low Liquidity | Widens | Fewer participants increase the risk for market makers, who widen the spread to compensate. |
| High Volatility | Widens | Increased uncertainty and price risk cause market makers to build a larger safety buffer. |
| Low Volatility | Narrows | Predictable price action reduces risk, allowing for more competitive, tighter spreads. |
| Major News Event | Widens Dramatically | The outcome is unknown, causing extreme uncertainty and risk, leading to wider protective spreads. |
Essentially, stable and active markets are a trader's best friend, leading to tighter spreads and lower costs, while choppy or quiet markets do the opposite.
The Power of Competition
Finally, good old-fashioned competition between exchanges and market makers is a powerful force that works in your favor. When a stock is listed on multiple exchanges, those venues have to fight for your business. This pressure forces them to offer tighter spreads to attract traders and trading volume.
A market with healthy competition naturally pushes transaction costs down. More exchanges mean more market makers are vying for your order, resulting in better prices and narrower spreads for everyone.
This isn't just theory; the effect is well-documented. Take the equity options market, for example. Research shows the market's structure has a direct, measurable impact on trading costs. When an option is listed on just a single exchange, the average spread is around 25 cents.
But when that same option gets listed across three competing exchanges, the spread plummets to about 15 cents—a 40% reduction. You can dig into the data yourself by checking out these findings on market structure and see how competition directly benefits traders.
How Technology Squeezed Trading Spreads Down to Almost Nothing
The tiny bid-ask spread you see on your screen today is a modern marvel, and it's easy to take for granted. To really get a feel for how razor-thin today's spreads are, you have to rewind the clock to a time before high-speed internet and automated trading took over the financial world.
It wasn't that long ago that trading floors were pure chaos—a sea of brightly colored jackets, shouting traders, and frantic hand signals. In that world, prices were negotiated face-to-face in crowded pits. The whole process was manual, slow, and far less efficient, which meant the cost of doing business—the spread—was naturally much, much wider for everyone.
The Rise of the Machines
Everything changed with the arrival of electronic communication networks (ECNs) and algorithmic trading. These systems ripped up the old playbook, replacing the physical trading pits with digital order books. Suddenly, the marketplace was more competitive and transparent than ever before.
This digital shift unleashed two powerful forces:
- Blistering Speed: High-frequency trading (HFT) firms jumped in, using complex algorithms to fire off millions of orders in the blink of an eye.
- Fierce Competition: With traders and firms now able to compete electronically from anywhere on the globe, the pressure to offer the tightest possible spreads became intense.
This technological arms race effectively crushed spreads, shrinking them from dollars and cents down to mere fractions of a penny on the most popular stocks. The result was a massive drop in transaction costs, which has made the markets more accessible and fair for everyday retail traders.
A Truly Massive Transformation
This isn't just a nostalgic story; the numbers tell a dramatic tale. Over the last thirty years, the move from manual to automated trading has had a staggering effect on market efficiency. Back in the 1990s, research shows that average bid-ask spreads for major stocks were around 60 basis points. By 2021, thanks to automation, those same spreads had collapsed to just 1 to 2 basis points. That's an incredible decline. You can dive into the full analysis of how automated trading has narrowed spreads to see the data for yourself.
The rise of electronic markets and algorithmic trading has been the single greatest force in reducing the bid-ask spread, directly lowering costs for investors and traders.
And this evolution isn't over. As technology keeps pushing forward, automation and competition will continue to mold the market's structure. Knowing this history gives you crucial context for the data you see on your screen, including the deep order flow you'll find when you learn how to read Level 2 data.
Using the Spread to Your Tactical Advantage
Knowing what the bid-ask spread is is one thing. Actually using it as a live market indicator is where that knowledge turns into a real trading edge. This gap isn't just the cost of doing business—it’s a powerful, real-time signal of market sentiment, liquidity, and potential volatility.
Think of a sudden widening of the spread as an early warning flare. It often means liquidity is drying up or a spike in volatility is just around the corner, sometimes moments before a big news event hits the wires. By keeping an eye on the spread, you can spot these shifts as they happen and adjust your game plan, maybe sidestepping a bad entry or protecting a position you already hold.
Tailoring Your Strategy to the Spread
How much you care about the spread really depends on your trading style. For day traders and scalpers, whose profits hinge on tiny, rapid price moves, a tight spread isn't just nice to have—it's essential. A wide spread can completely devour the potential profit on a quick trade before you even get started.
On the other hand, a long-term investor planning to hold a position for months or years can be a bit more relaxed. Because their profit targets are so much larger, the initial cost of crossing the spread is just a tiny fraction of their expected return, making it far less of a dealbreaker.
The narrower the spread, the healthier the market's liquidity. For active traders, making it a rule to only trade assets with the tightest spreads possible is fundamental to managing costs and boosting your bottom line.
Practical Tips for Spread Management
You can—and should—actively manage how the bid-ask spread affects your trading. One of the most effective tactics is simply being mindful of when you trade. Spreads almost always get wider when trading volume is low.
This typically happens during:
- Pre-market and after-hours sessions: With fewer traders online, liquidity is thin, and spreads can get significantly wider.
- Major holidays: Trading activity often dries up, which means less competitive pricing from market makers.
- Mid-day lulls: Some markets see a dip in action around lunchtime, which can temporarily push spreads out.
By sticking to peak market hours when volume is highest, you're ensuring you operate in the most liquid and cost-effective environment. This simple discipline helps you lock in better entry and exit points, turning what most people see as a cost into a genuine tactical advantage.
Answering Your Top Questions About the Bid-Ask Spread
Even after you get the basic idea down, a few specific questions always seem to pop up. Think of this as the "behind the scenes" tour of how markets really work.
Let's dig into some of the most common ones. Getting these details straight will help you trade with a lot more confidence.
Can the Bid Price Ever Be Higher Than the Ask Price?
Nope. In a healthy, functioning market, this is impossible. The bid is the absolute highest price a buyer is willing to pay, while the ask is the lowest price a seller is willing to accept. They are two sides of the same coin.
If the bid ever somehow crept above the ask, it would trigger a guaranteed, risk-free profit opportunity called arbitrage. High-speed trading algorithms would instantly jump on this glitch, buying at the lower ask and selling at the higher bid until the prices snapped back into their proper order. This all happens in the blink of an eye—literally milliseconds.
So, Who Actually Pockets the Money From the Spread?
The bid-ask spread is the main way market makers earn their keep. These are the big financial firms and institutions that are responsible for keeping the market liquid.
By constantly offering to both buy (at the bid) and sell (at the ask), they make sure there's always someone to trade with. They make their profit on that tiny sliver of a difference, buying from sellers at the bid and turning around to sell to buyers at the ask.
Does the Spread Change During the Day?
Absolutely—it's constantly in motion. The spread isn't a fixed number; it's a living, breathing indicator of current market sentiment.
You'll often see it widen during moments of high volatility, like right after a major economic news release. It also gets wider when liquidity dries up, which is common outside of normal trading hours.
On the flip side, the spread tends to get very tight, or narrow, when trading volume is high and the market is calm and stable. This dynamic nature is exactly why traders need to keep an eye on it. It’s also a close cousin to another important trading cost; you can learn more about what is slippage in trading to see how the price you get can differ from the price you expect.
Ready to turn market data into actionable insights? With ChartsWatcher, you can monitor spreads, set custom alerts, and build strategies based on real-time market conditions. See how our powerful scanning and analysis tools can give you an edge. Explore the platform at https://chartswatcher.com.
