How to Read Level 2 Data: A Complete Guide for Beginners
To really get a handle on reading Level 2 data, you have to look past the surface-level prices and see the raw supply and demand underneath. Think of it as a live map of market intent, showing you the full queue of buy and sell orders waiting at different price points. This kind of depth gives you a strategic edge that standard price charts just can't offer.
Decoding the Order Book: What Level 2 Data Really Shows
Picture the market as a fast-paced auction. Standard Level 1 data only shows you the current highest bid and the lowest asking price. It’s useful, sure, but it's an incredibly narrow view of what's actually happening. It tells you where the price is right now, but offers very few clues about where it might be headed next.
This is where Level 2 data, often called market depth, completely changes the game. It peels back the curtain on the entire order book, showing you multiple price levels and the total share volume stacked up at each one. This fuller picture of liquidity helps traders get a much better feel for market sentiment and potential price moves before they happen.
The Core Components of Level 2
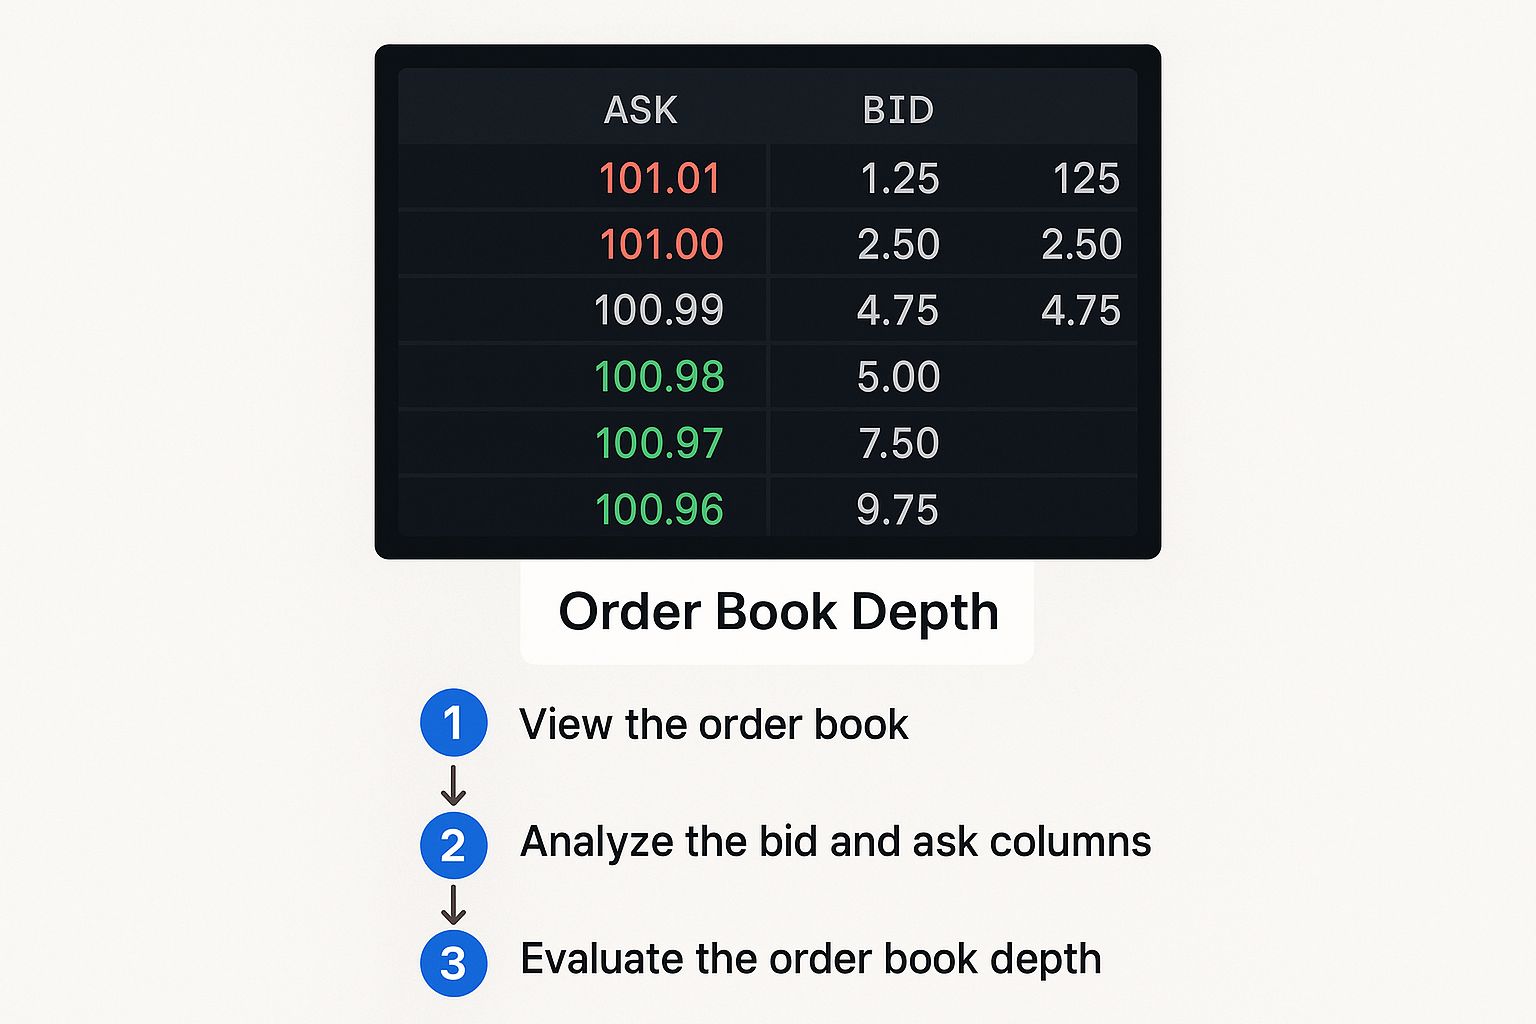
To start reading the order book like a pro, you need to know its four key parts. These elements work together to paint a vivid picture of the immediate supply and demand dynamics for any given stock.
- Bid: This is the price where buyers are lined up, ready to purchase shares. The bid side of the order book shows a stack of these buy orders at descending price levels.
- Ask: This is the price where sellers are offering their shares. The ask side displays a stack of sell orders at ascending price levels.
- Size: This number, typically next to the bid or ask price, shows how many shares are up for grabs at that specific price. It's often shown in lots of 100 shares (so a size of 5 means 500 shares).
- MMID (Market Maker ID): This little code identifies the market maker or ECN (Electronic Communication Network) that placed the order. Keeping an eye on MMIDs can help you spot activity from specific institutions or trading desks.
The real power of Level 2 isn't just seeing these numbers, but watching how they change in real-time. A large order suddenly appearing or vanishing can signal an impending price move long before it ever prints on a chart.
Seeing Beyond the Best Price
The difference between Level 1 and Level 2 is like the difference between seeing a single wave and understanding the entire ocean tide. While Level 1 is reactive, Level 2 lets you be proactive.
To help clarify the distinction, here’s a quick breakdown:
Level 1 vs. Level 2 Data At a Glance
| Feature | Level 1 Data | Level 2 Data |
|---|---|---|
| Best Bid/Ask | ✅ Yes | ✅ Yes |
| Market Depth | ❌ No | ✅ Yes (multiple price levels) |
| Order Size at Each Level | ❌ No | ✅ Yes (total shares) |
| Market Maker ID (MMID) | ❌ No | ✅ Yes |
| Strategic Insight | Basic price quote | Deep view of supply & demand |
This table really highlights the jump in information you get. With Level 2, you're no longer just reacting to the price; you're anticipating it.
By seeing deep stacks of buy orders (support) or sell orders (resistance), you can anticipate where a stock's price might stall out or find a floor. This is the absolute foundation of reading order flow. For a deeper dive into its strategic advantages, check out our complete guide to understanding Level 2 data for a trading edge.
Designing Your Screen for Optimal Analysis
How you see your Level 2 data is just as important as the data itself. Trust me, I've seen it a thousand times: a cluttered, chaotic screen leads to analysis paralysis and rushed, bad decisions. Your goal should be to design a workspace that cuts through the noise so you can interpret order book dynamics instantly and accurately.
A lot of traders, myself included, start with a classic "ladder" view. It’s intuitive, with bids on one side and asks on the other, making it a great starting point. As you get more experienced, though, you might find other layouts work better for you. For instance, a centralized "price dome" or "price-arc" can give you a more integrated view, showing bids and asks converging on the current price. It's worth experimenting with these layouts in ChartsWatcher to see which one clicks with your cognitive style.
Tailoring Your View for Clarity
Just picking a layout isn't enough. The real edge comes from customization. Think of it like fine-tuning your instrument—you want the most important information to pop while everything else fades into the background.
A powerful way to do this is with color-coding. You can set up rules to highlight orders above a certain size, say, anything over 10,000 shares. When a massive block order suddenly appears, it'll jump right off the screen. This is how you spot potential institutional activity you might otherwise miss in the blink of an eye.
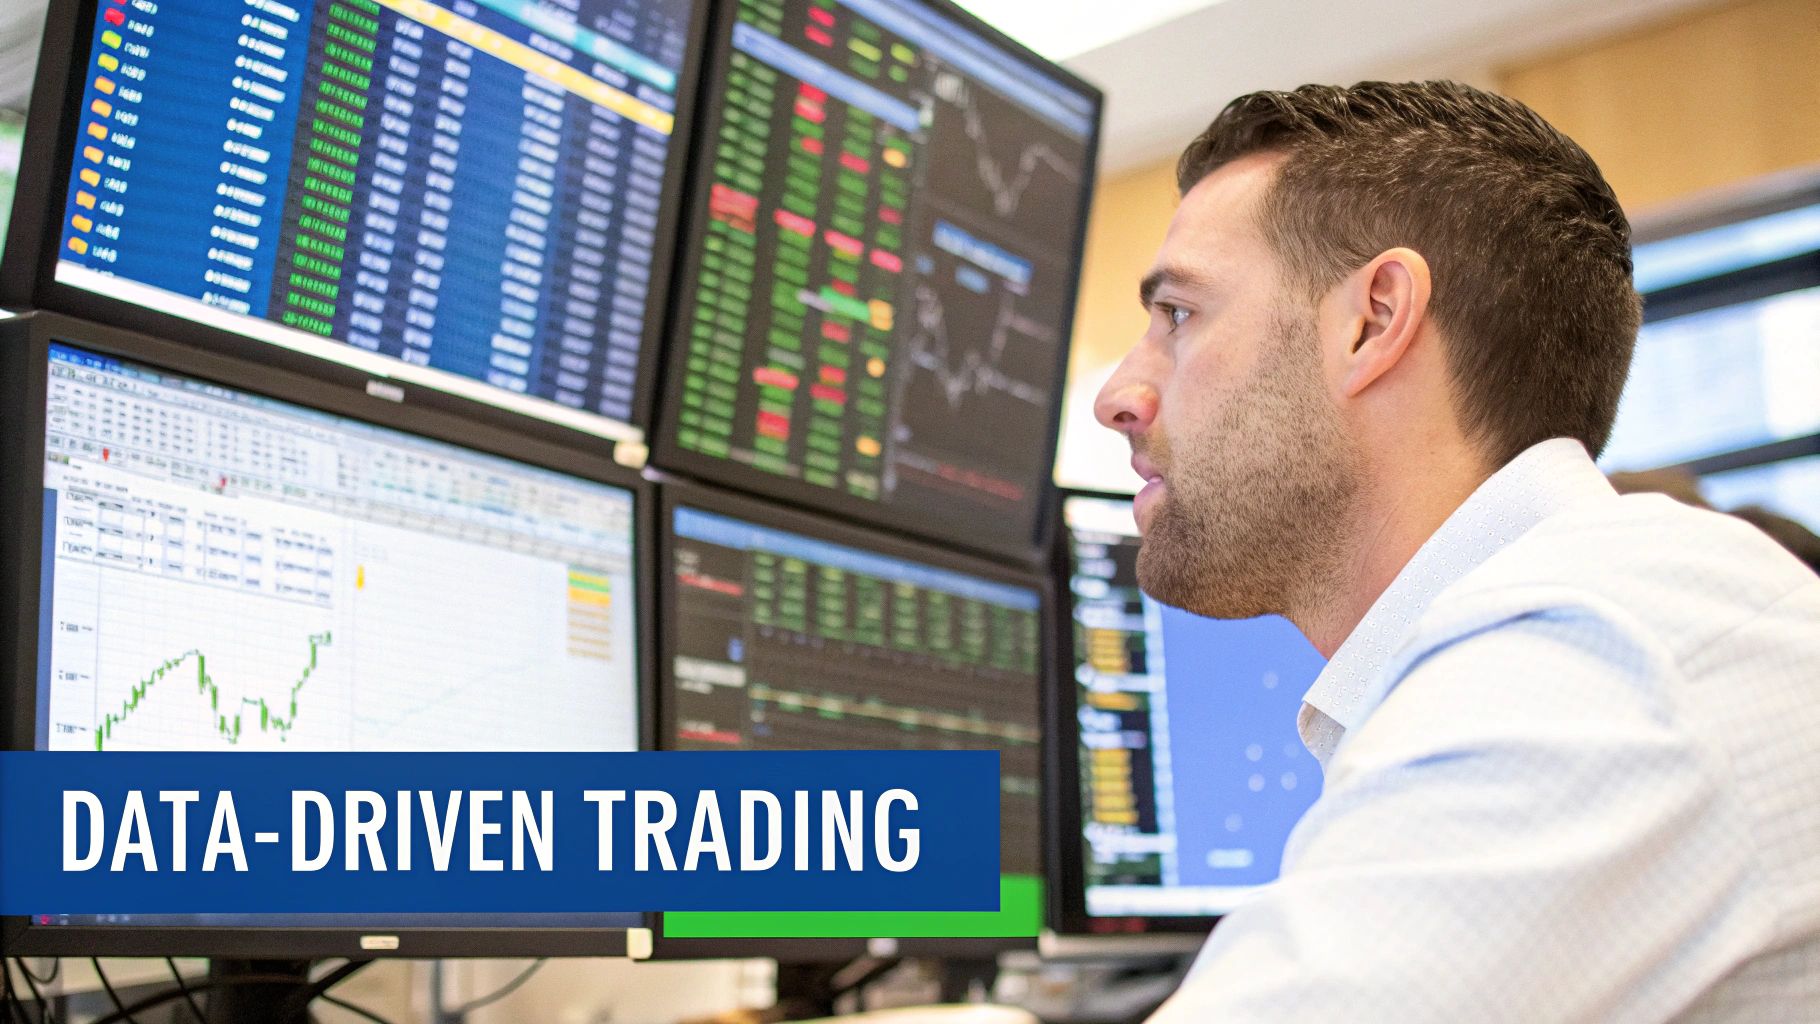
This image shows a trading terminal with a really well-organized order book that illustrates market depth perfectly.
Notice how it clearly separates the bid and ask columns, with order sizes stacked at different price levels. This makes it incredibly easy to spot those areas of significant liquidity.
Filtering and Alerts
Filtering is another game-changer. Instead of watching every single market maker, you can set up your window to filter by specific ECNs. If you know from experience that a particular market maker often handles the big institutional orders, isolating their activity gives you a much cleaner signal to follow.
Pro Tip: Don't just stare at the screen—make the screen watch for you. Set up smart alerts for major shifts in the order book. You can create an alert for when bid or ask depth at a key price level suddenly swells by more than 50%, or when a large order gets pulled. This frees you from being glued to your monitor and ensures you never miss a critical event.
This whole process of designing your screen directly feeds into your ability to analyze price action. A clear view of market depth is a massive piece of the puzzle, but it's still just one piece. For more on putting it all together, check out our guide on how to analyze stock charts with proven techniques for success. Building a dashboard that works for you is fundamental to learning how to read Level 2 data like a pro.
Spotting Key Patterns in the Order Flow
Now that your screen is optimized for clarity, it’s time to move beyond passively watching the market and start actively reading its story. This is where you learn to translate the flashing numbers and order blocks into actionable intelligence. Level 2 data reveals critical patterns that can signal trading opportunities long before they ever appear on a standard price chart.
The first and most fundamental pattern is spotting genuine support and resistance. Keep an eye out for unusually large order blocks stacking up at specific price levels. A massive wall of buy orders on the bid side can act as a powerful price floor, while a dense cluster of sell orders on the ask side often creates a ceiling. The trick is to watch how the market reacts as the price gets close to these walls.
Reading Absorption and Reversals
One of the most powerful signals you can find in the order book is absorption. Picture this: a stock is falling hard toward a large bid wall you’ve identified. You see a flurry of sell orders hitting the bids, but that large buy order doesn’t seem to shrink—in fact, it keeps refilling. This is a classic sign that a large, determined buyer is absorbing all the selling pressure at that price.
This is often a precursor to a sharp reversal. The sellers are basically throwing everything they have at an immovable object, and once their pressure fizzles out, the path of least resistance is up. The same logic applies at resistance levels when a huge ask order soaks up all the incoming buy orders, hinting at a potential top.
Pro traders use advanced tools to monitor these real-time order book shifts, often filtering by exchange to spot hidden dynamics. This lets them see when large sell orders are being methodically absorbed by tons of smaller buy orders, a clear signal of underlying strength. This kind of deep analysis was especially critical during the volatile markets of 2020–2022, where huge price moves were often preceded by these shifts in order book dynamics. For more detail on how institutions approach this, you can check out what Interactive Brokers says about Level 2 data.
Unmasking Spoofing and Iceberg Orders
You have to remember that not all large orders are genuine. Spoofing is a deceptive tactic where a trader places a large order they have zero intention of ever letting fill. The goal is to create a false sense of supply or demand to trick others into trading. For instance, a spoofer might flash a huge sell order to scare people into selling, only to pull the order at the last second and scoop up shares at the lower prices they just created.
The telltale sign of spoofing is a large order that consistently disappears right as the price gets near it. In ChartsWatcher, you can watch these orders closely. If a 50,000 share sell wall vanishes the moment the bid touches the price just below it, you've likely spotted a spoofer in action.
Just as important are iceberg orders. These are legitimate large orders that have been intentionally broken down into smaller, visible chunks to hide the true size. An institution might want to buy 100,000 shares but will only show orders for 5,000 shares at a time.
Here’s how you can spot them:
- Constant Refreshing: You’ll notice a bid or ask of a specific size (like 5,000 shares) get filled, only to be immediately replaced by another order of the exact same size at the exact same price.
- Tape Confirmation: The real giveaway is when you cross-reference this with your Time & Sales window. If you see a continuous stream of trades executing at that price level but the visible order size never goes down, you're almost certainly looking at an iceberg.
Spotting an iceberg order is a huge tell. It means a large institution is patiently and quietly accumulating or distributing a massive position. This is a high-conviction signal that they expect a significant move to happen.
Combining Level 2 with Time and Sales Data
While your Level 2 screen shows the market's intentions, the Time & Sales window—what old-school traders call "the tape"—shows you what's actually happening.
Think of Level 2 as the battle plan and the tape as the live report from the front lines. Honestly, using one without the other is like trading with one eye closed. You’re missing half the story.
The real skill comes from learning to cross-reference these two powerful tools to either confirm or completely invalidate your trading ideas. Level 2 might show a monster sell wall at $50.50, suggesting some serious resistance. But that’s just a plan. The real question is: what does the tape show you as the price gets there?
Reading the Tape to Confirm Order Flow
This is where your understanding of how to read level 2 data goes from academic to genuinely effective. You're no longer just looking at static orders on a ladder; you're seeing how real, executed trades interact with those orders, second by second.
Let's go back to that big sell wall at $50.50. As the price ticks up, you need to be glued to your Time & Sales window.
- Are the trades printing in red, showing that sellers are aggressively hitting the bid? This would tell you the wall is holding firm and sellers have the upper hand.
- But what if you suddenly see a flood of large green prints? This is the tell. It means buyers are relentlessly taking the ask, literally chewing through that supposed wall of sellers. This is a huge signal that the resistance is much weaker than it looks and is likely about to break.
The tape is your truth detector. A huge sell order on the book means absolutely nothing if you see buyers on the tape absorbing every share offered. The executed trades are the final verdict in the battle between buyers and sellers.
A Practical Scenario for Validating Strength
Let’s walk through a common setup you might see using a tool like ChartsWatcher. Imagine you're watching a stock and notice a thick cluster of bids stacking up at $49.00, painting a clear picture of support. To see if it's real, you immediately shift your focus to the tape.
Here’s the confirmation you're looking for as the price dips toward that $49.00 level:
- Weak Selling: The prints on the tape are small and sporadic. The sellers just don't seem to have much conviction.
- Aggressive Bids: You start seeing large buy orders executing right at the bid price. This is evidence of buyers stepping up to defend the level.
- The "Lift": Then, all of a sudden, the tape flashes green as buyers start taking the offer at $49.01, $49.02, and so on. This is the moment you're waiting for—it shows the selling pressure has been fully absorbed, and buyers are now taking control.
This combination—a strong bid wall on Level 2 plus aggressive buying confirmed on the tape—gives you a much higher-confidence entry for a long trade. You’ve gone from just seeing a static support level to witnessing its successful defense in real time. This dynamic interplay is the very essence of advanced order flow analysis.
Common Mistakes Traders Make With Level 2 Data
Getting your hands on Level 2 data through a platform like ChartsWatcher is just the first step. The real challenge—and where most new traders stumble—is learning to interpret that firehose of information without falling into the classic psychological traps.
One of the easiest mistakes to make is just plain quote-watching. You get mesmerized by the flashing numbers, the constant updates, and the speed of it all. This sensory overload often triggers emotional, gut-reaction trades instead of strategic ones. You get lost in the noise and completely forget your original game plan.
Focusing Only on the Top of the Book
Another huge pitfall is staring exclusively at the top three or five price levels. Yes, the inside bid and ask are important, but the real story is often buried deeper in the book. This is where the big players—the institutions—tend to hide their intentions.
If you're only watching the surface, you'll completely miss that massive bid wall forming ten levels down. That wall could be the very thing that stops a stock from tanking, but you won't see it coming until it's too late. To truly learn how to read level 2 data, you have to analyze its full depth, not just what's happening at the front of the line.
Misinterpreting Spoofing and Fake Walls
You have to approach large orders with a healthy dose of skepticism, especially when they pop up out of nowhere near a key price level. A common manipulation tactic is spoofing, where a trader flashes a huge order they have no intention of ever filling. Their only goal is to create a false sense of supply or demand to bait other traders into making a move.
Picture this: a massive sell order appears, sparking panic as traders rush to sell. Then, just before the price hits that level, the order vanishes. The spoofer then swoops in and buys up all those cheap shares. If you see a large wall that repeatedly disappears right before it's tested, you're probably witnessing manipulation. Don't take the bait.
Ignoring the Broader Market Context
Maybe the single costliest mistake is treating Level 2 data as a crystal ball. It’s an incredibly insightful tool, but it's still just one piece of the puzzle. An order book viewed in a vacuum, without any other context, can be dangerously misleading.
Always gut-check what the order book is telling you against other critical data points. Does it align with the chart patterns? Does the volume confirm the move? What is the overall market doing?
To help you sidestep these common but costly errors, here’s a quick summary of the major pitfalls and how to navigate them.
Level 2 Trading Pitfalls and Solutions
This table breaks down the frequent blunders traders make with Level 2 data and offers clear, actionable ways to avoid them, leading to more effective and less emotional trading.
| Common Mistake | Why It's a Problem | How to Avoid It |
|---|---|---|
| Quote-Watching | Leads to emotional, impulsive trades based on noise. | Focus on significant shifts in depth, not every tick. |
| Ignoring Deep Orders | You miss major support/resistance from institutions. | Always scan the full depth of the order book, not just the top levels. |
| Falling for Spoofing | You get tricked by fake orders designed to manipulate price. | Watch if large orders disappear as price approaches them. |
| Using It in Isolation | The order book can give false signals without context. | Always combine Level 2 with chart patterns, volume, and the tape. |
Ultimately, Level 2 data shines when it’s integrated into a holistic trading strategy. It should be used to confirm or challenge what you're already seeing on the price chart and in the volume data—not as your sole reason for pulling the trigger.
Common Questions on Level 2 Data
Even after you get the hang of the basics, some practical questions always come up when you start using a new tool in your trading. Learning how to read level 2 data is a journey, not a destination, and tackling these common sticking points can help you figure out exactly how it fits into your strategy.
Is Level 2 Data Even Useful for Swing Trading?
That’s a fair question. Level 2 is the absolute lifeblood for day traders and scalpers, but for swing traders, its role is a bit more subtle. When you’re holding for days or weeks, the minute-by-minute order flow doesn't seem as important.
But here’s where it becomes a game-changer: timing your entries and exits.
Imagine you've used technical analysis to pinpoint a key support level for a stock you want to buy. As the price drifts down toward that level over a few days, you can switch on the Level 2 view. If you see large bids starting to stack up and absorb all the selling right at your target price, that’s your confirmation. It’s powerful proof that your idea is solid, helping you get a much sharper entry than just tossing a blind limit order out there.
How Much Does Level 2 Data Cost?
The price for Level 2 access is all over the map. Some brokers throw it in for free, while others charge hundreds of dollars a month for professional, multi-exchange feeds. The good news is that many modern platforms, like ChartsWatcher, now bundle it into their regular subscription plans, making it far more accessible than it used to be.
Is it worth it for a new trader? If you're serious about active trading, absolutely. Think of it as an investment in your own education. Trading without the order book is like driving with a foggy windshield—you might get where you're going, but you're missing critical information that could help you avoid a disaster.
Even if your strategy isn't about high-frequency moves, the context it provides is priceless. It helps you understand why the market is moving, not just that it's moving. The cost quickly becomes trivial when you consider the expensive mistakes it can help you sidestep.
Can I Just Trade Using Level 2 Data Alone?
Absolutely not. In fact, trying to do so is one of the fastest ways I've seen traders burn through their accounts. Relying only on Level 2 is like trying to build a house with nothing but a hammer. It's a fantastic tool, but it's just one piece of the puzzle.
Remember, the order book is fluid and can be manipulated. Huge orders can be "spoofed" by algorithms to create a false sense of buying or selling pressure, only to disappear moments later. If you aren't cross-referencing this with other information, you're trading with a massive blind spot.
Level 2 data should always be used as part of a confluence strategy. It works best when combined with other signals. Ask yourself:
- Chart Patterns: Does the order flow confirm the breakout or breakdown pattern I see on the chart?
- Volume Analysis: Is there real trading volume behind the move, or is it just a few orders pushing the price?
- Time & Sales: Is the tape confirming that buyers are aggressively lifting offers or that sellers are smacking the bids?
When all these pieces line up, your trade idea transforms from a simple guess into a high-probability setup.
Ready to see the market with professional-grade clarity? ChartsWatcher gives you the advanced Level 2 data and customizable tools you need to spot opportunities before they happen. Start analyzing the order book like a pro and take your trading to the next level. Explore ChartsWatcher's features today.
