Understanding Level 2 Market Data: Your Trading Edge Guide
What Level 2 Data Really Means For Your Trading Success
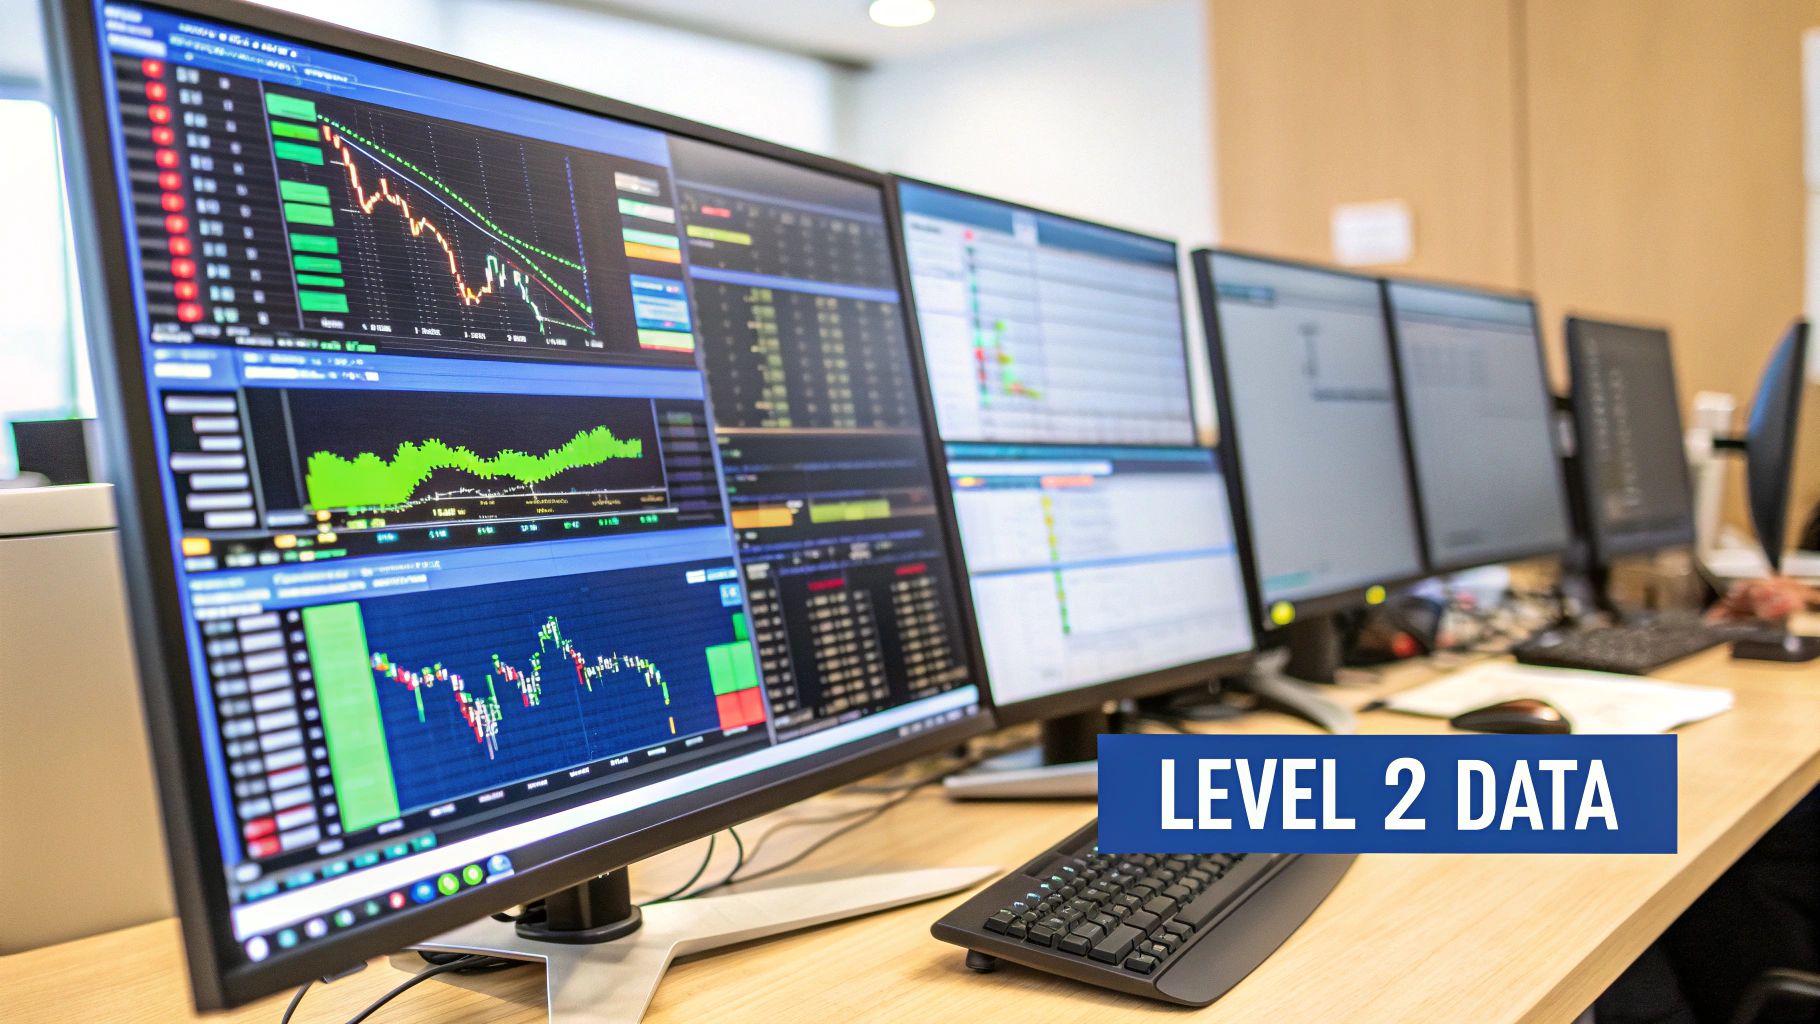
Level 2 market data offers traders a real-time view of market activity, providing a significant advantage over basic stock quotes. It's like looking behind the curtain to see the mechanics of the market in action. This depth of information is increasingly vital for serious traders seeking to make more informed decisions. So, how can understanding Level 2 data boost your trading success?
One of the primary benefits of Level 2 data is its ability to reveal true market sentiment. Instead of just showing price, like basic stock charts, Level 2 data reveals the full order book. This includes the bid and ask prices at multiple levels, along with their corresponding volumes. This granular view of buyer and seller activity provides a much clearer picture than simply looking at the current best bid and ask. Traders can then identify potential opportunities and make more accurate predictions about future price action.
Level 2 data is essential for traders wanting a deeper market understanding. Introduced in 1983 as the Nasdaq Quotation Dissemination Service (NQDS), it provides real-time access to the NASDAQ order book. This shows market depth and momentum through bid and ask prices from registered market makers. Learn more about Level 2 data here: Level 2
Unveiling Hidden Opportunities
Imagine a stock's price is consolidating. A basic chart might suggest market indecision. But Level 2 data could show a large number of buy orders accumulating just below the current price. This signals substantial buying pressure and a potential breakout. Armed with this information, traders can anticipate the move and position themselves accordingly, something a basic chart wouldn't reveal.
Level 2 data also helps traders avoid being fooled by artificial walls. These are large orders placed to create a false impression of supply or demand. By seeing the full order book, traders can assess the true market depth and avoid decisions based on manipulated information. This is especially crucial in fast-moving markets, where quick decisions are paramount.
The Professional's Edge
Professional traders know price alone doesn't tell the whole story. They use Level 2 data to gain an edge by:
- Identifying liquidity clusters: Finding areas of high activity with rapid order filling.
- Understanding order sizes: Distinguishing between small retail orders and large institutional moves.
- Recognizing market makers: Tracking the actions of key players influencing price.
This level of detail is invaluable in volatile markets. For example, seeing a large sell order absorbed by multiple smaller buy orders can indicate underlying strength and potential upward movement. This kind of insight is simply not available from basic price charts. Mastering Level 2 data unlocks a wealth of information, empowering traders to make more confident, data-driven decisions.
Decoding The Order Book Like A Market Detective
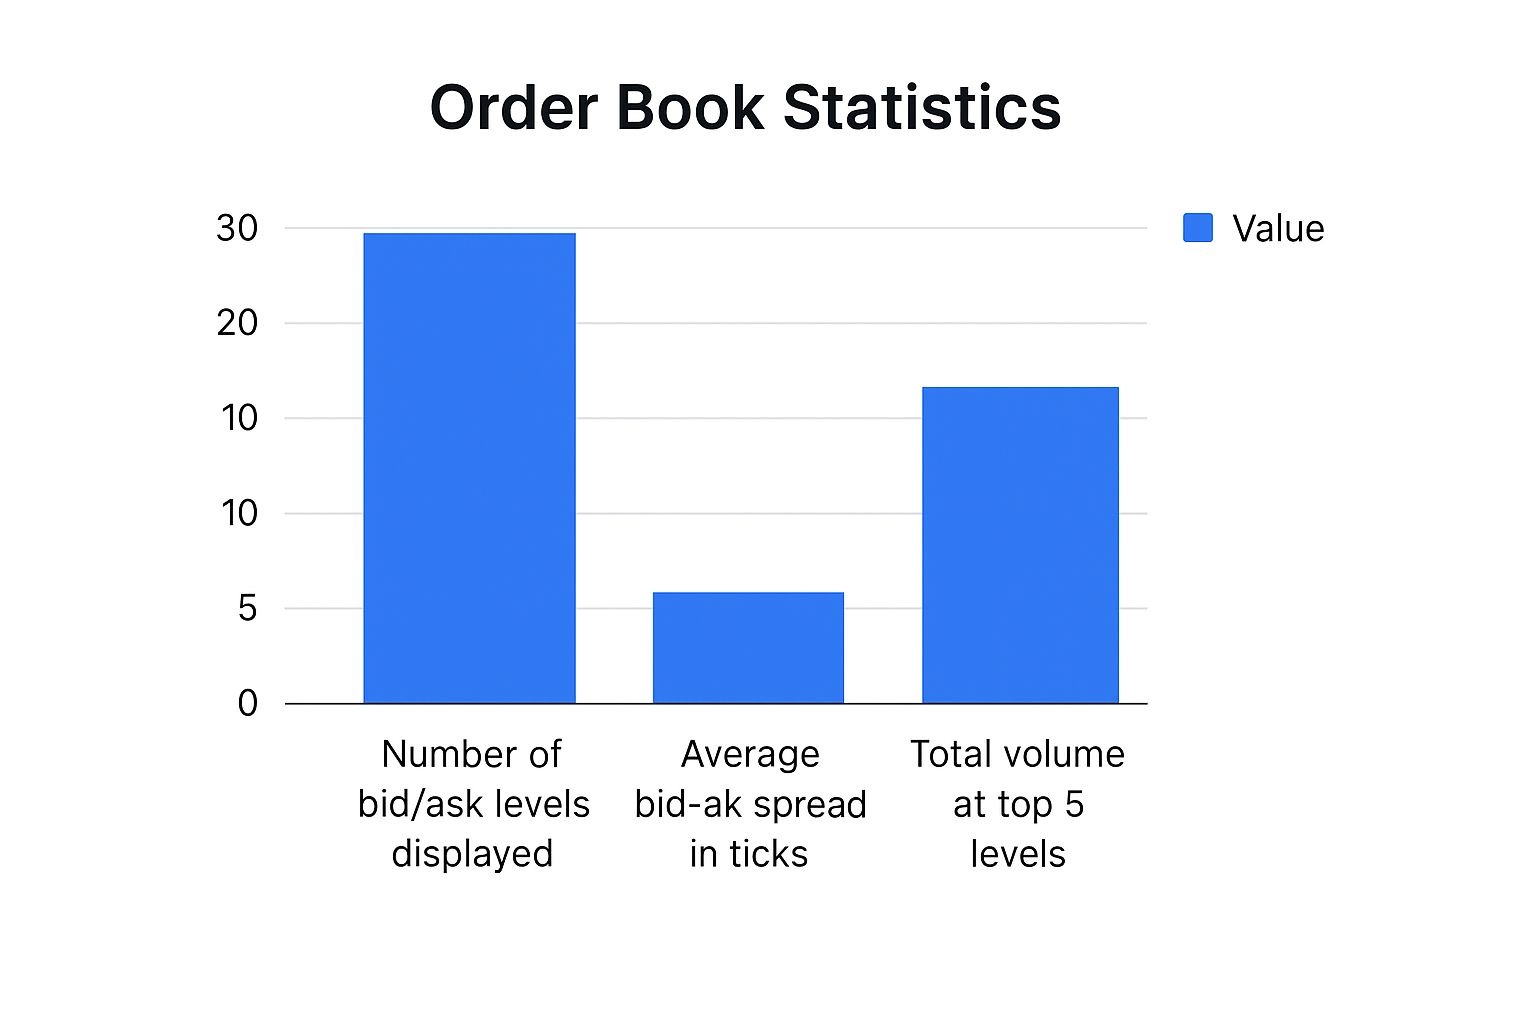
The infographic above illustrates the number of bid/ask levels, the average bid-ask spread, and the total volume within the top 5 levels of the order book. This gives a quick overview of market depth and liquidity.
A higher number of bid/ask levels and more volume at the top indicate higher liquidity. A tighter bid-ask spread can suggest stable trading conditions. These factors are crucial for understanding Level 2 market data. This section will teach you how to analyze this information, allowing a deeper understanding of how the market works. Consider the order book a powerful tool, exposing information hidden from those relying solely on basic price charts. We'll cover everything step-by-step, from understanding bid-ask spreads to identifying volume patterns.
Unveiling the Secrets of the Bid-Ask Spread
The bid-ask spread is the difference between the highest buy price (bid) and the lowest sell price (ask). It reveals current market sentiment and potential volatility. A narrow spread often signals strong liquidity and stable prices, while a wider spread may suggest the opposite.
For instance, highly liquid stocks like Apple or Tesla tend to have narrow spreads. Less frequently traded stocks often exhibit wider spreads. This difference in spread can offer insight into the trading characteristics of different securities.
Deciphering Volume Patterns: Real vs. Artificial
Understanding volume is essential for distinguishing real buying pressure from potentially misleading activity. Sometimes, traders use large orders, known as "artificial walls," to create a false impression of market depth.
Analyzing the order book allows you to spot these tactics and make better decisions. High volume isn't always a sign of genuine interest. Rapid volume increases combined with large bid-ask spreads may actually suggest market manipulation.
Identifying Liquidity Clusters and Market Makers
Liquidity clusters are zones of concentrated trading activity and represent potential opportunities. Level 2 data highlights these clusters, enabling you to anticipate possible price moves. Identifying the actions of market makers– the entities facilitating trades – gives further understanding of stock behavior.
For example, a market maker repeatedly placing large buy orders could hint at confidence in the stock, while consistent large sell orders may suggest the opposite. Platforms like Moomoo offer free Level 2 data in the United States, showcasing up to 60 bids/asks price levels. This detailed view enables traders to see critical price levels and assess market depth, essential for active trading strategies.
Mastering Order Sizes: Spotting the Whales
Order sizes communicate important information. Small orders usually come from retail investors, while large orders often represent institutional activity. Distinguishing between these is crucial for anticipating future price movements.
Picture a situation with numerous small sell orders but a few enormous buy orders. This pattern could suggest strong institutional accumulation despite selling pressure from retail investors.
To help you further analyze Level 2 data, the following table breaks down the core components:
Level 2 Data Components Breakdown A comprehensive comparison of different Level 2 data elements and their trading significance
| Component | Description | Trading Significance | Example Use Case |
|---|---|---|---|
| Bid Price | The highest price a buyer is willing to pay for a security. | Indicates buying interest and potential support levels. | Identifying potential price floors or entry points. |
| Ask Price | The lowest price a seller is willing to accept for a security. | Indicates selling pressure and potential resistance levels. | Identifying potential price ceilings or exit points. |
| Bid-Ask Spread | The difference between the bid and ask price. | Reflects market liquidity and volatility. A narrow spread typically signifies high liquidity, while a wider spread suggests lower liquidity and potentially higher volatility. | Assessing the ease of entering or exiting a trade and the potential for price swings. |
| Bid Size/Ask Size | The number of shares buyers/sellers are willing to trade at the bid/ask price. | Indicates the strength of buying/selling interest at a specific price level. Large bid/ask sizes can suggest strong support/resistance. | Evaluating the potential for price movements and the likelihood of orders being filled at a particular price. |
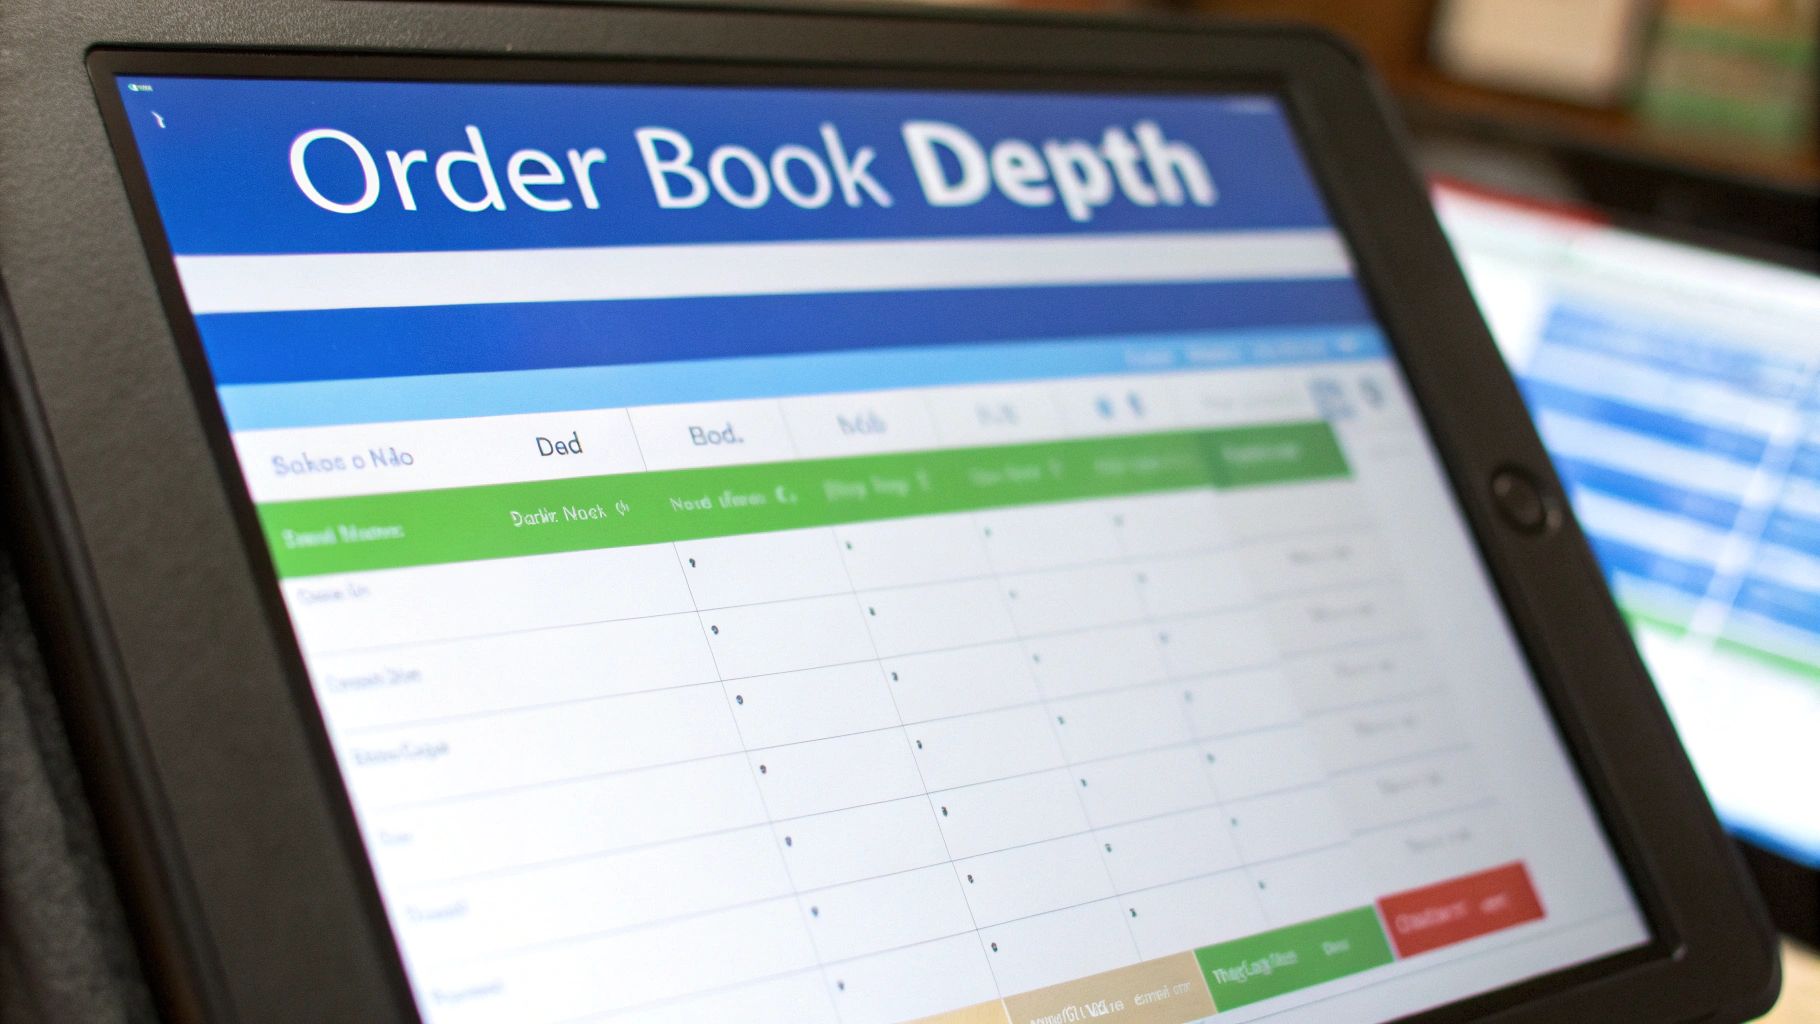
| Order Book Depth | The number of bid and ask levels displayed. | Provides insight into market liquidity and the potential for price changes. A deep order book suggests high liquidity and greater price stability. | Assessing overall market sentiment and the potential for price fluctuations. |
This table highlights how different Level 2 components offer insights into market dynamics. By understanding these elements, traders can make more informed choices.
By mastering these skills, you can become a skilled market analyst, uncovering hidden insights and anticipating market moves. Understanding Level 2 data allows for better-informed trading decisions, helping you capitalize on opportunities unseen by others.
Finding Hidden Trading Opportunities In Market Depth
Understanding Level 2 market data is like gaining a deeper insight into the market's mechanics. It moves traders beyond basic price charts and into the realm of order flow. This allows for a more nuanced understanding of market dynamics and potential opportunities.
Identifying Support and Resistance with Precision
One of Level 2 data's most significant advantages is the ability to accurately pinpoint support and resistance levels. By examining the placement of bids and asks, traders can identify these crucial levels with greater precision than traditional charting methods. Level 2 data helps traders find areas of concentrated liquidity, reducing risk and offering potential insights into future price movements.
For example, a substantial number of buy orders at a particular price point suggests strong support. Conversely, a large cluster of sell orders could signal potential resistance. Armed with this information, traders can identify optimal entry and exit points for their trades.
Spotting Breakouts Before They Happen
Level 2 data not only identifies existing support and resistance but can also help predict breakouts. By observing the ebb and flow of the order book, traders can sometimes anticipate breakouts before they happen.
Imagine observing a growing number of buy orders accumulating just below a resistance level. This suggests increasing buying pressure and a potential breakout above that level. This foresight allows traders to position themselves for the anticipated move, maximizing potential profits. Conversely, weakening bids at a support level could indicate a potential breakdown.
Gauging the Staying Power of Price Movements
Price movements vary in their strength and duration. Some have significant momentum, while others quickly reverse. Level 2 data offers valuable insights into the likely sustainability of a price move.
A price increase supported by robust buying volume across multiple bid levels has a higher probability of continuation than a move driven by low volume or a single large order. This understanding allows traders to avoid getting caught in short-lived price swings and instead focus on moves with genuine momentum.
Recognizing Algorithmic Trading and Institutional Footprints
Algorithmic trading and institutional investors exert a strong influence on today's markets. Level 2 data provides a glimpse into their activity. Identifying patterns in order placement and cancellation can signal the presence of algorithms.
Similarly, unusually large orders or consistent buying/selling from specific market makers can indicate institutional involvement. This awareness helps traders understand the forces driving the market and adapt their strategies accordingly. For instance, a large institutional buy order might reinforce confidence in a stock's upward potential.
Timing Entries with Market Depth Analysis
Finally, Level 2 data is essential for precise entry timing. By understanding the order book's depth and its dynamic nature, traders can time their entries to minimize slippage and maximize their chances of a full order execution.
Entering a buy order just as a large sell order is absorbed by the market can result in a very favorable entry price. Likewise, placing sell orders when buy orders are diminishing can secure better exit prices. These strategies are key to translating market depth analysis into consistent trading advantages. Through informed use of Level 2 data, traders can sharpen their decision-making and increase their chances of consistent profitability.
How Wall Street Giants Really Use Level 2 Intelligence
Understanding Level 2 market data is important for all traders. However, its use varies greatly between retail traders and institutional investors. This section explores how Wall Street giants, like hedge funds and investment banks, use Level 2 data for complex strategies and gain a market advantage.
Executing Massive Orders Without Market Impact
One of the biggest challenges for institutional investors is executing large orders without significantly affecting the market price. Level 2 data gives them the insights to do this. By analyzing the order book's depth, these firms can find pockets of liquidity and strategically place orders to lessen price impact.
For example, they might divide a large buy order into smaller pieces. Then, they execute these smaller orders gradually as sell orders appear at the prices they want. This prevents a sudden price jump, which could happen if the entire order was placed all at once.
Analyzing Market Microstructure for Optimal Performance
Wall Street giants do more than just read the order book. They use sophisticated algorithms to analyze market microstructure. Market microstructure is the study of how the market functions at a very detailed level.
This analysis helps them find hidden patterns and predict short-term price movements. They also use Level 2 data to see if other large players are present and understand their potential trading intentions. This awareness lets them adjust their strategies in real-time and take advantage of market inefficiencies.
Ensuring Data Reliability and Security
Data reliability and security are extremely important for institutional investors. They depend on advanced technology and strong data feeds to ensure the accuracy and timeliness of their information. The importance of Level 2 market data also extends to institutional investors.
On the Shanghai Stock Exchange, Level 2 data is meant to improve market transparency and reduce irrational price swings. This data moves through secure, standardized protocols like FIX-based STEP, which ensures its reliability. These high standards are crucial for making informed decisions involving vast sums of money.
Enhanced Level 2 Offerings and Market Transparency
Exchanges around the world are constantly improving their Level 2 offerings. They provide even more detailed data and advanced features. This increased transparency benefits all market participants, including retail traders.
For example, some exchanges offer Time & Sales data along with Level 2. This shows the price and size of every completed trade. This extra information can further support order book insights and show real-time market activity.
Advanced Techniques Employed by Institutional Investors
-
Iceberg orders: These large orders are partially hidden. Only a small part of their total size is shown. This tactic keeps the market from fully anticipating the order's impact, which minimizes price changes.
-
Order routing algorithms: These algorithms automatically send orders to different exchanges or market makers to find the best price. Level 2 data is essential for determining the best routing strategies.
-
Proprietary indicators: Many firms create their own indicators based on Level 2 data. This helps identify trading opportunities and generate signals. These indicators are often built on advanced statistical models and machine learning algorithms.
By understanding how institutional investors use Level 2 data, retail traders can learn valuable insights into market dynamics and improve their own trading strategies. While retail traders may not have the same resources as Wall Street giants, they can still use Level 2 data to make better decisions and gain a competitive edge.
Where Algorithms Meet Level 2 Data Magic
Algorithmic trading is rapidly becoming the future of finance, and Level 2 market data is the engine driving these complex systems. This data provides a detailed view of the order book, allowing algorithms to analyze real-time supply and demand dynamics and execute trades with incredible speed and precision.
The Role of Level 2 Data in Algorithmic Trading
Level 2 data is crucial for a wide range of algorithmic trading strategies. High-Frequency Trading (HFT), for instance, relies on it to identify and exploit fleeting market inefficiencies. These algorithms analyze the order book for subtle changes, executing trades within milliseconds.
Market making algorithms also depend on Level 2 data to maintain liquidity. They constantly monitor the bid-ask spread, adjusting quotes to ensure smooth market function. Predicting price movements and assessing liquidity are further enhanced by this detailed market information. Explore this topic further.
Liquidity Detection Systems and Modern Markets
Modern markets rely heavily on liquidity detection systems, powered by Level 2 data. These systems analyze market depth to determine how easily large orders can be executed without drastically impacting price.
This is vital for institutional investors and other large participants, allowing them to minimize market impact and optimize their strategies. The ongoing monitoring contributes to overall market stability. For a deeper dive into the impact of algorithms, Learn more in our article about top algorithmic trading software.
Technical Infrastructure for Processing Level 2 Data
Processing Level 2 data requires a robust and specialized technical infrastructure. Low latency is paramount; even minor delays can mean lost opportunities or poor execution prices. This necessitates high-speed data feeds and substantial computing power.
Reliable data feeds are also essential. Interruptions can significantly disrupt algorithmic strategies. Redundant feeds and failover mechanisms are implemented to mitigate this risk, ensuring uninterrupted access to vital market data.
Case Studies: Successful Algorithmic Strategies
Several successful algorithmic strategies highlight the power of market depth analysis. One strategy involves identifying hidden liquidity, where algorithms detect large, partially hidden "iceberg orders" that are not readily apparent to other market participants.
Another focuses on predicting short-term price movements by recognizing patterns in order flow dynamics within the order book. These strategies demonstrate how advanced algorithms use Level 2 data to gain an edge in the dynamic world of financial markets.
Choosing Your Level 2 Data Platform Wisely
Selecting the right platform for accessing Level 2 market data is essential for successful trading. It's not simply about seeing the data—it's about how quickly you receive it, how you interact with it, and the analysis tools at your disposal. This section compares different platforms and their Level 2 data offerings, highlighting crucial aspects like data quality, refresh rates, user interface, and cost.
Data Quality and Refresh Rates: The Core of Effective Trading
The speed and quality of your Level 2 data can mean the difference between seizing a profitable opportunity and missing out entirely. In fast-moving markets, a delayed feed can make the information obsolete. Prioritize platforms offering real-time data feeds and high refresh rates, ideally measured in milliseconds. This ensures you have the most up-to-date view of the market. Accuracy is also non-negotiable, as inaccurate data can result in poor decisions and financial losses.
For instance, a slow refresh rate might show buy orders that are already filled, giving a false impression of increased buying pressure. This discrepancy can significantly impact trading choices. Top Stock Market Analysis Tools for Pro Traders offers further reading on this topic.
User Interface and Design: Your Personalized Command Center
A well-designed user interface is about more than just aesthetics; it directly impacts functionality and trading efficiency. Your Level 2 data platform should present information clearly and intuitively. Customizable displays are essential, allowing you to tailor the data presentation to your trading style.
Features such as color-coded bids and asks, adjustable font sizes, and the ability to highlight specific orders can significantly enhance your ability to process information quickly. Imagine instantly seeing large incoming buy orders highlighted in green, clearly signaling potential upward momentum. These visual cues are invaluable in dynamic trading environments.
Cost Structures: Weighing Free vs. Premium Options
Many platforms offer both free and premium Level 2 data services. Understanding the differences is crucial for selecting the service that aligns with your needs. Free services may be suitable for beginners or casual traders, but they often have limitations like fewer bid/ask levels displayed or slower refresh rates.
Premium services generally offer more extensive data, faster updates, and additional features such as integrated charting tools and analytical indicators. Assess your trading style and needs to determine if a premium service's benefits justify the cost. For example, premium services might provide Level 2 data for all listed stocks, while free services might cover a limited selection.
To help you evaluate various platforms, we've compiled a comparison table detailing their features and pricing.
Level 2 Data Platform Comparison: A Side-by-Side Look at Popular Trading Platforms
| Platform | Cost | Data Depth | Key Features | Best For |
|---|---|---|---|---|
| Platform A | Free/Premium | 10/20 levels | Basic charting, alerts | Beginners |
| Platform B | Premium | 50 levels | Advanced charting, analytical tools, order book visualization | Active traders |
| Platform C | Free | 5 levels | Basic order book display | Casual traders |
| ChartsWatcher | Free/Premium | Customizable | Multiple screen configurations, synced data views, custom alerts | Professional traders |
This table provides a quick overview of several Level 2 data platforms, showcasing their key features, data depth, pricing, and target audience. Remember to explore each platform further to find the best fit for your trading needs.
Platform-Specific Tools and Features: Gaining an Edge
Many platforms provide tools designed to enhance Level 2 analysis, like customizable alerts, order book visualization tools, and integrated analytical features. These tools offer valuable insights and can improve trading decisions. Some platforms may offer tools to automatically identify liquidity clusters or highlight substantial order imbalances, giving you an edge in the market.
Technical Requirements and Setup: Ensuring Smooth Operation
Before subscribing to a platform, ensure your computer and internet connection meet the technical requirements. A fast processor, adequate RAM, and a stable internet connection are crucial for seamless operation and real-time data delivery. Some platforms might also require specific software or browser extensions.
Proper setup and configuration are also essential for maximizing the platform's potential. This might involve customizing display settings, setting up alerts, and configuring data feeds to match your specific trading preferences. By carefully considering these factors, you can select a Level 2 data platform that helps you make informed decisions and increases your trading success.
Key Takeaways
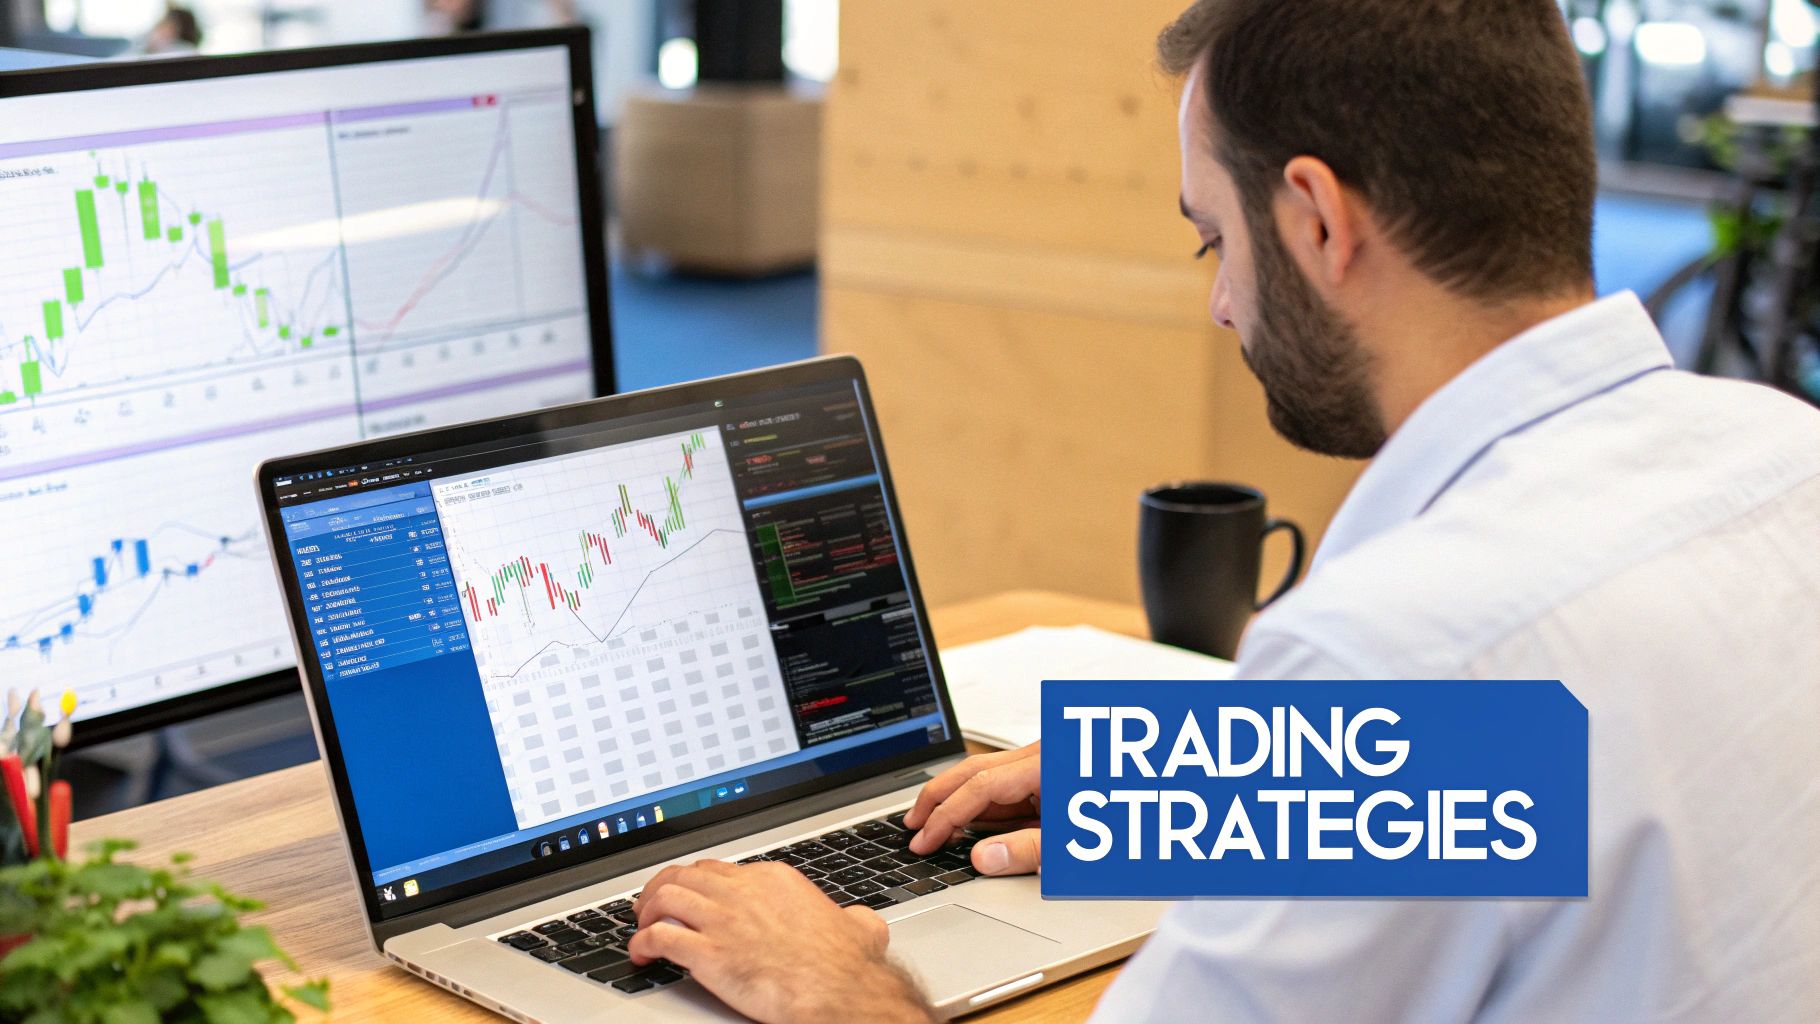
Your journey to understanding Level 2 market data culminates in applying this knowledge for profitable trading. This section offers actionable strategies to integrate order book analysis into various trading styles, including scalping, swing trading, and momentum trading. We'll explore specific entry and exit strategies and discuss combining Level 2 insights with technical analysis for stronger signals. Finally, we'll address common pitfalls and offer proven methods for managing potential information overload. Each takeaway provides clear, practical steps for immediate implementation, along with realistic expectations and measurable benchmarks.
Actionable Implementation Guides for Order Book Analysis
No matter your preferred trading style, Level 2 data can provide a significant advantage. For scalpers, seeing real-time order flow is crucial for spotting fleeting opportunities. Analyzing the bid-ask spread and order sizes allows scalpers to anticipate short-term price movements and execute rapid trades.
Swing traders can use Level 2 data to pinpoint potential support and resistance levels more accurately. This allows for more precise entry and exit points, improving risk management and maximizing potential profits. Recognizing order imbalances and liquidity clusters adds further confirmation for swing trading setups.
Momentum traders also benefit from understanding the depth and strength of a price move. Observing the order book helps gauge the momentum's sustainability and avoid false breakouts. For example, seeing sustained buying pressure at higher levels increases confidence in an uptrend's continuation.
Entry and Exit Strategies Using Level 2 Insights
Level 2 data provides a unique view of entry and exit strategies. For entries, focus on strong support levels with concentrated buy orders, indicating potential buying pressure and a likely price bounce. For exits, look for resistance levels with many sell orders, suggesting potential selling pressure and a likely price drop.
Don't rely solely on Level 2 data. Combine it with traditional technical analysis indicators. For instance, look for convergences between strong support levels (identified by Level 2 data) and key technical indicators like moving averages or trendlines. This combined approach creates more robust trading signals and increases the likelihood of successful trades.
Managing Information Overload and Avoiding Common Pitfalls
Level 2 data can overwhelm new users. To avoid this, start with the key components: bid-ask spread, order sizes, and market depth. As you become more comfortable, gradually incorporate other elements, such as market maker IDs and Time & Sales data.
One common pitfall is spoofing, where traders place large orders to create a false impression of market depth, then cancel them. Be wary of relying solely on large orders without considering other market factors. Another mistake is overemphasizing short-term movements while neglecting broader market trends. Always integrate Level 2 analysis with your overall trading strategy. Never rely on it alone.
Measuring Your Progress with Level 2 Data
Tracking your progress with Level 2 data is essential for improvement. Keep a trading journal, noting entry and exit points, the rationale behind each trade (including Level 2 insights), and the outcome. Regularly reviewing your journal helps identify strengths and weaknesses.
Another useful metric is your average winning trade versus your average losing trade. A significantly larger average win than average loss indicates you're effectively using Level 2 data. This provides concrete evidence of your progress and motivates further refinement of your skills. By incorporating these actionable steps and measuring your progress, you can unlock Level 2 data's true potential and significantly enhance your trading performance.
Ready to elevate your trading with powerful, customizable charts and real-time data? ChartsWatcher offers the tools you need. From multiple screen configurations and synced data views to custom alerts and advanced analysis features, ChartsWatcher empowers you to master the markets. Start your free trial today and experience the ChartsWatcher advantage.
