What Is Fundamental Analysis A Guide to Stock Value
Fundamental analysis is all about figuring out a stock's real or "intrinsic" value. Forget the day-to-day market chatter for a second. This method dives deep into the economic and financial factors that actually drive a company's worth.
The goal is pretty simple: find a solid value for a company, then compare it to its current stock price. Is it a bargain, or is everyone paying way too much? It’s about looking past the noise to understand the business's core health.
Decoding the True Value of a Company
Think of yourself as an investment detective. While the rest of the market gets caught up in a stock's daily price swings—which are a lot like tracking a suspect's unpredictable moods—you're the one on the ground, digging for hard evidence.
Your job is to figure out what a business is truly worth, completely separate from its popularity on any given day.
This means you’re looking at everything that makes the business tick: its financial statements, the quality of its management team, where it stands in its industry, and any competitive advantages it might have. The core idea is that the market price can often be wrong. Spotting the gap between the market price and a company's intrinsic value is how you uncover incredible investment opportunities. For a deeper look, our guide on how to find undervalued stocks that win has some great practical strategies.
The image below nails this core concept: you're evaluating a business's health to find its true value, not just its price tag.

This isn't just theory—it’s the bread and butter of valuation and financial statement analysis. To get a sense of how these skills are tested at the highest levels, check out these common investment banking technical questions. You'll see they’re built on these exact same principles.
The Two Pillars of Your Investigation
Every good investigation has two sides to it, and fundamental analysis is no different. You need both to get the full story on a company.
The process of fundamental analysis is built on two key types of information: the numbers you can measure and the qualities you can't.
Core Components of Fundamental Analysis at a Glance
| Component Type | What It Is | Examples |
|---|---|---|
| Quantitative Analysis | The "science" of your investigation. It involves crunching hard numbers from financial documents. | Revenue, profit margins, earnings per share (EPS), price-to-earnings (P/E) ratio, debt levels. |
| Qualitative Analysis | The "art" of your investigation. It involves assessing intangible factors that don't appear on a spreadsheet. | Brand reputation, management effectiveness, competitive advantages, industry trends, corporate governance. |
One pillar without the other gives you an incomplete picture. Great numbers with terrible management is a red flag. A fantastic brand with crumbling financials is just as bad. You need to look at both to make a truly informed decision.
The Origins of Value Investing
To really get a handle on fundamental analysis, you have to understand where it came from. This whole disciplined approach wasn't cooked up during some roaring bull market; it was forged in the fire of the 1929 stock market crash and the Great Depression that followed.
Before that crash, the stock market was mostly a casino running on speculation, rumors, and whatever was hot that day. When the bubble finally burst, it didn't just sting—it wiped people out, showing just how dangerous it is to invest without any kind of logical framework. Investors desperately needed a new way to play the game, one based on facts and reason, not just gut feelings.
The Fathers of a New Discipline
This is where two professors from Columbia Business School, Benjamin Graham and David Dodd, come into the story. They saw the financial devastation firsthand and set out to turn investing from a high-stakes gamble into a structured, intellectual pursuit. Their idea was pretty radical for the time: a stock isn't just a ticker symbol to flip, but an actual piece of a business.
They laid it all out in their groundbreaking 1934 book, Security Analysis. Think about the timing—this was published right after the Dow Jones had cratered by nearly 90%. The book made a powerful argument for meticulously evaluating a company's financial health to figure out its real worth, instead of just guessing where the price might go next. For a deeper dive into these core ideas, earn2trade.com offers great historical context.
Core Principles Born from Crisis
Graham and Dodd’s work gave us concepts that are still the bedrock of value investing. These principles weren't just about making money; they were a defense mechanism against the market's wild, irrational swings.
The whole point of their method wasn't to chase the next big thing, but to build a protective wall between an investor's money and the market's manic-depressive personality.
Two of their most powerful ideas are still gospel for value investors today:
- Intrinsic Value: This is the "true," calculated value of a company, based on its assets, earnings, and what it’s likely to earn in the future. It’s the anchor that keeps you from getting carried away by market hype or dragged down by panic.
- Margin of Safety: This is the critical cushion between a stock's market price and what you've calculated as its intrinsic value. By buying a stock for a lot less than you think it's worth, you give yourself room for error. If you're wrong, or if something unexpected happens, that buffer helps protect you.
These weren't just theories from an ivory tower; they were practical, battle-tested rules for financial survival. By focusing on what a business is actually worth, investors could finally make clear-headed decisions, even when everyone else was losing theirs.
The Two Sides of Fundamental Analysis
Fundamental analysis isn't a single, monolithic approach. It’s a two-part investigation that blends the meticulous work of a scientist with the sharp judgment of an art critic. To really get a handle on a company’s potential, you need to get comfortable with both quantitative analysis (the science) and qualitative analysis (the art).
One side is all about cold, hard numbers. The other is about interpreting the human elements that make a business tick. The true picture of a company's intrinsic value only comes into focus when you bring these two worlds together.
This infographic gives you a glimpse into the history of value investing, tracing its roots back to the devastating 1929 market crash. It shows how core principles from Benjamin Graham, like the 'margin of safety,' were born from a need to protect investors from pure chaos.
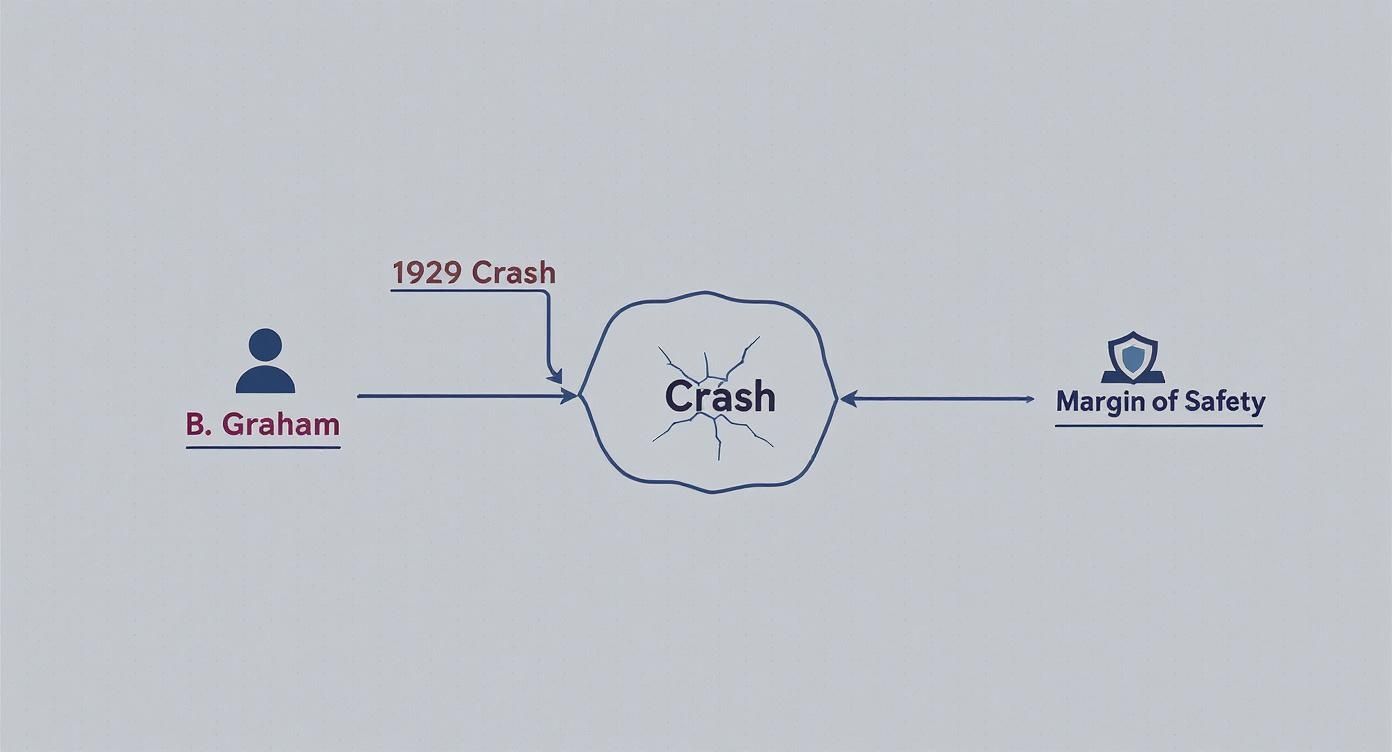
This whole analytical method was forged in fire, created to give investors a rational, evidence-based system in a world that suddenly seemed to have none.
Quantitative Analysis: The Science of Numbers
Quantitative analysis is where you put on your lab coat. This part of the investigation is focused entirely on measurable, objective data. It’s grounded in math, and it means digging through a company’s financial statements to see how healthy it really is.
This is where you find the hard proof of profitability, efficiency, and financial stability. You'll get most of this data from three key documents:
- Income Statement: This shows revenues, costs, and profits over a set period. It answers the simple question: "Is this business actually making money?"
- Balance Sheet: This is a snapshot of assets, liabilities, and shareholder equity at a single moment in time. Think of it as answering, "What does the company own, and what does it owe?"
- Cash Flow Statement: This tracks how cash is moving in and out of the company. It tells you, "How good is the company at generating and managing cold, hard cash?"
From these statements, you can calculate crucial financial ratios to compare companies, spot trends, and see how a business stacks up against its peers. Ratios like the Price-to-Earnings (P/E) ratio help you gauge if a stock is over or undervalued, while the Debt-to-Equity ratio shows you how much risk the company is shouldering.
Here are some of the most common ratios you’ll come across.
Essential Financial Ratios Explained
| Financial Ratio | What It Measures | Why It Matters |
|---|---|---|
| Price-to-Earnings (P/E) | The stock's current share price relative to its per-share earnings. | Helps determine if a stock is overvalued or undervalued compared to its peers or its own history. |
| Debt-to-Equity (D/E) | The company's total debt compared to its total shareholder equity. | Reveals how much financial leverage (and risk) a company is using. A high ratio can be a red flag. |
| Return on Equity (ROE) | How efficiently the company generates profits from its shareholders' investment. | A higher ROE indicates better management efficiency and profitability. It's a key sign of a quality business. |
| Earnings Per Share (EPS) | The company's profit allocated to each outstanding share of common stock. | A fundamental measure of a company’s profitability on a per-share basis. Growing EPS is a positive sign. |
| Price-to-Book (P/B) | The stock's market price compared to its book value (assets minus liabilities). | Often used by value investors to find companies trading for less than their net asset value. |
These metrics give you a solid, factual starting point for any investment thesis.
Quantitative analysis gives you the "what." It tells the story of a company’s past performance in black and white, providing a factual basis for everything that follows.
Qualitative Analysis: The Art of Judgment
While numbers tell you what happened, qualitative analysis helps you figure out why it happened—and what’s likely to happen next. This is the "art" of investing, where you step back from the spreadsheets and evaluate the intangible factors that drive long-term success.
This side of the coin requires insight and judgment. You're looking at things that can't be neatly plugged into a formula but are absolutely critical to a company's future.
Key qualitative factors include:
- Brand Reputation: Think about Apple. Its powerful brand loyalty means customers will line up to pay a premium for its products. That's a massive advantage that doesn't show up as a line item on the balance sheet.
- Management Competence: Is the leadership team experienced, trustworthy, and visionary? A brilliant CEO can navigate tough times and unlock new growth, while a weak one can drive a financially sound company straight into the ground.
- Competitive Advantage (Moat): What protects the company from its rivals? This could be anything from patented technology (like a drug company) to a dominant market position (like Google in search). A wide "moat" helps ensure the company can keep earning profits for years to come.
Qualitative factors provide the context behind the numbers. A company might have fantastic financials (quantitative), but if it’s stuck in a dying industry with terrible management (qualitative), its future probably isn't bright. On the flip side, a strong brand and a visionary leader can turn a struggling company's fortunes around.
You need both. Without the numbers, your story is just an opinion. Without the story, your numbers lack meaning. A truly informed investment decision requires mastering both sides of the analysis.
Gathering Your Data for Analysis
Any good fundamental analysis is built on one thing: quality information. Think about it. An analyst working with bad data is like a detective trying to solve a case with tainted evidence—the conclusions are going to be flat-out wrong. So, your first job is to hunt down and get comfortable with the primary sources where companies lay their financial health bare.

The gold standard here is the official paperwork that public companies are legally required to file with government bodies like the U.S. Securities and Exchange Commission (SEC). These reports are the unfiltered truth, straight from the horse's mouth.
Beyond official company filings, some traders also look at broader market education resources, analyst commentary, and trading platforms such as Atmos Funded or similar firms to understand how valuation ideas are applied in real market conditions. While these sources shouldn’t replace primary financial data, they can help connect fundamental analysis with practical trading decisions.
Locating Primary Data Sources
Your investigation kicks off with two critical documents. They can look a bit dense and intimidating at first, but once you know what you're looking for, they become incredibly powerful tools.
These are the foundational reports you absolutely need to master:
- Form 10-K (Annual Report): This is the big one—a comprehensive yearly overview of a company's business and financial performance. It’s got audited financial statements, a deep dive into the business operations, and management’s own discussion and analysis (MD&A) of how things went.
- Form 10-Q (Quarterly Report): Think of this as a condensed, unaudited update to the 10-K. It comes out for the first three quarters of a company’s fiscal year and gives you a timely look at recent performance and any major changes.
Getting the hang of these documents is a core skill for any serious analyst. For a step-by-step guide, check out our article on how to read earnings reports for investors.
The numbers in a 10-K don't lie. They provide the raw, unfiltered data needed to calculate key ratios, track performance over time, and form an objective opinion on a company's true value, free from market hype.
Beyond the core SEC filings, you can add more color to your analysis with info from reputable financial news sites, detailed industry reports, and specialized data platforms. These secondary sources are great for putting the raw numbers from the official documents into context.
Using Historical Data to Find Trends
A single report gives you a snapshot in time, but a decade of reports tells you a story. This is where fundamental analysis really shines—using historical data to see how a company’s growth, profitability, and risk have evolved. Today’s tools can give you access to 30+ years of financial data for thousands of companies, which is incredible for spotting long-term trends.
For instance, looking back, the top dogs in the S&P 500 have historically delivered average annual revenue growth of 7–10%. That blows away the 3–5% seen across the broader index. This kind of long-view analysis helps you stress-test a company's resilience through different economic cycles, turning a pile of data into powerful insight.
Top-Down vs. Bottom-Up Investing: Picking Your Starting Point
When it comes to fundamental analysis, there’s no single right way to start. Think of it as deciding whether to look at the forest first or to start by examining a single tree. Investors generally fall into two camps, each with a different strategic path: the top-down approach and the bottom-up approach.
One way is like using a telescope. You begin with the biggest picture possible—the entire global economy—and slowly zoom in. You look at broad economic trends, identify promising sectors, and only then start picking individual companies that look like winners.
The other approach is more like using a microscope. You ignore the big picture entirely at first. Instead, you focus all your energy on finding one exceptional business, believing that a truly great company can succeed no matter what the rest of the market is doing.
The Top-Down Telescope View
A top-down investor always starts with the macro picture. They’re asking the big-picture questions long before they ever think about a specific stock. It’s all about context.
- Economic Health: Is the economy growing, or are we heading for a recession? Where are interest rates headed?
- Industry Trends: Which sectors are getting a boost from new technology, demographic shifts, or government policies?
- Geopolitical Climate: How could trade wars, elections, or global conflicts impact certain industries?
The guiding principle here is that a rising tide lifts all boats—and a falling tide can sink even the sturdiest ship. For example, a home construction company might have fantastic financials, but a top-down investor would probably steer clear if interest rates were soaring and a recession looked likely. The economic headwind is just too strong to fight.
The Bottom-Up Microscope View
Bottom-up investors flip that script completely. They hunt for outstanding individual companies first, convinced that a world-class business will find a way to thrive in any economic cycle.
Their focus is intensely granular, zeroing in on a company’s specific DNA. They dig into financial strength, competitive advantages (the "moat"), and the quality of the management team. The core belief is that a superior company will crush its competitors and outperform the market over the long run, even if it's in a struggling industry. This means deep dives into balance sheets, income statements, and cash flow reports to find those hidden gems the market has overlooked.
Ultimately, the choice comes down to your personal investment philosophy. Do you believe the economic tide dictates success for everyone, or can a strong swimmer thrive in any current?
In today's interconnected world, it’s getting harder to ignore the bigger picture. The 2008 financial crisis was a huge wake-up call. Since then, the balance sheets of global central banks have swelled from around $5 trillion to over $25 trillion by 2021.
This massive influx of money means that even a tiny 1% shift in interest rates can swing a stock's calculated intrinsic value by a whopping 10–20%. It’s a powerful reminder that macro forces can have a huge impact, a reality top-down analysts are always watching. You can dig deeper into these historical trends and their impact on analysis over at QuantifiedStrategies.com.
Fundamental vs Technical Analysis Explained
To really grasp what fundamental analysis is, you first need to understand what it isn't. Most traders lump market analysis into two major camps: fundamental and technical. While they both want to help you make better trades, they approach the market from completely different angles.
Think of it like buying a used car. A fundamental analyst is the person who pops the hood, checks the engine, pulls the full service history, and takes it on a long test drive. They want to know everything about the car's real condition to figure out what it's actually worth.
A technical analyst, on the other hand, doesn't even look at the engine. They're more interested in a chart of the car's past speeds on different roads. They look for patterns in its performance, believing that everything you need to know about its future speed is already baked into its history.
Different Goals and Tools
The core difference really comes down to what each camp is trying to achieve.
A fundamental analyst digs deep into a company's financial health. They'll spend hours pouring over financial statements, economic reports, and industry trends to calculate a company's intrinsic value. Their whole game is about finding out if a stock is being sold for more or less than it's truly worth.
Meanwhile, a technical analyst is all about the charts. They study price movements, trading volumes, and patterns using tools like moving averages or the RSI. They believe that market psychology and past trends are the real drivers and that by analyzing them, they can predict where the price is headed next.
The simplest way to put it is this: Fundamental analysis tries to figure out what to buy by finding a great company at a fair price. Technical analysis tries to figure out when to buy by spotting the perfect entry point based on market sentiment.
This is why so many experienced traders don't just pick one side. A common and very effective strategy is to blend both approaches. You might use fundamental analysis to build a watchlist of financially solid companies that seem undervalued. Then, you switch over to technical analysis to time your entry, waiting for the price chart to signal that the trend is finally moving in your favor.
Of course. Here is the rewritten section, crafted to sound natural, human, and expert-driven, following the provided style guide.
Your Questions, Answered
Even when you've got the basics down, fundamental analysis can feel like a deep pool to jump into. It's totally normal to have a few nagging questions. Clearing up some of the common uncertainties is the best way to build the confidence you need to start digging into companies on your own.
Let’s tackle a few of the questions I hear most often from new investors.
How Long Does It Take to Get Good at This?
Honestly? It's a journey, not a sprint. You can probably get the hang of reading a balance sheet or an income statement in a few weeks, but true skill comes from reps. It's built over time, with every single company you analyze and every economic cycle you live through.
Think of it like learning a new language. You can memorize vocabulary lists all day, but you only become fluent through constant practice and real-world conversation. Most pros will tell you they're still learning—it’s a discipline you refine for your entire investing career.
Is Fundamental Analysis Foolproof?
Not a chance. No investment strategy is, and anyone who tells you otherwise is selling something. Fundamental analysis gives you a solid, logical framework for finding great companies at fair prices, but it isn't a crystal ball.
The biggest catch is that it’s all based on history and educated guesses about the future. And sometimes, those guesses are just plain wrong. A disruptive new technology, a surprise global event, or just a sudden shift in market mood can make a stock trade completely disconnected from its "real" value for a long, long time.
Can I Use This for Short-Term Trading?
You can, but it's not what it was built for. For example, a blowout earnings report—a classic fundamental event—can send a stock soaring for a few days, and a nimble trader could definitely play that move.
But at its heart, fundamental analysis is a long-term investor's tool. You're trying to figure out what a company is truly worth, and it often takes the wider market months, or even years, to catch up to that reality. Short-term traders are usually more focused on technical analysis, playing the game of price momentum and market psychology that unfolds over minutes and hours, not quarters and years.
Ready to put these ideas into practice? Having the right tools makes all the difference. ChartsWatcher gives you a dynamic platform to see alerts, toplists, charts, and newsfeeds all in one place to back up your research. Take control of your analysis at https://chartswatcher.com.
