How to Find Undervalued Stocks That Win
Finding undervalued stocks is all about spotting companies whose market price has disconnected from their true business worth, or what we call intrinsic value. This isn't about chasing hot tips or getting swayed by daily market noise. It's about putting on your analyst hat and digging deep into a company's financial health, its edge over the competition, and its real potential for long-term growth.
What Makes a Stock Genuinely Undervalued

So many investors make the classic mistake of confusing a cheap stock with an undervalued one. A stock trading at $5 a share isn't automatically a steal; it could very well be on a one-way trip to zero. The real skill is telling the difference between a great, high-quality business that's temporarily mispriced and a company that's in a death spiral.
An undervalued stock appears when the market's perception is completely out of whack with the company's fundamental reality. This kind of disconnect can pop up for a few common reasons:
- Market Overreactions: Bad news or a single weak earnings report can spark a wave of panic selling, unfairly dragging down the stock price of an otherwise solid company.
- Sector-Wide Pessimism: Sometimes, an entire industry just falls out of favor with Wall Street. When that happens, the good companies often get thrown out with the bad.
- Lack of Attention: Smaller companies, or those in less "exciting" industries, often fly under the radar of major analysts. This lack of coverage creates pricing gaps that sharp-eyed investors can exploit.
Experienced investors learn to see these situations not as red flags, but as flashing green lights for opportunity. They know that market sentiment can change on a dime, but the underlying value of a well-run business is much more durable.
The Investor Mindset Shift
At its core, this strategy requires a mental shift. You have to stop chasing popular tickers and start acting more like a business owner. Instead of asking, "Will this stock go up tomorrow?" you need to start asking, "If I had the cash, would I buy this entire company at its current price?"
This simple question forces you to look past the squiggly lines on the chart and evaluate the business itself—its products, its leadership, its moat. It's the foundational idea that separates pure speculation from true value investing.
And history backs this up. In the US market, value stocks have beaten growth stocks by an average of 4.4% annually since 1927. In years when value really shines, that premium has even jumped to nearly 15%. This long-term data proves that, over time, buying assets for less than they're worth is a powerful, winning strategy.
Getting this concept down is the first big hurdle. The next is learning the specific tools and methods you'll need to do a proper evaluation. To get a head start on the analytical side of things, check out our guide on the top stock market analysis techniques for a more complete toolkit.
Digging for Value with Key Metrics

Once you've got the right value investor mindset, it's time to get your hands dirty with the numbers. Financial metrics are the tools of our trade—they help us cut through market noise and zero in on what a business is actually worth. But it's not as simple as finding a low Price-to-Earnings (P/E) ratio and calling it a day. Context is everything.
A low P/E for a utility company might scream "bargain," but that same P/E for a high-flying tech stock could be a massive red flag. It might signal that the market has completely lost faith in its future. The real skill is knowing which numbers matter for which company and industry. This is how you learn how to find undervalued stocks that are true hidden gems, not just cheap for a very good reason.
Going Beyond the Basic P/E Ratio
The P/E ratio is a decent starting point, but it only tells you what investors are paying for a dollar of current earnings. It says nothing about where the company is headed. That’s where the Price-to-Earnings Growth (PEG) ratio comes in—it’s one of my favorite reality checks.
You calculate the PEG ratio by dividing the P/E ratio by the company's expected annual earnings growth rate. It’s a simple but powerful tweak.
- A PEG ratio below 1.0 is often a great sign. It suggests the stock's price hasn't caught up to its future growth potential.
- A PEG ratio above 1.0 might mean the stock is overvalued, with its price getting way ahead of its earnings growth.
Using the PEG ratio helps you sidestep the classic "value trap"—a company that looks cheap on paper but is actually stuck in neutral or, worse, decline. It forces you to consider the growth story, which is what really drives long-term returns.
The Honesty of Cash Flow and Book Value
While earnings get all the headlines, they can be gamed with accounting tricks. For a more honest picture, I always look at Free Cash Flow (FCF). This is the actual cash left over after a company pays its bills and reinvests in the business. Strong, growing FCF is the lifeblood of a healthy company.
To make it comparable, we use the Free Cash Flow Yield. Just divide the FCF per share by the stock price. This tells you how much cash the business is generating relative to its market price.
A high FCF yield can be an incredibly powerful signal of an undervalued company. It means the business is a cash-generating machine, with money available for dividends, buybacks, or growth—all things that reward shareholders.
Another great metric, especially for asset-heavy industries like banking or manufacturing, is the Price-to-Book (P/B) ratio. It compares the stock price to the company's net asset value (assets minus liabilities). A P/B ratio below 1.0 literally means you could buy the company for less than the stated value of its assets. Now that's a potential bargain.
Essential Valuation Metrics at a Glance
To tie this all together, here are the core metrics every value investor should have in their toolkit. Think of this as your quick-reference guide for sizing up a company's valuation.
| Metric | What It Measures | What Suggests Undervaluation |
|---|---|---|
| P/E Ratio | Stock price relative to earnings per share. | A ratio lower than its industry peers and historical average. |
| PEG Ratio | P/E ratio relative to earnings growth rate. | A PEG ratio below 1.0. |
| P/B Ratio | Stock price relative to net asset value (book value). | A P/B ratio below 1.0, especially in asset-heavy sectors. |
| FCF Yield | Free cash flow per share relative to stock price. | A high yield compared to peers or bond yields. |
These ratios aren't magic bullets, but when used together, they provide a much clearer picture of whether a stock is genuinely on sale or just a piece of junk.
Alright, you've got the theory down, but let's be realistic: manually sifting through thousands of stocks is an impossible task. This is where you put technology to work for you. Think of a stock screener as your tireless research assistant, one that can filter the entire market based on the exact metrics we just discussed. It instantly turns an ocean of noise into a manageable list of potential gems.
This kind of automation is a non-negotiable for any serious investor trying to find undervalued stocks efficiently. You're no longer just randomly searching; you’re casting a targeted net designed to catch only the most promising candidates. The goal is to build a funnel that starts with thousands of companies and narrows down to a handful that truly deserve a closer look.
This graphic gives you a great visual of how the process flows.
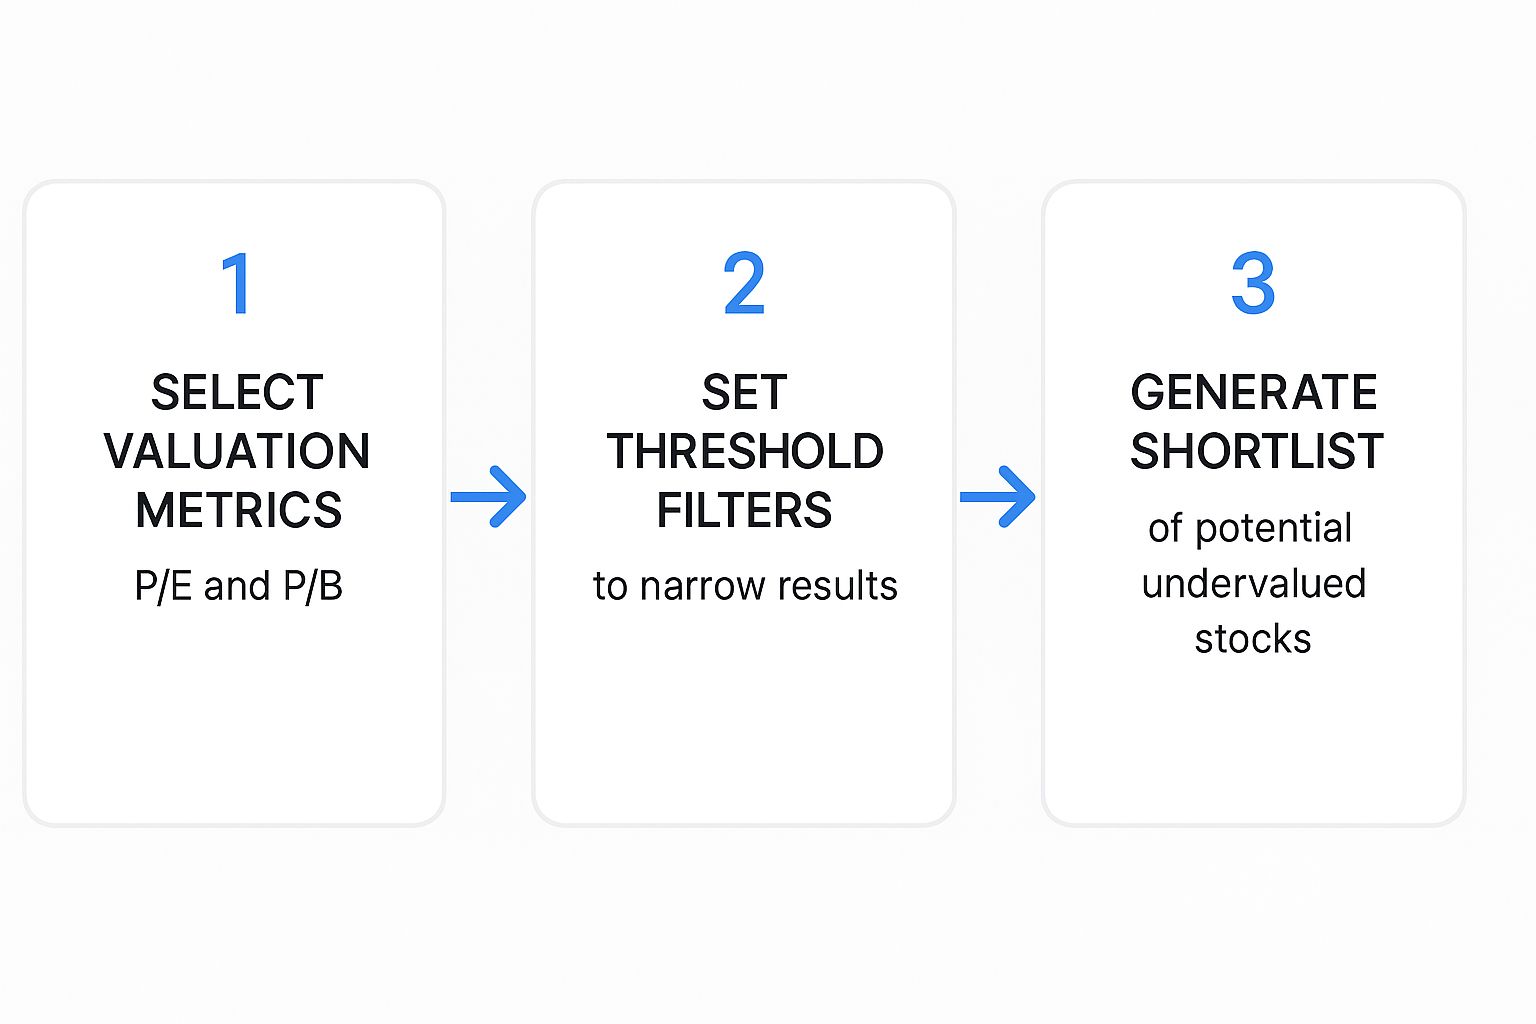
You start with broad valuation metrics, get to specific, filtered results, and then you roll up your sleeves for the qualitative deep dive.
Layering Your Filters For High-Quality Results
The real magic of a screener is in layering multiple criteria. A single filter, like a low P/E ratio, might spit out hundreds of companies, but many of them are cheap for very good (and very bad) reasons. By combining filters, you dramatically improve the quality of your output.
Let's build a quick example. We'll start by looking for a U.S.-based company with a market cap over $1 billion. This simple step helps weed out the micro-caps, which can be far too volatile or illiquid for a foundational strategy.
Here’s a practical set of filters to get started:
- P/E Ratio: Set this to under 15. This immediately focuses your search on companies that aren’t ridiculously priced compared to their earnings.
- Price-to-Book (P/B) Ratio: Filter for a P/B under 1.5. This adds another layer of value, suggesting the stock price isn't miles above the company's net asset value.
- Debt-to-Equity Ratio: Keep this under 0.5. This is a critical filter that screens out businesses drowning in debt, which is a major red flag for risk.
- Return on Equity (ROE): Require an ROE over 10%. This ensures you’re looking at profitable companies that are actually good at generating returns for their shareholders.
Even this simple, four-layer screen can shrink the investment universe from over 5,000 stocks down to just a few dozen. That’s the power of compounding your filters.
Refining Your Screener and Reviewing Candidates
Once you have a manageable list, the real work begins. The screenshot below shows what a typical screener interface looks like when you apply these kinds of filters.
It's a clean layout that lets you see all your criteria and the resulting list of stocks in one place, making the process much more intuitive.
Pro Tip: Don't ever treat your screener results as a "buy list." Think of it as your "research list." The screener's job is to find financially sound, reasonably priced companies. Your job is to do the qualitative homework to see if there's a great business behind the numbers.
As you build out your screening process, consider how modern AI tools for research can give you an edge. These tools can help you process news, reports, and market sentiment much faster than doing it all by hand.
Once you’re comfortable with the basics, you can start experimenting with more advanced filters, like requiring positive free cash flow over the last five years or setting specific earnings growth projections. For more ideas and detailed walkthroughs, check out our guide on how to use a stock screener for more smart investing tips.
Looking Beyond the Numbers in Your Analysis
 Okay, your stock screener did its job. It’s handed you a clean, manageable list of companies that look financially sound and reasonably priced. That’s a huge step forward, but the real work starts now.
This is where you move from the black-and-white world of quantitative data to the grayer, more nuanced world of qualitative analysis. It's the detective work that separates a temporarily beaten-down winner from a company that’s cheap for a very good reason—it's in a permanent decline.
The numbers tell you what has happened. The story behind the business tells you what could happen next. At the heart of it all, you need to answer one question: does this company have a durable competitive advantage?
Assessing the Economic Moat
Legendary investor Warren Buffett gave us the perfect term for this: the economic moat. It’s what protects a great business from competitors, just like a real moat protects a castle, allowing it to defend its profits for the long haul.
So, what does a strong moat look like in the real world?
- Intangible Assets: Think of powerful brands, critical patents, or regulatory approvals that are incredibly difficult to replicate. The brand recognition of Coca-Cola is a classic example, as are the patents held by a major pharmaceutical firm.
- Switching Costs: How painful is it for a customer to switch to a competitor? For big companies using enterprise software from vendors like Oracle or SAP, the cost and disruption of changing providers are massive. That's a powerful moat.
- Network Effects: Does the product get more valuable as more people use it? This is the magic behind platforms like Meta or marketplaces like eBay. Every new user adds value for all the others, creating a self-reinforcing cycle.
- Cost Advantages: Can the company simply make or sell its products cheaper than anyone else? This allows it to either win on price or just pocket higher margins. Retail giants like Walmart perfected this with their immense scale.
A business with a wide, sustainable moat can fend off competition and generate predictable earnings for years. This is a critical factor when searching for undervalued stocks, as it provides a margin of safety for your investment.
Evaluating Management Quality
Even the best business can be driven into the ground by poor leadership. Before you even think about investing, you have to get a feel for the quality and integrity of the management team. Don't just take their glossy press releases at face value.
The real insight comes from digging into their annual letters to shareholders from the past several years. Are they honest about their mistakes, or do they only brag about their wins? Do they lay out a clear, logical plan for how they use the company's money—whether that’s reinvesting in growth, paying dividends, or buying back stock? A team with a proven track record of smart, shareholder-friendly decisions is a huge plus.
Looking at real-world examples really drives this home. When Tesla had its IPO in June 2010, shares were priced at $17. Within nine months, they had plummeted to around $4. At that price, the stock was deeply undervalued, but only if you could see past the scary numbers and recognize its visionary leadership and disruptive potential.
This is the core challenge: separating the true growth stories from the value traps. You can learn more about making that distinction by exploring undervalued stock case studies.
Finding a single undervalued stock is a great feeling. But what if you could find an undervalued stock in an entire sector that everyone else is ignoring? That’s where you can really tilt the odds in your favor.
This top-down approach flips the usual script. Instead of starting with individual tickers, you begin by looking at broad market sectors to see which ones have fallen out of favor.
Think of the market like a city full of different neighborhoods. Every so often, an entire neighborhood becomes unpopular for a while, and property values drop across the board—even for the best-kept houses. Sector analysis is about finding those temporarily unloved neighborhoods so you can pick up fantastic assets for cheap.
This method helps you zero in on the most promising areas instead of searching randomly. You're no longer just looking for a needle in a haystack; you're digging in a spot where you already know there's a good chance of finding treasure.
Pinpointing Out-of-Favor Sectors
The first step is figuring out which sectors are trading below their historical norms. I like to use tools that compare a sector's current valuation, like its average P/E ratio, against its five- or ten-year average. A significant dip often means the whole industry is on sale.
For instance, you might see the entire real estate or energy sector trading at a discount because of short-term worries about interest rates or commodity prices. This doesn't guarantee every stock in that sector is a buy, but it’s a massive clue about where to start digging.
The goal is to move from a needle-in-a-haystack search to a more methodical excavation in a promising location. You’re no longer just stock-picking; you’re strategically allocating your research efforts where they’re most likely to pay off.
This kind of analysis often uncovers some very clear patterns. One of the key metrics I watch is the price-to-fair value ratio, which gives you a quick read on how a stock's price stacks up against its estimated intrinsic worth.
This can be incredibly powerful. To give you a recent example, in early 2025, small-value stocks in the US were trading about 25% below their fair value estimates.
At that same time, some sectors showed huge valuation gaps. Communication services stocks were looking particularly cheap, while others like utilities and financial services were leaning toward being overpriced. If you want to see the numbers for yourself, you can explore the full analysis from Morningstar.
From Sector to Stock Selection
Once you’ve identified a sector that looks cheap, you can circle back and apply the fundamental analysis we've already covered. But now, your search is laser-focused.
Instead of scanning the entire market, you'll run your screener just for companies within that beaten-down sector. You can apply all your favorite filters—low P/E ratios, strong balance sheets, high return on equity—but you're fishing in a pond that you already know is stocked with potential bargains.
This two-step process—starting with the sector and then drilling down to specific companies—is an incredibly effective way to hunt for value. It dramatically increases your chances of finding a true long-term winner.
Avoiding Common Value Investing Traps
The hunt for undervalued stocks is a rewarding one, but it’s a path littered with deceptive detours. The most dangerous of these is the value trap—a stock that looks incredibly cheap on paper but only gets cheaper because its underlying business is fundamentally broken.
This is a critical skill for any investor: learning to tell the difference between a company facing a temporary headwind and one in a terminal decline.
A low P/E ratio, on its own, isn't a buy signal. In fact, it can be a blaring warning sign. These stocks often show clear signs of decay, like consistently falling revenue, shrinking profit margins, or an eroding competitive edge. They might be stuck in a dying industry or steadily losing ground to more nimble competitors.
Distinguishing Bargains From Traps
To protect your capital, you have to look beyond simple valuation metrics and start asking the tough questions.
- Why is it cheap? Is there a clear, temporary reason, like a market overreaction to a single bad quarter? Or are you looking at a chronic problem with no obvious solution?
- Is there a catalyst for growth? A true bargain has a believable trigger that will make the market re-evaluate its price. This could be a new product launch, a change in management, or improving industry conditions.
- How solid is the balance sheet? Trapped companies often carry crushing debt loads, leaving them with zero flexibility to navigate tough times or invest in a turnaround.
A cheap stock with a weak business is an anchor that will drag your portfolio down. A cheap stock with a strong business is an opportunity. Your job is to rigorously determine which one you’re looking at before you put any money on the table.
Of course, here is the rewritten section, crafted to match the expert, natural tone of the provided examples.
Answering the Big Questions in Value Investing
If you're just getting your feet wet with value investing, you're probably wrestling with a few key questions. It's completely normal. Getting these fundamentals straight is the first step toward building a solid, repeatable process and, more importantly, avoiding the classic blunders that trip up so many new investors.
Value vs. Growth: What’s the Real Difference?
Think of value investing as bargain hunting for high-quality goods. You’re looking for great, established companies that the market has temporarily put on the discount rack. The business itself is solid, but for whatever reason—a bad news cycle, sector rotation, or just plain neglect—the stock is trading for less than it's really worth.
Growth investing is a different beast entirely. It's about betting on the future. Investors are chasing companies, often younger and in innovative industries, that are expected to pump out revenue and earnings at a blistering pace, far faster than the overall market. You're paying a premium today for a piece of tomorrow's potential.
When Is the Right Time to Sell an Undervalued Stock?
This is where patience becomes your most valuable asset. The entire premise of value investing is to buy a great business at a fair price and then wait for the market to catch on. This isn't a get-rich-quick scheme; the market can take months, sometimes even years, to recognize a company's intrinsic worth and re-price the stock accordingly.
Your job isn't to perfectly time the market's mood swings. It's to hold on until your original investment thesis proves correct. One of the biggest mistakes I see is investors bailing on a solid company just because the stock price went sideways for a few months.
How Can I Tell a True Bargain from a Value Trap?
A value trap is a stock that looks cheap for a reason—because the underlying business is fundamentally broken. It’s a stock that just keeps getting cheaper. To steer clear, you have to look past the low price tag and scrutinize the business itself for critical warning signs.
Here are a few red flags to watch for:
- Declining Revenue: A company that can't grow its top line is in serious trouble.
- Eroding Margins: Shrinking profitability is a clear sign that the company is losing its competitive advantage.
- Piles of Debt: A weak balance sheet is like an anchor. It can sink a company before it ever has a chance to turn things around.
A genuine bargain has a strong business at its core and a plausible catalyst for a comeback. A value trap is just a dying company on a one-way trip down.
Ready to stop guessing and start building a data-driven process? The ChartsWatcher platform gives you the professional-grade screeners, real-time data, and analytical tools you need to identify undervalued stocks with precision. Start finding your next winning investment today at https://chartswatcher.com.
