How to Read Earnings Reports: A Simple Investor Guide
Demystifying Earnings Reports: What Successful Investors See

Learning to interpret earnings reports is a vital skill for investors. These reports offer valuable insights into a company's financial health and performance. They go beyond just presenting numbers; they tell a story of the company's journey. Successful investors recognize this, using earnings reports as a powerful tool to understand a company's potential.
Unpacking the Essentials of Earnings Reports
Understanding the structure of an earnings report is the first step in analysis. These reports typically include key sections: the income statement, balance sheet, and cash flow statement. The income statement details the company's revenue and expenses. The balance sheet provides a snapshot of the company's assets, liabilities, and equity. Finally, the cash flow statement tracks the movement of cash both into and out of the business.
Think of a simple lemonade stand as an example. The income statement would track the revenue from selling lemonade and the costs of lemons and sugar. The balance sheet would show the value of the stand, pitcher, and any remaining inventory, less any outstanding debts. The cash flow statement would then track the actual cash received from lemonade sales and cash spent on supplies.
Deciphering Key Performance Indicators
Effective analysis of earnings reports goes beyond the basic structure. It involves a deeper understanding of key performance indicators (KPIs). These KPIs provide valuable, quantifiable measurements of a company's performance. Metrics like earnings per share (EPS), revenue growth, and guidance are crucial for assessing profitability and future potential. Understanding these metrics is like checking the vital signs of a business. You might also be interested in learning more about stock chart analysis: How to master stock charts.
Reading earnings reports involves understanding these crucial metrics. In Q1 2025, 78% of S&P 500 companies exceeded expected EPS, and 62% reported higher-than-anticipated revenue. This underscores the significance of EPS in measuring a company’s profitability against analyst expectations. Exceeding these expectations can positively influence stock prices. For instance, if a company’s expected EPS was $1.50, but the actual EPS was $1.60, this positive surprise could boost investor confidence and potentially lead to higher stock valuations. Companies like Ross Stores and Dollar Tree, which reported revenues of $5.13 billion and $7.85 billion respectively in Q1, exemplify the importance of revenue growth within earnings reports. For more detailed information, explore resources like FactSet Earnings Insight.
Developing a Holistic View
For a comprehensive analysis, consider using available tools to assist your investment research. Investment Research Tools can be valuable resources in gathering and interpreting data, allowing you to gain a complete understanding of a company’s financial position within its industry. By analyzing multiple reports over time, investors can identify trends and patterns. This historical context adds important perspective on a company’s long-term potential and sustainability. Ultimately, understanding how to interpret earnings reports equips investors to make informed decisions and potentially achieve better investment returns.
Beyond The Numbers: Key Metrics That Actually Matter
Not all figures in an earnings report are created equal. Learning how to read these reports effectively means understanding which metrics truly matter. This involves looking at the data in context, just like successful investors do. For example, revenue figures alone can be deceptive without understanding their source.
Revenue Trends and Profit Margins: A Deeper Dive
Smart investors don't just look at revenue growth; they consider its sustainability and composition. This includes identifying the core drivers of that revenue and evaluating their long-term viability. Is the company overly reliant on a single product or service, or is its revenue stream diversified? The infographic below illustrates the revenue composition of a hypothetical company.
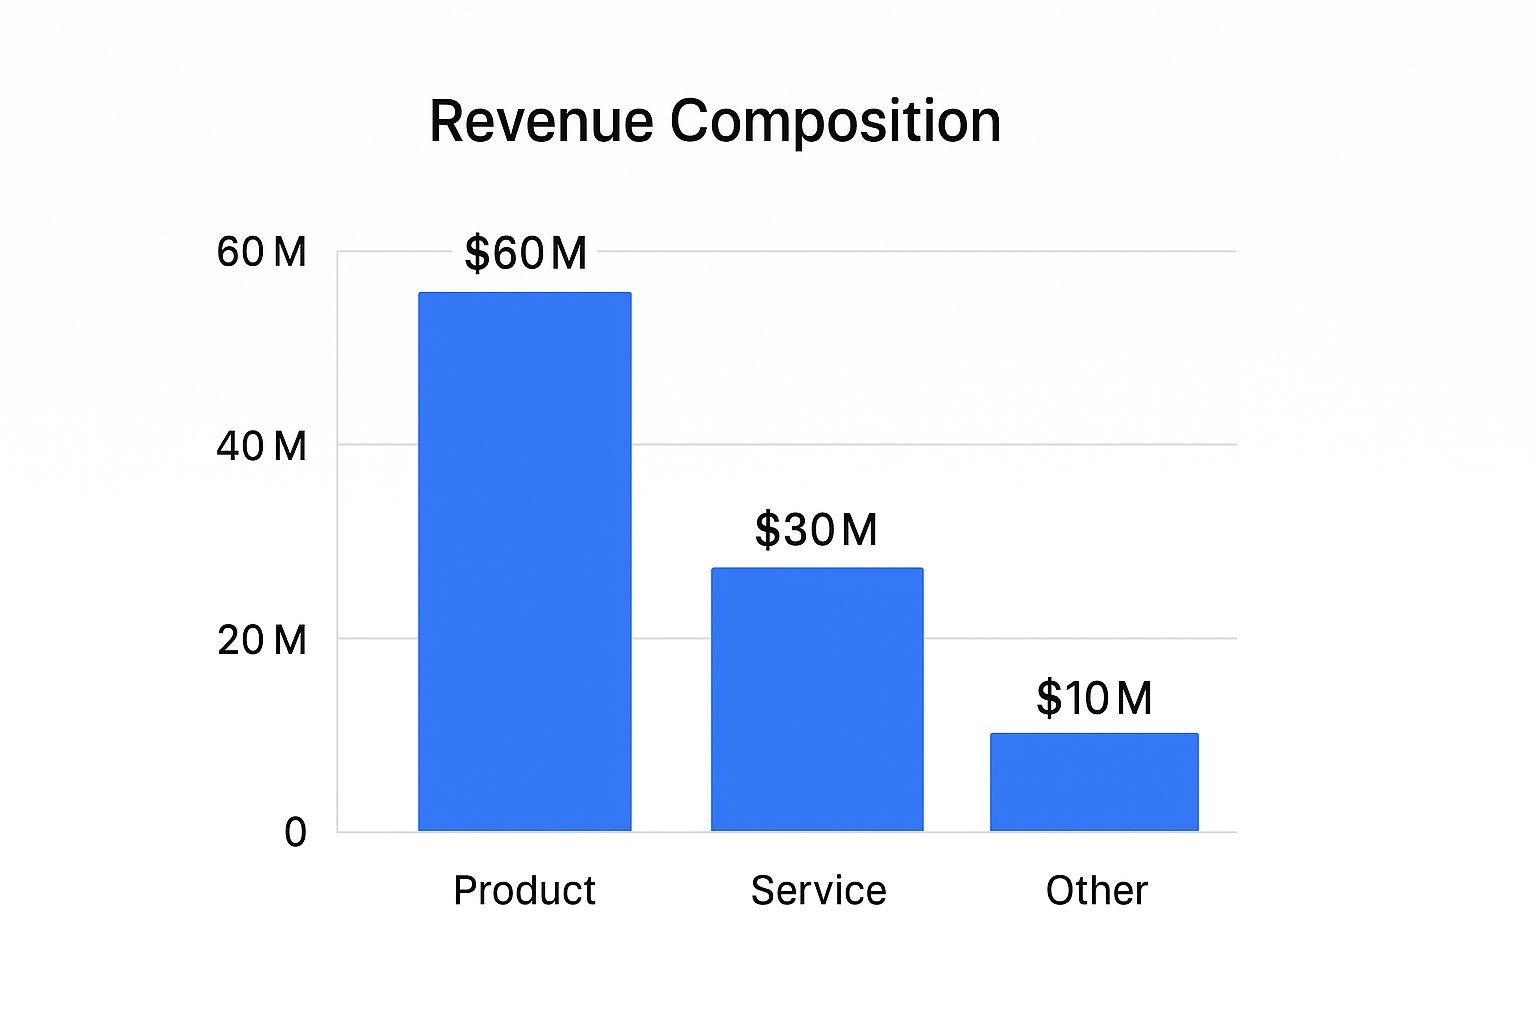
This company generates most of its revenue ($60M) from product sales, with services and other sources playing a smaller role. This suggests a potential over-reliance on product sales, which merits further investigation. Understanding financial statements is essential, and some connect it to a deeper understanding of finance, as discussed in Wisdom of Finance. Furthermore, various profit margins—gross profit margin, operating profit margin, and net profit margin—offer valuable insights into a company's efficiency and profitability.
To help you analyze these reports, here's a table summarizing essential financial metrics:
Essential Financial Metrics in Earnings Reports A comprehensive overview of the most important financial indicators to evaluate when reading earnings reports, with explanations of what each metric reveals about a company's performance.
| Metric | What It Measures | Why It Matters | Red/Green Flags |
|---|---|---|---|
| Revenue | Total sales generated | Top-line growth indicator | Declining revenue trends signal potential issues; consistent growth is a positive sign. |
| Gross Profit Margin | Percentage of revenue remaining after deducting the cost of goods sold (COGS) | Efficiency of production and pricing | Increasing margin suggests effective cost management; shrinking margin could indicate rising costs or pricing pressure. |
| Operating Profit Margin | Percentage of revenue remaining after deducting COGS and operating expenses | Efficiency of overall operations | A rising margin points to improved operational efficiency; a falling margin could signal rising operational costs. |
| Net Profit Margin | Percentage of revenue remaining after all expenses are deducted | Overall profitability | Growth indicates strong financial performance; decline could mean increased expenses or lower revenue. |
| Earnings Per Share (EPS) | Company's net profit allocated to each outstanding share | Profitability on a per-share basis | Compare to past EPS and analyst estimates; be aware of potential manipulation. |
This table provides a quick guide to some of the core metrics you'll want to examine when reviewing an earnings report.
Earnings Per Share (EPS) and Beyond
Earnings per share (EPS) often makes headlines, but it's crucial to look deeper. Compare EPS to previous quarters and analyst estimates to assess the company's performance trend. However, keep in mind that EPS can be influenced by accounting practices, so consider it alongside other metrics. How to master stock chart analysis offers more tools for evaluating performance.
Industry-Specific Metrics: Unveiling The Full Story
Metrics specific to certain industries can be even more insightful than standardized financials. This is because each industry has unique key performance indicators (KPIs). For example, in the tech sector, metrics like monthly active users (MAU) and customer acquisition cost (CAC) offer important data.
Spotting Meaningful Patterns: Quarter-Over-Quarter Changes
Analyzing quarter-over-quarter changes in key metrics reveals trends and potential turning points. Steady improvement in profit margins suggests good management and a sound business model. Conversely, declining revenue growth could be a warning sign. This analysis helps investors identify both positive momentum and potential issues. By learning to recognize these patterns, investors gain a significant edge in understanding earnings reports.
Reading Between the Lines: What Management Isn't Saying

Earnings reports offer a wealth of information, not just in the raw numbers, but also in how management chooses to present those numbers. Decoding management commentary can reveal hidden insights, and sometimes, discrepancies between the narrative and the actual financial performance. This skill is crucial for investors aiming to truly understand a company's situation.
Deciphering Forward-Looking Statements
The Management Discussion and Analysis (MD&A) section often contains forward-looking statements, providing a glimpse into management's expectations. However, it's essential to approach these statements with a critical eye. Phrases like "expect strong growth" or "anticipate challenges" are inherently subjective.
Look for concrete evidence within the report to support these claims. Also, pay close attention to any shifts in tone compared to previous reports. A change from optimistic to cautious, for example, might signal underlying concerns even if the current numbers look good.
Identifying Subtle Language Shifts
Sometimes, subtle changes in wording can reveal issues management might be downplaying. Close reading is vital here. For example, a shift from discussing "revenue growth" to "revenue stability" could suggest slowing momentum. Similarly, a sudden emphasis on "cost controls" might foreshadow declining profit margins.
These seemingly small language shifts can be early warning signs for attentive investors. By carefully analyzing the specific language used, investors can gain valuable insights into the company's true performance and prospects.
Evaluating Management Credibility
Tracking management credibility over time is essential. Compare current statements with past performance and guidance. Has management consistently delivered on its promises? Or have they frequently missed targets or revised expectations downward? Consistent discrepancies between words and actions can be a major red flag.
This long-term perspective helps distinguish genuine optimism from corporate spin. Investors can use tools like TradingView to track earnings calendars, estimated EPS, and reported EPS, preparing for potential stock movements. Historical data, such as Sun Pharmaceuticals exceeding revenue expectations of $47.7 billion in Q4, can also inform investment decisions. For more detailed statistics, explore this resource.
Comparing Earnings Calls: Successes vs. Failures
Analyzing past earnings calls, both from times of success and failure, provides invaluable context. By studying the language and tone used in these calls, you can develop a better sense for distinguishing meaningful insights from empty rhetoric.
Look for patterns in how management framed challenges or celebrated victories. Did companies that ultimately failed use overly optimistic language to mask underlying problems? This type of comparative analysis offers valuable lessons for interpreting current management commentary.
Uncovering Red Flags Before Markets React
Even seemingly impressive earnings reports can sometimes hide underlying issues. By examining companies that experienced significant declines, we can often identify early warning signs present in their financial reports months before problems became public. This proactive approach is crucial for protecting your investments.
Recognizing Accounting Tactics and Concerning Trends
One essential skill is recognizing accounting tactics that create a misleadingly positive picture of financial health. For example, a company might aggressively recognize revenue or defer expenses to artificially inflate short-term profits. This is similar to inflating a balloon – it appears larger temporarily, but eventually deflates. Another red flag is a significant and unexplained increase in accounts receivable. This could suggest difficulties collecting payments, potentially leading to future write-offs. Also, be wary of discrepancies between reported earnings and cash flow from operations. A significant difference might indicate earnings aren't supported by actual cash generation.
Analyzing operational metrics is equally important. Declining key performance indicators (KPIs) like customer acquisition cost (CAC) or customer lifetime value (CLTV) can foreshadow future revenue declines. For example, a rising CAC coupled with a decreasing CLTV for a software company indicates it's becoming more expensive to acquire customers who generate less revenue over time.
Spotting Inconsistencies and Subtle Discrepancies
Comparing information across the income statement, balance sheet, and cash flow statement can reveal inconsistencies. Does the overall narrative align? A substantial inventory increase alongside declining sales might suggest product obsolescence or weakening demand. This thorough cross-referencing can uncover hidden problems.
Pay close attention to subtle discrepancies between management's commentary and the reported numbers. Is management downplaying negative aspects or overemphasizing positive ones? Does their outlook align with broader industry trends? Carefully review the Management Discussion and Analysis (MD&A) section for shifts in tone and consistency with previous reports.
Before we delve into real-world examples, let's review some common red flags to look for in earnings reports. The table below provides a detailed comparison of these warning signs.
Common Red Flags in Earnings Reports
| Warning Sign | What to Look For | Potential Implication | Examples |
|---|---|---|---|
| Aggressive Revenue Recognition | Revenue booked before product delivery or service completion | Inflated short-term profits, potential future restatements | Recognizing revenue for multi-year contracts upfront |
| Unexplained Surge in Accounts Receivable | Significant increase in money owed by customers | Difficulty collecting payments, potential bad debts | A sudden jump in days sales outstanding (DSO) |
| Discrepancy Between Earnings and Cash Flow | Large gap between reported earnings and cash generated from operations | Earnings might not be sustainable | Earnings growth without corresponding cash flow growth |
| Declining Operational Metrics | Worsening KPIs like CAC, CLTV, or churn rate | Deteriorating business fundamentals, potential future revenue decline | Increasing CAC and declining CLTV for a SaaS company |
| Inconsistent Financial Statements | Conflicting information across income statement, balance sheet, and cash flow statement | Potential accounting irregularities or hidden problems | Rising inventory with declining sales |
| Misleading Management Commentary | Downplaying challenges or overhyping positive aspects | Attempt to obscure negative trends | Optimistic forecasts despite declining market share |
This table highlights the importance of a comprehensive analysis. By looking beyond the headline numbers and digging into the details, you can better assess a company's true financial position.
Real-World Case Studies: Learning From Past Mistakes
Examining real-world case studies provides valuable lessons. Companies like Blockbuster and Kodak, despite seemingly healthy reports at times, ultimately experienced substantial declines. Analyzing their historical reports can reveal subtle indicators that foreshadowed these downturns. For instance, Blockbuster's inability to adapt to the rise of online streaming was evident in stagnating subscriber numbers and increasing debt, even as management touted its retail presence.
By studying these cases and using platforms like ChartsWatcher for market analysis, investors can learn to recognize similar patterns. This proactive approach allows for a timely reevaluation of investment positions, potentially mitigating losses before market valuations decline.
Competitive Context: How Top Investors Compare Companies
Individual earnings reports offer a glimpse into a company's performance, but they don't provide the full picture. Much like a single puzzle piece, an earnings report needs the context of the competitive landscape to be truly understood. Top investors grasp this, utilizing peer comparison to develop a more comprehensive understanding of a company's actual position.
Benchmarking Against Competitors: Unveiling Relative Performance
Smart investors establish meaningful benchmarks by comparing a company's performance not only to its direct competitors but also to overall industry trends. This process involves pinpointing key competitors within the same sector and analyzing their financial metrics alongside those of the target company. For example, when evaluating Google's earnings, an investor might compare its performance in Search and Cloud to competitors like Microsoft and Amazon. This comparison reveals how Google measures up against similar companies competing for the same market share. Just as athletes are measured against their peers, companies must be analyzed within their competitive context.
Identifying the Most Valuable Metrics for Cross-Company Comparison
Different sectors prioritize different metrics. In the tech industry, monthly active users (MAU) and customer acquisition cost (CAC) are often critical. In retail, however, metrics like same-store sales growth and inventory turnover carry more weight. Understanding the most relevant metrics for a specific industry allows for more accurate comparisons, highlighting sector-specific strengths and weaknesses.
Accounting for Differences in Business Models and Growth Stages
Direct comparisons aren't always straightforward. Companies in the same sector can have different business models or be at different stages of growth. A rapidly growing startup will likely have different financials than a well-established corporation. Investors account for these differences by adjusting their analysis. For example, comparing revenue growth rates might be more insightful than comparing total revenue for companies of different sizes.
Distinguishing Company-Specific Issues From Industry-Wide Challenges
Analyzing multiple companies within a sector helps determine if a company's performance is due to internal issues or broader market trends. If an entire industry sees declining profits, it could signal a downturn rather than company-specific problems. Conversely, if a company underperforms its peers in a positive market environment, it may suggest internal challenges. By examining both quarterly and annual reports, along with competitor data from platforms like ChartsWatcher, investors gain a more holistic understanding. This allows them to discern the true drivers of a company's performance.
Building Your Earnings Analysis Toolkit

Analyzing earnings reports effectively requires a structured approach and the right resources. It's more than just skimming through the numbers; it's about understanding the story those numbers tell. This section will guide you through building a personalized toolkit to analyze earnings reports and make informed investment decisions.
Essential Tools and Platforms
Professional investors utilize various platforms to track, organize, and interpret earnings data. Yahoo Finance provides readily accessible information, including earnings calendars, transcripts, and analyst estimates. Specialized platforms like Bloomberg Terminal and Refinitiv Eikon offer comprehensive data, sophisticated tools, and real-time market insights, but these often come at a substantial cost.
Fortunately, accessible options exist for individual investors. Free stock screeners like Finviz allow filtering companies based on financial metrics. Many brokerage platforms also offer research tools, including earnings summaries and analyst ratings, directly within your trading account.
Creating Your Personalized Tracking System
A personalized tracking system is essential for staying organized and focused on relevant metrics. First, identify the key performance indicators (KPIs) aligned with your investment strategy. For example, value investors might focus on the price-to-earnings ratio (P/E) and book value, while growth investors might prioritize revenue growth and market share.
Use a spreadsheet or portfolio tracking tool to monitor these KPIs for your chosen companies. Set up alerts for upcoming earnings releases and significant price movements. This helps maintain a comprehensive overview, especially with a larger portfolio.
Automating Routine Analysis and Extracting Meaningful Insights
Automating routine tasks allows more time for in-depth analysis. Spreadsheets or tracking software can automatically calculate key ratios and track historical trends. This helps quickly spot anomalies and potential investment opportunities. Many platforms also offer customizable dashboards to visualize key metrics and compare companies within an industry.
Technology is a powerful tool, but critical thinking is paramount. Don't rely solely on automated analysis. Examine the management's discussion and analysis (MD&A) and consider the broader economic and competitive landscape. Examining company earnings releases, like Moderna's Q1 2025 report, can provide valuable context.
Sustainable Practices for Long-Term Success
A sustainable approach to earnings analysis requires consistency and efficiency. Dedicate specific time each week or month for review and updates. Focus on core investments to avoid information overload and distractions.
By building a personalized toolkit and implementing sustainable practices, you can integrate earnings report analysis seamlessly into your investment routine. Ready to elevate your market analysis? ChartsWatcher offers professional traders a dynamic platform for tracking, analyzing, and interpreting market movements with real-time data and customizable dashboards.
