What Is Backtesting? what is backtesting and why it matters
Think of backtesting as a time machine for your trading ideas. It’s the process of taking a trading strategy and running it against historical market data to see exactly how it would have performed in the past. This simulation is your secret weapon, letting you gauge a strategy's potential before you risk a single dollar of your hard-earned capital.
A Trader's Guide to Looking Backwards to Move Forwards
Imagine a professional football team getting ready for the Super Bowl. They don’t just run new plays on the practice field; they spend countless hours watching old game tapes. They break down what worked, what failed, and—most importantly—why. This intense review process gives them a data-driven edge, helping them fine-tune their approach to exploit an opponent's weaknesses and avoid repeating past mistakes.
For a trader, backtesting is your game tape.
Instead of throwing money at a hunch or a hot tip, you can simulate your strategy against months, years, or even decades of real price action. This is how you get honest answers to the tough questions every trader has to ask before putting money on the line.
Core Components of a Backtest
At its core, every reliable backtest is built on three essential pillars. Getting these right is the first and most critical step toward building a testing process you can actually trust.
| Component | Role and Importance | Example in ChartsWatcher |
|---|---|---|
| A Clear Strategy | Your trading idea must be defined by a set of concrete, non-negotiable rules. Any ambiguity or "gut feel" will completely invalidate your results. | Using the Condition Builder to set exact entry and exit criteria, like "Buy when RSI(14) crosses below 30." |
| Reliable Historical Data | The quality of your simulation is only as good as the data you feed it. Inaccurate, incomplete, or "gappy" data will produce wildly misleading results. | Accessing tick-by-tick historical data for major indices and assets, ensuring your test reflects real market conditions. |
| A Powerful Simulation Engine | This is the software that does the heavy lifting. It takes your rules, applies them to the historical data, executes the simulated trades, and crunches the numbers. | The Backtesting Module in ChartsWatcher, which simulates trades and generates detailed performance reports based on your inputs. |
Getting these three components right is non-negotiable. They are the foundation upon which every valid trading insight is built.
Backtesting provides a crucial feedback loop. It transforms a subjective trading idea into an objective, data-backed strategy, giving you a statistical foundation for your decisions in the live market.
The idea of simulating trades isn't new—it has roots going back to the 1970s. But it’s become absolutely essential with the rise of algorithmic and systematic trading. For example, testing a high-frequency strategy on tick-level data reveals critical details that daily data completely misses. Things like slippage can spike by up to 0.5% during volatile periods, turning a profitable strategy into a losing one.
Professional traders using robust platforms might see win rates of 55-65% in historical tests, but those figures are only realistic when using granular, tick-accurate data. If you don't, you could overstate your estimated returns by as much as 15-30%—a massive margin in today's fast-moving markets. For a deeper dive, discover more about using granular data in strategy testing.
The Building Blocks of a Reliable Backtest
A backtest is an experiment, pure and simple. And just like any scientific experiment, its results are only as good as its setup. Garbage in, garbage out. To build a simulation you can actually trust, you need to get three core ingredients right: pristine historical data, a crystal-clear strategy, and a powerful backtesting engine.
Getting these elements right isn’t just a nice-to-have; it's the only way to move from wishful thinking to data-driven confidence. Each piece plays a critical role in making sure your results reflect a potential reality, not just a statistical fantasy.
High-Quality Historical Data
Historical data is the fuel for your backtesting engine. The quality, granularity, and scope of this data directly dictate how reliable your results will be. Think of it this way: trying to backtest a day-trading strategy using only end-of-day prices is like trying to analyze a football game by only looking at the final score. You miss all the critical plays that decided the outcome.
To run a meaningful test, you need data that actually matches the frequency of your strategy.
- End-of-Day (EOD) Data: This gives you the open, high, low, and close prices for a single day. It’s perfectly fine for long-term investment strategies but completely useless for anything happening inside a single trading session.
- Minute Data: This captures price information for every minute the market is open. It’s a huge step up for swing or intraday strategies, offering a much clearer picture of daily price action.
- Tick Data: This is the most granular data you can get, recording every single trade that occurs. For high-frequency or scalping strategies, tick data is non-negotiable. It's the only way to accurately simulate entries, exits, and the real impact of the bid-ask spread.
A classic rookie mistake in backtesting is using the wrong data. A strategy might look like a world-beater on EOD data, only to fall apart completely when tested on tick data that reveals the true, painful cost of slippage and commissions.
A Crystal-Clear Trading Strategy
The second pillar of a solid backtest is a trading strategy defined with absolute precision. There can be zero room for ambiguity, "gut feelings," or subjective calls. A computer can only execute what you tell it to, so every single rule for your entries, exits, and position sizing must be concrete and programmable.
For example, a vague rule like "buy when the stock looks oversold" is impossible to backtest. A testable rule, however, is specific: "Buy when the 14-period Relative Strength Index (RSI) on the 5-minute chart crosses below 30."
This level of detail is non-negotiable because it removes human bias from the equation. The whole point of backtesting is to objectively evaluate a specific set of rules, and that's only possible when those rules are completely black and white. For a better understanding of how to source this crucial information, learn more about how to download historical stock data for your analysis.
A Powerful Backtesting Engine
Finally, you need the backtesting engine—the software that puts it all together. This is the simulator, like the one built into ChartsWatcher, that takes your rules, runs them against the historical data, and spits out the performance. A robust engine does way more than just match entry and exit signals with prices.
It absolutely must account for the real-world frictions of trading, including:
- Commissions: Every trade costs money, and these fees have to be subtracted from your gross profits.
- Slippage: This is the gap between the price you expected and the price you actually got. A good engine will simulate slippage to give you a much more realistic bottom line.
- Market Impact: For strategies trading huge volumes, the act of trading itself can move the market price.
Choosing a testing period that covers different market conditions—bull markets, bear markets, and sideways chop—is just as important. A strategy that only works in a roaring bull market isn't a strategy; it's a lucky guess. By making sure these three building blocks are solid, you create a foundation for a backtest that can give you insights you can actually use.
How to Interpret Your Backtest Report
Once a backtest finishes, it spits out a report crammed with numbers and charts. But what does it all mean? This is where the real work begins. Moving past the final profit and loss figure is absolutely essential if you want to understand a strategy's true character and, more importantly, its risk profile.
Think of it like a medical check-up for your trading idea. The total profit is just one number, kind of like knowing a patient's weight. It's a start, but it tells you nothing about their blood pressure, heart rate, or overall health. To really know if your strategy is fit for the live markets, you have to dig into its vital signs.
This process starts with a solid foundation, built from three core parts that feed into every backtest.
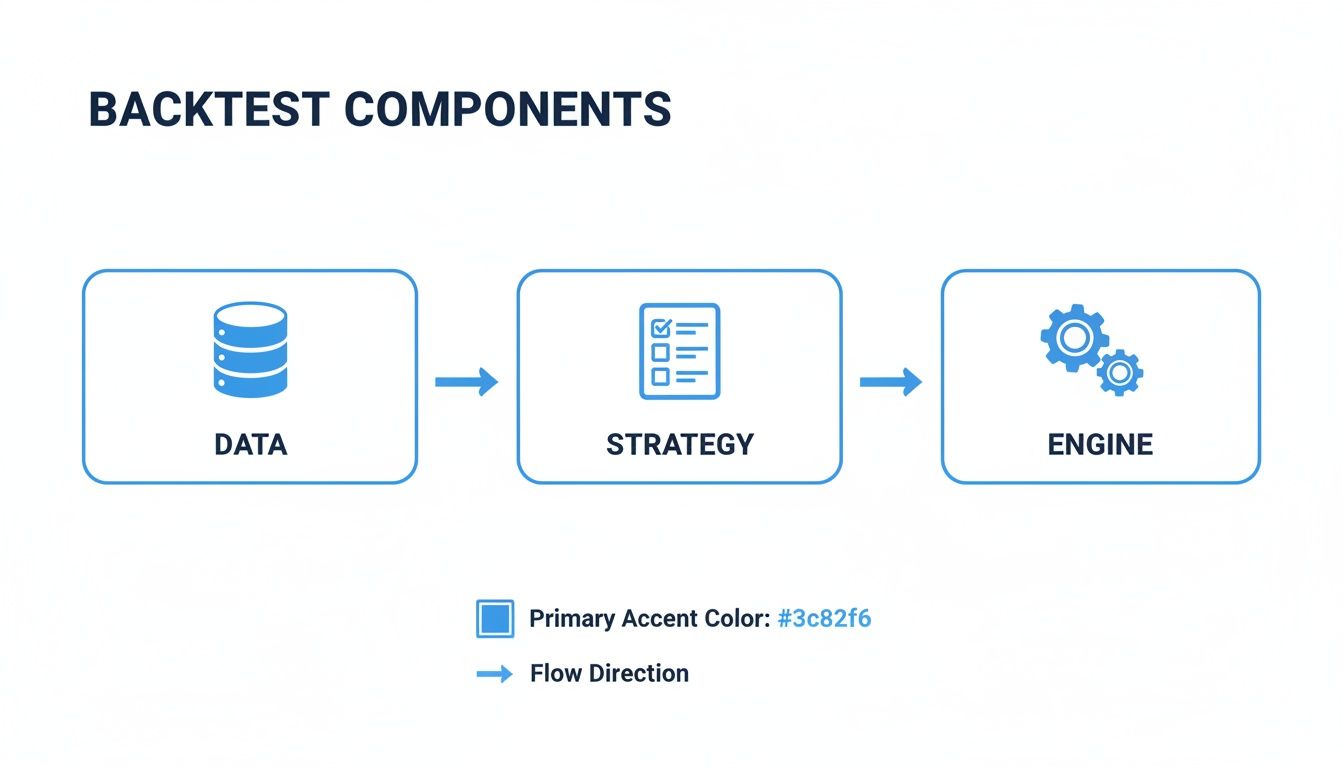
As you can see, reliable data flows into a clearly defined strategy, which is then processed by a robust engine. Each piece has to be solid for the final report to be worth anything.
Reading the Equity Curve
If you only look at one thing, make it the equity curve. This is the single most important visual in your report. It's a simple graph that plots your account's value over the entire backtesting period, telling the story of your strategy’s journey, warts and all.
Ideally, you want to see a smooth, steady line moving from the bottom left to the top right. A choppy, erratic curve—even one that ends in a profit—is a huge red flag. It signals a high-stress, volatile strategy that will be psychologically brutal to trade with real money. A smoother curve, on the other hand, points to consistent performance and a more predictable system.
Understanding Maximum Drawdown
While the equity curve shows the whole trip, the Maximum Drawdown (MDD) reveals the most painful part. This metric measures the single largest drop from a peak to a trough that your account suffered during the test. It's expressed as a percentage, and it represents that gut-wrenching nosedive that tests every trader's resolve.
If your backtest shows a 35% maximum drawdown, you have to be brutally honest with yourself: could you really watch 35% of your capital disappear without panicking and abandoning the strategy? This number is a critical reality check against your actual risk tolerance.
A low drawdown is often just as important as high returns. For instance, a strategy pulling in a 20% annual return with a 10% MDD is usually far superior to one making 30% with a 40% MDD. The first offers a much saner, more manageable risk profile that you can stick with.
Gauging Risk-Adjusted Returns with Key Metrics
Great, you've looked at the big picture with the equity curve and drawdown. Now it's time to get a bit more granular to evaluate the quality of your returns. A few key performance indicators (KPIs) give you a much more nuanced view than just the final P&L.
To wrap your head around these different numbers, it helps to see them side-by-side. Here's a quick breakdown of the metrics I always check first.
Essential Backtesting Performance Metrics
| Metric | What It Measures | Why It's Critical |
|---|---|---|
| Sharpe Ratio | Return generated per unit of risk (volatility). | Answers the question: "Were the returns worth the bumpy ride?" A ratio above 1.0 is good; over 2.0 is excellent. |
| Profit Factor | Gross profits divided by gross losses. | Shows if your winning trades are powerful enough to overcome the losers. A value over 1.5 is solid; 2.0 is very strong. |
| Max Drawdown | The largest peak-to-trough decline in equity. | A direct measure of the psychological pain a strategy can inflict. It helps you match a strategy to your personal risk tolerance. |
| Avg. Win / Avg. Loss | The average size of your winning trades vs. your losing trades. | Reveals if your edge comes from a few huge wins or many small, consistent ones. You want your average win to be significantly larger. |
Looking at these metrics together gives you a complete story. A strategy with a huge total return might look amazing at first glance, but if it comes with a terrifying drawdown and a low Sharpe Ratio, you're likely looking at a ticking time bomb.
Finally, how you present this data matters, even if it's just for yourself. Following some basic data visualization best practices can make your reports much easier to understand at a glance. Clear visuals are what help turn that raw data from your backtesting into real, actionable trading intelligence.
Common Backtesting Mistakes to Avoid
Even with the sharpest tools and cleanest data, a backtest can easily steer you wrong if you fall into a few common traps. Think of these mistakes like hidden currents that can drag your strategy off course, making a bad idea look brilliant or a good idea look worthless. Learning to navigate these pitfalls is a non-negotiable skill for any serious trader.
The goal isn't just to run a test; it's to run one that reflects a plausible reality. By learning to spot these errors before they poison your results, you build the critical awareness needed to generate trustworthy insights from your backtesting.
The Allure of Overfitting
The single most dangerous trap in backtesting is overfitting. This is when you tweak your strategy's parameters over and over until it perfectly matches the historical data you're testing on. It’s like a student who memorizes the answers to last year's exam; they can ace that specific test but will fail miserably when given a new one with different questions.
An overfitted strategy might paint a beautiful, smooth equity curve in your backtest, but it's just a statistical illusion. It hasn't learned a genuine, repeatable market edge—it has only learned the "noise" of the past.
A backtest showing a Sharpe Ratio over 3.0 or a win rate of 85% should be met with extreme skepticism, not excitement. These are often the tell-tale signs of an overfitted system that will likely fall apart in live trading.
To fight this, you have to test your strategy on data it has never "seen" before. This is where methods like walk-forward analysis become invaluable. This approach mimics live trading by periodically optimizing a strategy on one chunk of data (the training set) and then testing its performance on the next, unseen chunk of data (the out-of-sample set).
Ignoring Survivorship Bias
Another costly mistake is survivorship bias. This sneaks in when your historical dataset only includes assets that have "survived" to the present day. For instance, if you backtest a strategy on the current list of S&P 500 companies over the last 20 years, your test completely ignores the companies that were once in the index but went bankrupt or got acquired.
This creates an unrealistically rosy picture of the market. Your results get an artificial boost because you've conveniently filtered out all the losers. In fact, studies have shown that failing to correct for this bias can inflate a strategy's perceived returns by as much as 30%—a massive and dangerous gap between perception and reality.
To avoid this, you must use a point-in-time database that accurately reflects the market's composition at any given historical moment, including all the delisted and failed companies.
The Danger of Look-Ahead Bias
Finally, there’s the subtle but deadly error of look-ahead bias. This happens when your backtest accidentally uses information that wouldn't have been available at the moment of the trade. It’s the equivalent of having tomorrow's newspaper today—of course you'd make winning bets.
Common ways this creeps into a backtest include:
- Using end-of-day data to trade at the open: A strategy might use a stock's closing price to decide to buy it at that same day's open, which is impossible.
- Acting on revised data: Economic data or company earnings are often revised after their initial release. A proper backtest must use the data as it was originally reported.
Thankfully, the industry has evolved to combat these biases. Walk-forward analysis, for example, became a standard in the early 2000s to better simulate how traders truly operate by reassessing strategies as new data comes in. More recently, accurate backtests using high-frequency tick data have shown that strategies can boost their Sharpe ratios from 0.8 to 1.4 just by avoiding end-of-day biases. For a closer look at how clean data avoids these pitfalls, you can read more about backtesting a trading strategy on bookmap.com.
How to Run Your First Backtest with ChartsWatcher
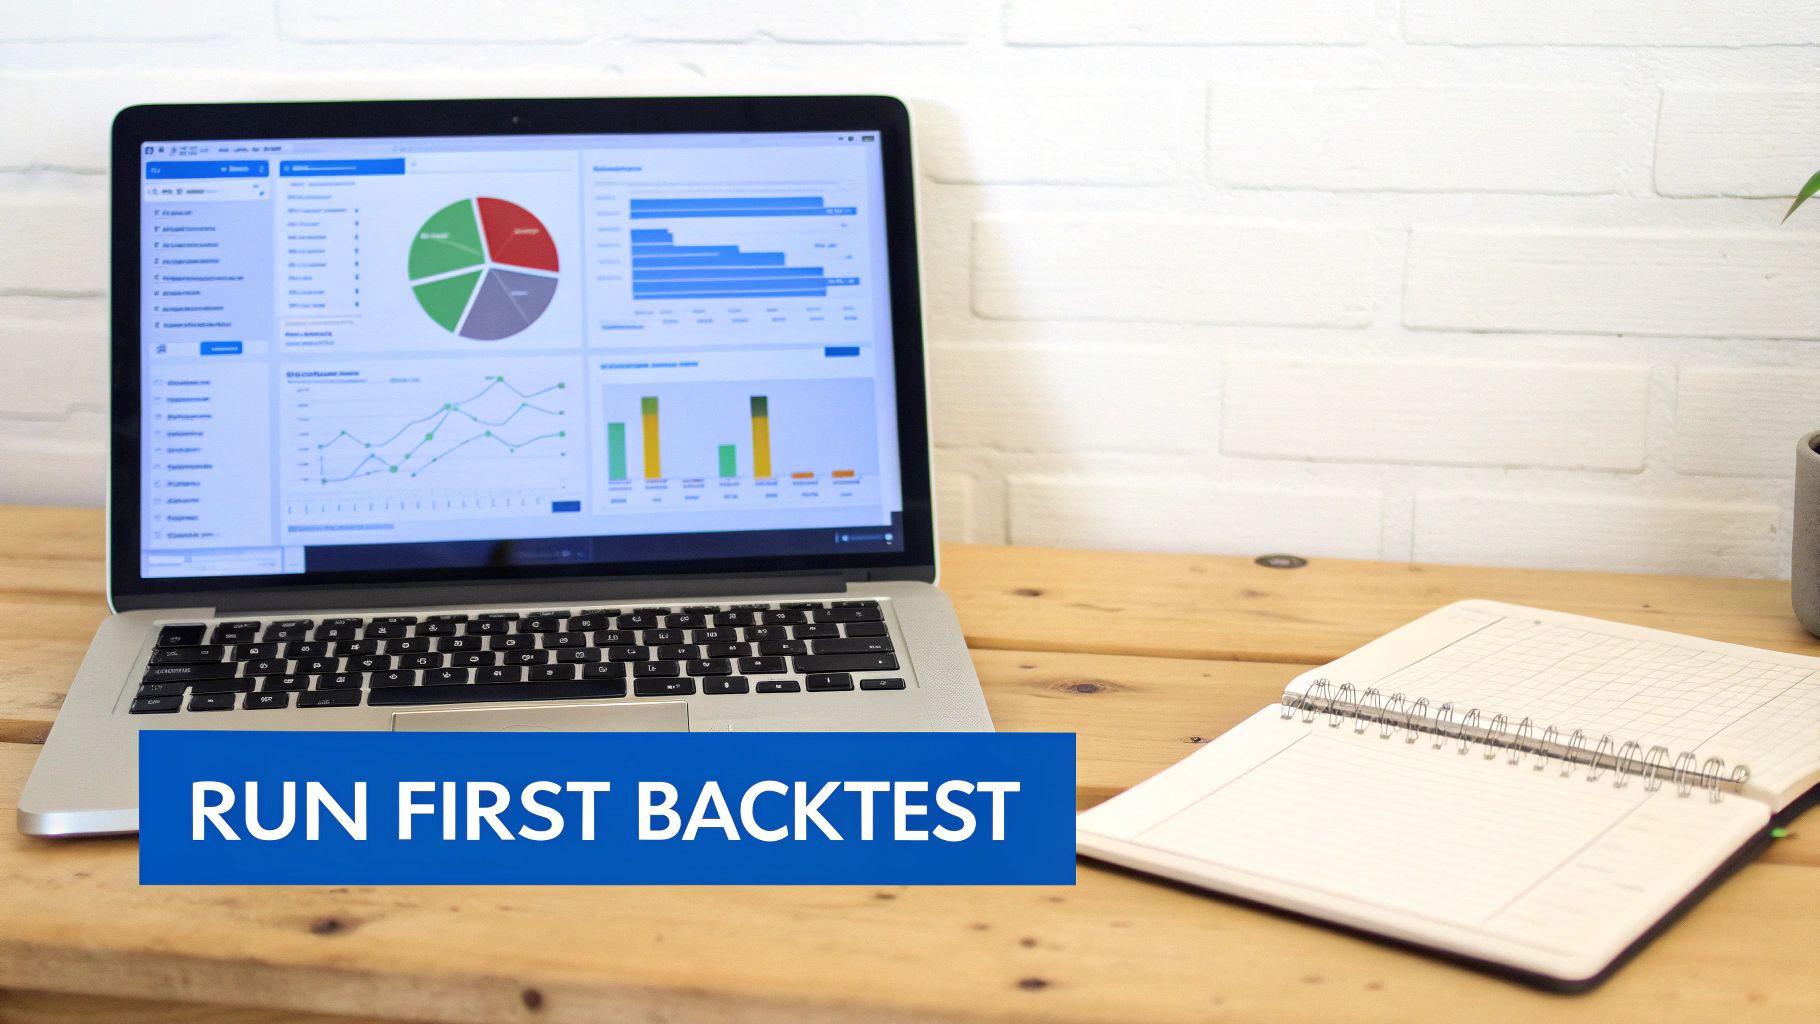
Theory is great, but the real learning happens when you get your hands dirty. So, let's move from concepts to clicks and run your very first backtest right here in ChartsWatcher. This guide will walk you through the whole thing, step-by-step, so you can start testing your own ideas with confidence.
We’ll start with a classic strategy everyone knows: the moving average crossover. It’s simple, rule-based, and the perfect setup to show you just how straightforward this process can be.
Step 1: Lay Down Your Strategy Rules
Before you test anything, you need crystal-clear rules. No ambiguity. In ChartsWatcher, you’ll do this with the intuitive filters and condition builder. A backtest can’t guess what you mean by "maybe" or "sometimes"—every single action needs a concrete trigger.
For our moving average crossover, the rules are clean and simple:
- Entry Signal (Buy): The 20-period Simple Moving Average (SMA) crosses above the 50-period SMA on a daily chart. This is our signal that momentum might be shifting upwards.
- Exit Signal (Sell): The 20-period SMA crosses back below the 50-period SMA. This tells us the upward trend could be losing steam, so it’s time to get out.
That’s it. These two rules are the entire brain of our trading system. The backtesting engine will follow them to the letter.
Step 2: Configure Your Backtest Parameters
With your strategy logic in place, it's time to set up the simulation's environment. These settings are what make your test realistic and relevant to how you actually trade. You'll find them right on the main backtesting dashboard.
Here are the key knobs to turn:
- Pick Your Market and Ticker: First, decide what you want to test. Let’s go with a major index like the SPDR S&P 500 ETF (SPY) for this run.
- Define the Historical Period: The timeframe is critical. You need to cover different market conditions—bull, bear, and boring sideways action. A 10-year window, say from January 1, 2014, to December 31, 2023, is a solid starting point.
- Set Initial Capital: This is the starting balance of your simulated account. We’ll use $100,000 to keep the math clean and simple.
- Factor in Transaction Costs: This is non-negotiable if you want a dose of reality. Set a commission (e.g., $1 per transaction) and estimate your slippage (e.g., 0.05% per trade) to mimic the real-world gap between your expected price and your fill price.
One of the biggest rookie mistakes is running a backtest without costs. Even tiny commissions and slippage can chew through profits over hundreds of trades, turning a "winner" on paper into a loser in your account.
Step 3: Run the Test and See What Happened
Okay, rules and parameters are locked in. Now for the fun part. Hit that "Run Backtest" button and let the ChartsWatcher engine do the heavy lifting. It will apply your rules to every single trading day over the entire 10-year period.
The engine simulates every trade, deducts your costs, and spits out a detailed performance report. Once it’s done, you’ll see the results dashboard—this is where you’ll find the metrics we talked about earlier, like the equity curve, maximum drawdown, and Sharpe ratio. By digging into these numbers, you can get an objective answer to whether your moving average strategy actually had an edge.
Using high-quality data is everything, especially for faster strategies. In fact, studies show that high-frequency strategies tested on tick-level data can see their performance drop by 20-40% when re-tested on less detailed minute-level data. Why? Because tick data captures the real spread and slippage during volatile moments, giving you a much truer picture of performance.
For a deeper dive into designing and interpreting your tests, be sure to check out our complete guide on how to backtest a trading strategy.
Moving from Backtest to Live Trading
Getting a successful backtest is a huge milestone, but it's not the finish line. It's more like a green light to move on to the next phase of development.
While a profitable simulation gives you a strong hint that you've found a statistical edge, it's never a guarantee of future profits. The market is a living, breathing thing—dynamic and unpredictable. Historical data can only tell you what did happen, not what will happen.
The next step is to carefully bridge the gap between the clean, controlled world of your backtest and the beautiful chaos of the live market. This is a critical stage where you find out if your strategy can actually survive contact with real-time conditions before a single dollar is put on the line.
The Critical Role of Forward Testing
Before you ever think about going live, every solid strategy needs to go through forward testing, which you probably know as paper trading.
This just means you're running your strategy in a live market simulation. You're using real-time data and executing trades just as you would for real, but without risking any actual money. This step is completely non-negotiable for a few key reasons:
- Validates Performance: It’s the ultimate reality check. Does your backtested edge actually hold up in today's unpredictable market?
- Identifies Hidden Flaws: Forward testing is fantastic at exposing the little gremlins your backtest might have missed. Things like unexpected data feed lag or spreads that blow out during a news event.
- Builds Procedural Fluency: This is where you get your reps in. It lets you practice executing your system so that when real money is at stake, you can manage trades smoothly and without hesitation.
Forward testing is your final dress rehearsal. It’s where you prove to yourself that the strategy works not just on a spreadsheet, but in the messy reality of the here and now.
Ultimately, backtesting isn’t a one-and-done event. It's part of a continuous cycle of improvement. The best traders are always cooking up new ideas, testing them against historical data, validating them with a forward test, and then tweaking their approach based on live results.
This disciplined process is what separates a hopeful speculator from a data-driven trader—one who truly understands their edge and has the confidence to execute it consistently.
Common Questions About Backtesting
As you start your journey into systematic trading, a few questions always seem to pop up. Let's tackle some of the most common ones to help you build confidence and get your testing process on the right track.
How Much Historical Data Do I Really Need?
There’s no magic number here—it all comes down to your strategy's trading frequency. The goal is to use enough data to prove your strategy's performance isn't just a lucky break tied to a specific market trend.
A good rule of thumb is to match the data's length to how long you hold a trade:
- Short-Term Strategies (Day Trading/Scalping): If your trades last minutes or hours, 2-3 years of detailed intraday or even tick data should do the trick. That's usually enough time to see how your system behaves in different volatility environments.
- Long-Term Strategies (Swing/Position Trading): For strategies that hold positions for days, weeks, or even months, you'll want to aim for at least 10-15 years of daily data. This ensures you’ve tested your idea through major economic cycles, including booms, busts, and those long, grinding sideways markets.
Can I Backtest a Discretionary Strategy?
This is a classic question. True, automated backtesting needs a strategy to be 100% rule-based so a computer can follow the instructions perfectly, every single time. Discretionary trading, on the other hand, is built on human intuition, gut feelings, and subtle pattern recognition. A machine just can't replicate that.
But that doesn't mean backtesting is useless for a discretionary trader. Far from it. You can—and absolutely should—backtest the rule-based parts of your system. For example, you can test the historical performance of a specific chart pattern you like to trade, your entry signals, or your risk management rules (like a 'never lose more than 2% on a trade' rule) to validate the systematic elements of your process.
What Is a Good Sharpe Ratio, Anyway?
While the "right" number depends on your goals, there are some generally accepted benchmarks for the Sharpe Ratio. This metric is a big deal because it answers a critical question: were your returns actually worth the risk and volatility you had to sit through to get them?
A Sharpe Ratio under 1.0 is generally considered a poor risk-adjusted return. A ratio between 1.0 and 2.0 is seen as good, and anything above 2.0 is viewed as very strong—it signals you're getting excellent returns for the amount of risk taken.
A quick word of warning: be very skeptical of backtests showing sky-high Sharpe Ratios (think 3.0 or more). While it looks fantastic on paper, it's often a massive red flag for overfitting, where the strategy was tweaked a little too perfectly to fit the past and is almost certain to fall apart in live trading.
Ready to stop guessing and start testing? With ChartsWatcher, you get access to a powerful, intuitive backtesting engine designed to help you validate your trading ideas with historical data.
