Download Historical Stock Data Easily: Quick Guide
Why Smart Investors Can't Ignore Historical Stock Data
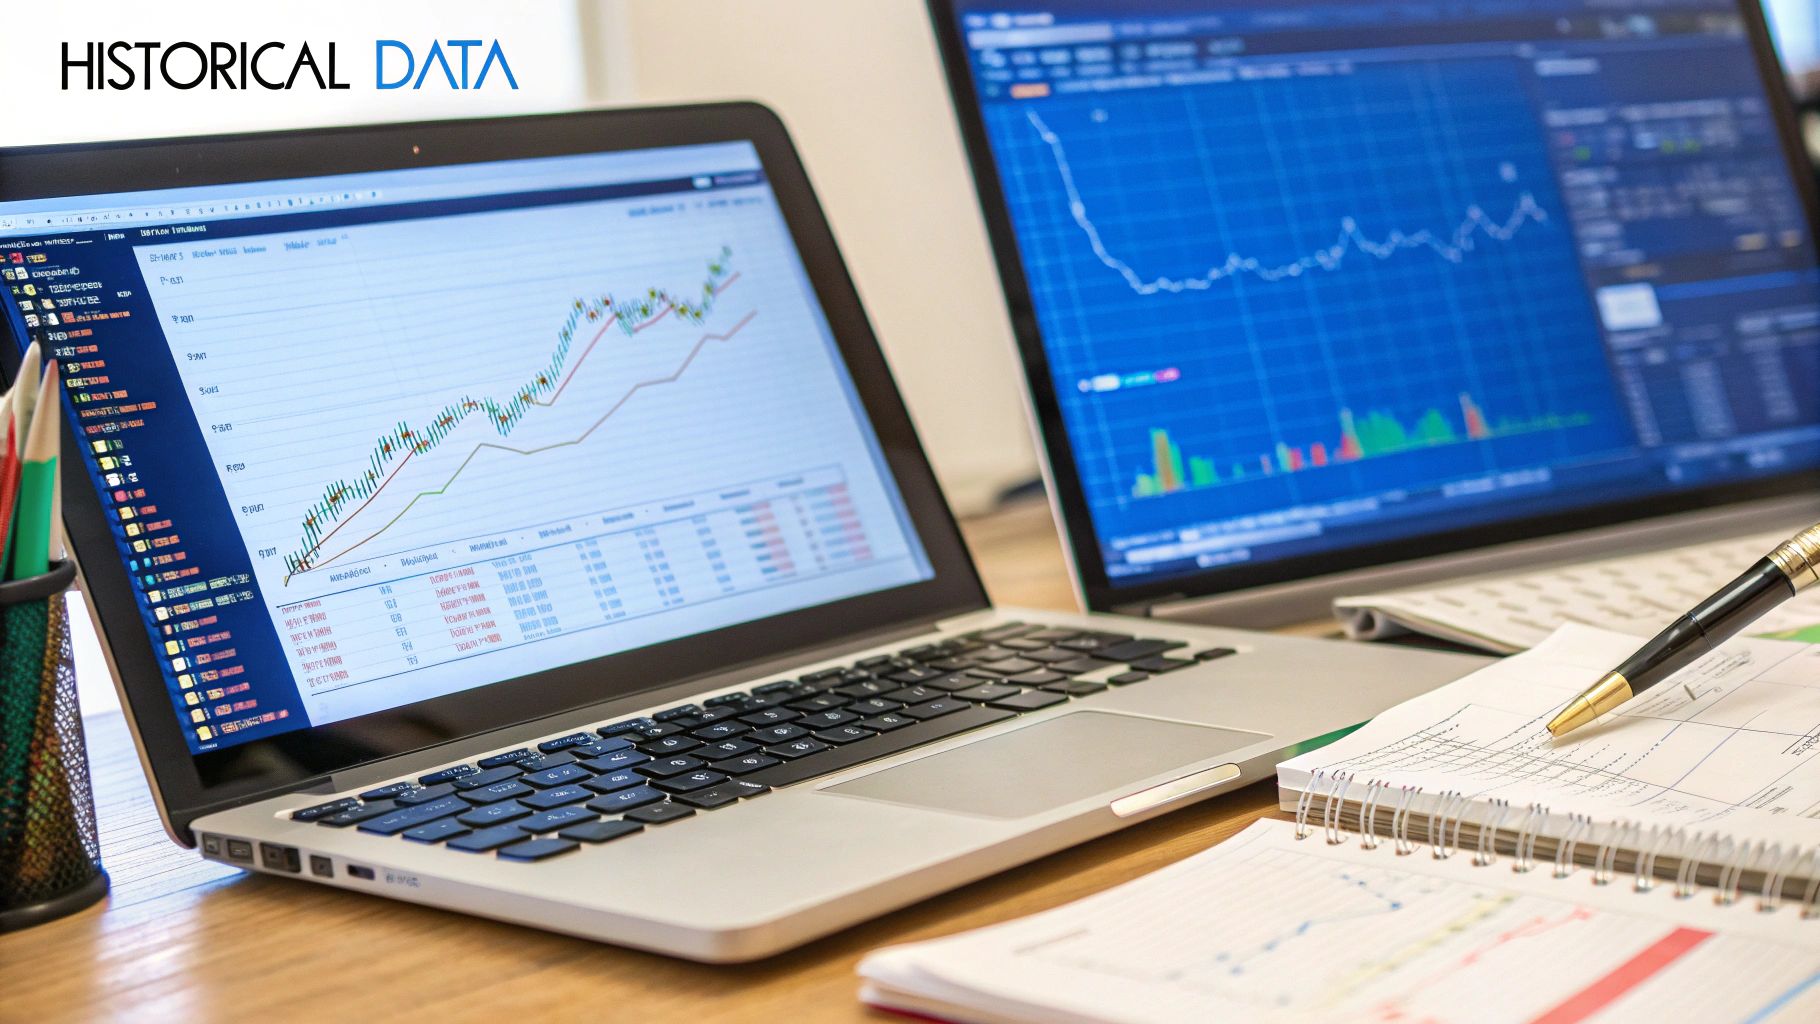
Investing without considering historical stock data is like sailing without a map. Savvy investors know the value of understanding the past. They use historical stock data to reveal patterns and make better decisions. This data offers valuable insights into market behavior and potential future trends.
Uncovering Market Cycles and Validating Investment Theories
For example, by downloading historical stock data, investors can identify recurring market cycles. This helps them anticipate potential market highs and lows. Furthermore, historical data allows investors to test and validate investment theories. By backtesting strategies against decades of market performance, they can refine their approach and avoid expensive errors. This replaces guesswork with data-driven evidence.
The Secret Weapon of Successful Investors
Access to comprehensive historical datasets has become essential for serious market players. By studying past market reactions to specific events, like recessions or policy changes, investors can better position their portfolios for similar future situations. Downloading historical stock data has become a crucial tool for investors, analysts, and researchers globally, especially for major markets such as the US, Europe, and Asia. One key dataset is the Dow Jones Industrial Average (DJIA) historical data, spanning over 100 years. For instance, the DJIA closed at 99.79 in 1919 and reached 6152.87 by February 2025, reflecting the growth and volatility of the US stock market over a century. Learn more here.
Risk Assessment and Portfolio Optimization
Historical stock data isn't just about finding opportunities; it's also about managing risk. By analyzing historical volatility and drawdowns, investors can better understand potential downside risks. This allows them to construct more resilient portfolios that can withstand market downturns. This knowledge empowers investors to make data-backed decisions, optimizing their portfolios for both growth and security.
Democratization of Data: Leveling the Playing Field
Increased availability of historical stock data has leveled the playing field between individual and institutional investors. Previously, this data was mainly accessible only to large financial institutions. Now, with platforms like ChartsWatcher, individual investors can access the same powerful tools and data. This data democratization empowers them to conduct sophisticated analyses and compete more effectively in the market.
Where to Download Historical Stock Data (And What Works Best)
Finding reliable historical stock data is essential for making informed investment decisions. This section explores different platforms, free and paid, to help you find the best one for your needs. We'll look at their strengths and weaknesses so you can make a smart choice.
Free and Premium Data Providers: Finding the Right Balance
There are many ways to access historical stock data, and each has its own pros and cons in terms of coverage, cost, and how the data is formatted. Understanding these differences is key to picking the right source.
-
Yahoo Finance: A popular choice, especially for beginners, Yahoo Finance offers free historical data for many stocks. Keep in mind that the data quality can sometimes be inconsistent, and coverage is mostly limited to US markets.
-
Google Finance: Google Finance is another free option that provides basic historical stock data. Similar to Yahoo Finance, its reliability can vary, and the historical data may not go back very far.
-
Alpha Vantage: This freemium provider offers a good balance. The free version has decent historical data, but you're limited in how often you can request data. The paid plans remove these limits and offer other features. To learn more about improving your investment strategy, check out our guide on what is a stock screener.
-
Quandl: Quandl offers a huge amount of financial and economic data, both free and paid. You can often find unique data here that isn't easily available elsewhere. However, premium data can get quite expensive.
-
Bloomberg Terminal/Refinitiv Eikon: These platforms are the gold standard for professional investors. Bloomberg Terminal and Refinitiv Eikon offer comprehensive global data, sophisticated analysis tools, and real-time updates. The high cost, though, makes them out of reach for most individual investors.
To help you compare these different sources, we've put together a table summarizing their key characteristics:
To help you compare these different sources, we've put together a table summarizing their key characteristics:
Historical Stock Data Sources Comparison
This table compares major platforms for downloading historical stock data, including coverage, pricing, and data formats. It highlights key factors to consider when choosing a data source.
| Data Source | Coverage Period | Cost | Data Format | Best For |
|---|---|---|---|---|
| Yahoo Finance | Varies, primarily US equities | Free | CSV, JSON | Beginners, basic analysis |
| Google Finance | Varies, primarily US equities | Free | CSV, JSON | Beginners, basic analysis |
| Alpha Vantage | Varies, global coverage available | Free/Premium | JSON, CSV | Individuals, various analytical needs |
| Quandl | Extensive, global coverage including niche data | Free/Premium | Varies | Researchers, specific data needs |
| Bloomberg Terminal/Refinitiv Eikon | Comprehensive, global coverage | Premium (high) | Varies | Institutional investors, real-time data |
As this table shows, choosing the right data source depends on your needs and budget. Free resources may be sufficient for basic analysis, but professional platforms are essential for those who require comprehensive data and tools.
Finding the Right Data for Your Strategy
The ideal data source depends heavily on your investing style and what resources you have. For long-term investors focused on fundamental analysis, free resources like Yahoo Finance might be enough. However, high-frequency traders or those using quantitative analysis will likely need the reliability and in-depth data from a premium provider.
Evaluating Data Quality and Reliability
When you’re assessing a historical stock data source, keep these key factors in mind:
-
Data Coverage (Time Period and Geographic Region): Make sure the data covers the specific markets and timeframes you need.
-
Data Frequency (Daily, Intraday, etc.): Choose a frequency that matches your analysis requirements.
-
Data Accuracy and Consistency: Always double-check data integrity by comparing it with other sources and running quality checks.
-
Data Format (CSV, JSON, API): Select a data format that works seamlessly with your analysis tools and process.
The infographic below illustrates key metrics derived from analyzing historical stock data, including average annual return (7%), volatility (15%), and maximum drawdown (-20%).
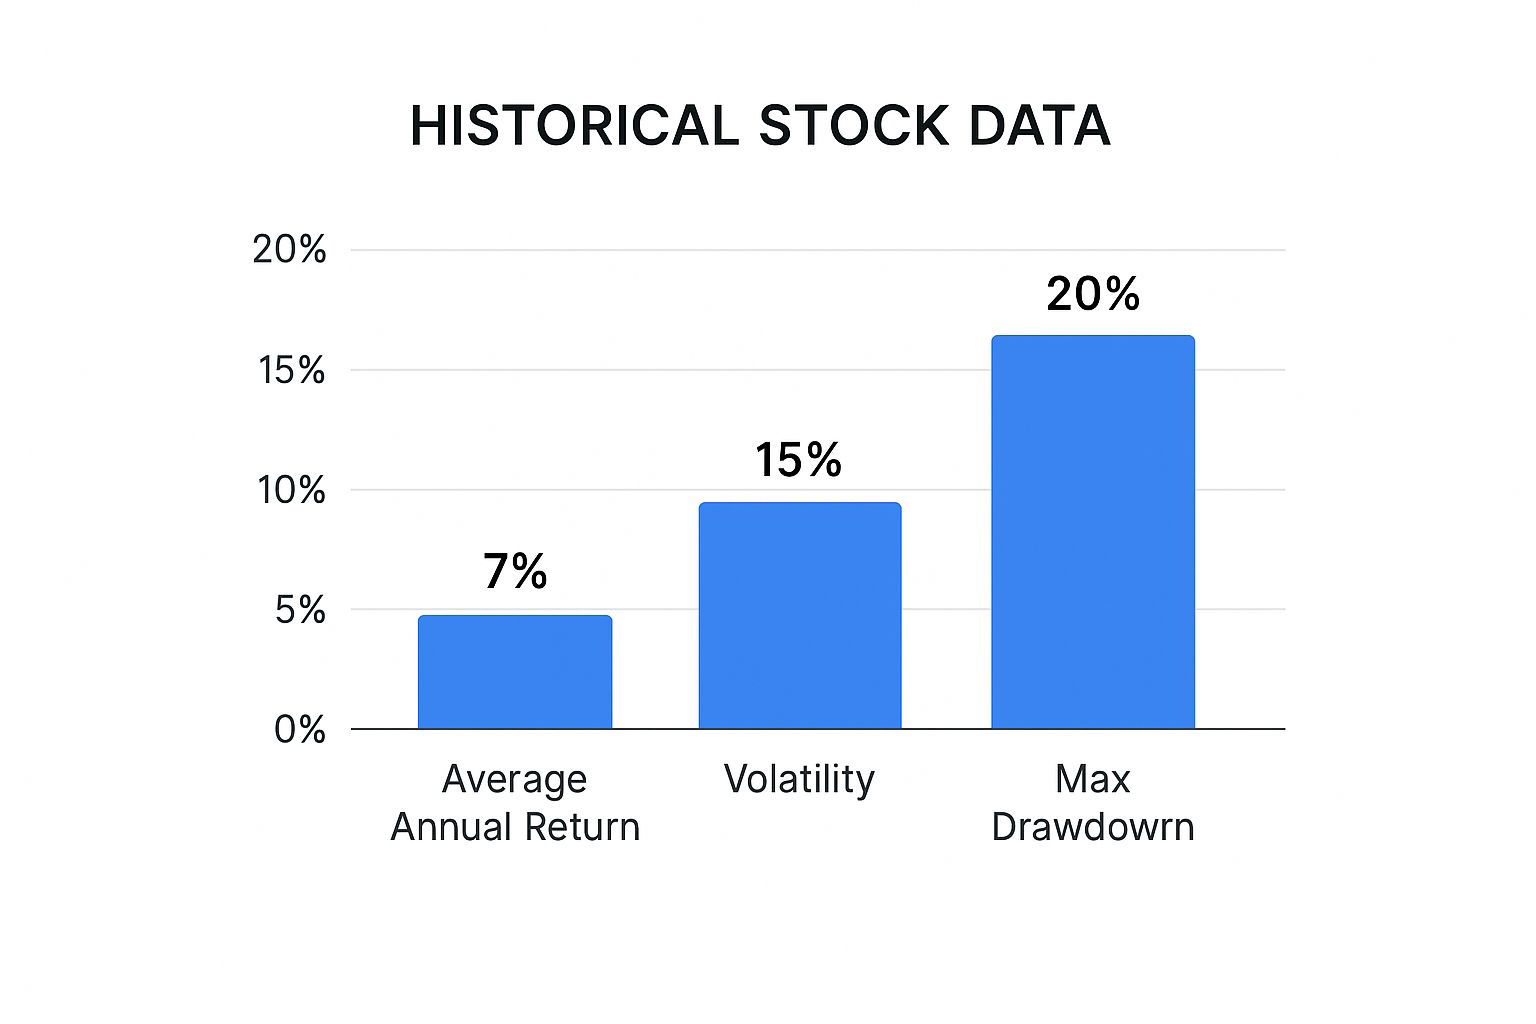
This visualization shows why it's so important to look at both potential returns and risk. While a 7% average annual return looks appealing, the 15% volatility and -20% maximum drawdown suggest there can be big swings in your portfolio's value. This really emphasizes the importance of careful risk assessment using dependable historical data.
Specialized Data Sources for Deeper Insights
There are specialized data sources that go beyond the usual providers. They can offer unique datasets that give you an edge:
-
Government Databases: Sources like the Federal Reserve Economic Data (FRED) provide valuable macroeconomic data that can improve your market analysis.
-
Exchange Data: Direct access to historical trading data is often available from stock exchanges, though usually for a fee.
-
Proprietary Datasets: Some firms create specialized datasets focusing on particular sectors or types of assets.
Exploring these more focused data sources can help you uncover hidden insights and craft more effective investment strategies.
Making Sense of Data Formats and File Types
Downloading historical stock data often involves navigating a variety of file formats and data structures. Understanding these is key for effective analysis. This section clarifies the most common formats and how they can affect your work.
Common Data Formats: CSV, JSON, XML, and APIs
When you're exploring data sources, a direct link to a download page can be a real time-saver. A good example is this Download link. The data you'll download is likely to be in one of these formats:
-
CSV (Comma-Separated Values): This simple, widely compatible format uses commas to separate values within a text file. CSV is great for importing basic data into spreadsheets and many analysis tools like Microsoft Excel or Google Sheets. However, for complex datasets, its simplicity can be limiting.
-
JSON (JavaScript Object Notation): JSON is a human-readable format frequently used for web applications and APIs. It's more structured than CSV, allowing for nested data and better handling of complex relationships. JSON is a solid choice for data exchange and web-based analysis.
-
XML (Extensible Markup Language): XML uses tags to define data elements, offering a lot of flexibility and structure. However, it's more verbose than CSV or JSON and can be less efficient to process. It's best suited for highly structured data with custom definitions.
-
APIs (Application Programming Interfaces): An API lets you request data directly from the source. This provides the most current information and eliminates manual downloads. However, working with APIs might require some programming skills.
Understanding OHLCV and Adjusted vs. Unadjusted Prices
OHLCV (Open, High, Low, Close, Volume) represents the basic structure for most historical stock data. It shows the key price points and trading volume for a specific period (like a day or hour). Understanding this structure is fundamental for any stock market analysis you undertake.
Adjusted closing prices factor in corporate actions such as stock splits and dividends. This gives a more precise view of a stock's value over time, essential for accurate long-term analysis. Unadjusted closing prices, on the other hand, just reflect the raw closing price without those adjustments. Relying solely on unadjusted data, especially over longer periods, can lead to inaccurate conclusions.
Dividend Adjustments: A Key Factor in Accurate Analysis
Dividends significantly impact historical prices. When a company issues a dividend, the stock price typically decreases by a similar amount. Dividend adjustments take this into account, ensuring the historical data reflects the true value of owning the stock. This holds true even if dividends are reinvested, providing a picture of the total return. Ignoring dividend adjustments can lead to large discrepancies in long-term return calculations.
For example, imagine a stock trading at $100 that pays a $5 dividend. The adjusted closing price is $95. If you purchased the stock at $100 and reinvested the $5 dividend into additional shares at the $95 price, your total investment, including the reinvested dividend, remains $100. This accurate reflection of value is particularly relevant for platforms like ChartsWatcher, which emphasize precise tracking and analysis for informed trading.
Why Volume Data Changes Everything in Your Analysis
Price movements in the stock market tell a story, but trading volume adds essential context. It's the driving force behind price action, revealing the conviction of market participants. Understanding volume data transforms basic price charts into powerful tools for market intelligence.
How Professional Traders Use Volume
Professional traders don't simply look at price; they examine volume to confirm price trends and anticipate potential reversals. A price increase with strong volume suggests real buying pressure and increased market participation, pointing to a potentially sustainable upward trend. However, a price increase on low volume could signal a lack of conviction and a possible reversal. You might be interested in: How to profit from unusual volume in stocks.
Interpreting Volume Spikes and Patterns
A sudden volume spike, for instance, can indicate a significant market event or a change in investor sentiment. Learning to interpret these spikes is key to understanding market dynamics. High volume during a price breakout often suggests a strong move. Conversely, low volume during a breakout might be a false signal. Consistently high volume during an uptrend usually validates the move, while declining volume may foreshadow a weakening trend.
Accumulation and Distribution: The Volume Footprint
Accumulation and distribution are two key phases in market cycles revealed by volume analysis. Accumulation happens when informed investors are quietly buying, often at lower prices. This typically shows up as increased volume during price dips and decreased volume during rallies. Distribution occurs when these investors start selling, often at higher prices. This is marked by high volume during price rallies and decreased volume during dips. Identifying these phases is crucial for anticipating significant market turns.

The Crucial Link Between Volume and Volatility
Volume and market volatility are closely connected. High volume frequently accompanies periods of increased volatility, while low volume usually correlates with quieter markets. This means volume can act as an early warning sign for potential market turbulence. You'll often need to process data from various file types; learn about How To Parse Pdf Files. Market volume data is critical for downloading historical stock data, offering key insights into trading liquidity and overall market activity. The Chicago Board Options Exchange (Cboe) offers valuable historical market volume data for US equity markets dating back to January 2009. These datasets include daily traded shares, total notional value, and trade counts across different market centers.
Combining Volume and Price for Confident Decisions
Combining volume data with price action empowers investors to make better trading decisions. A platform like ChartsWatcher with its customizable dashboards, allows traders to effectively visualize this crucial relationship. This integration provides a more nuanced understanding of market dynamics, helping investors refine their strategies.
Frameworks for Incorporating Volume Analysis
Here are several frameworks to incorporate volume analysis into your investment approach:
-
Volume Spread Analysis (VSA): This focuses on the relationship between price spread (the difference between high and low prices) and volume.
-
Volume Price Analysis (VPA): VPA emphasizes the combined interpretation of price and volume movements.
-
On-Balance Volume (OBV): This is a cumulative indicator that tracks buying and selling pressure.
These frameworks offer structured methods for using volume to identify trends, confirm price movements, and find potential reversal signals, ultimately improving your ability to analyze historical stock data effectively.
Building a Complete Picture With Global Market Data
Your investment portfolio isn't isolated, so your analysis shouldn't be either. This means looking beyond individual stocks to understand the global forces at play. Downloading historical stock data is just the beginning. This section explores the interconnectedness of international markets and the importance of analyzing multiple markets for effective diversification and risk management.
The Interplay of Global Markets
Understanding the influence different economies and markets have on each other is critical for investment success. A major economic downturn in one country, for instance, can trigger a chain reaction across global markets, impacting stock prices worldwide. Policy changes, such as interest rate adjustments by a major central bank like the Federal Reserve, can also shift global capital flows, affecting currency exchange rates and stock valuations in other countries. This interconnectedness highlights the need to broaden your perspective when analyzing historical stock data.
Multi-Market Analysis for Diversification
Diversification is a fundamental principle of sound investing. By allocating investments across various markets and asset classes, you reduce risk and potentially improve returns. Multi-market analysis using historical stock data allows investors to spot opportunities in markets that don't move in lockstep with their domestic market. This helps build a more resilient portfolio, less vulnerable to swings in any single market.
Integrating Economic Indicators
Savvy investors look beyond stock prices. They also consider key economic indicators, which offer valuable context for stock market movements. These indicators can include:
- GDP Growth: A country's GDP growth rate provides a fundamental measure of economic health.
- Currency Fluctuations: Shifts in exchange rates can have a substantial impact on the value of international investments.
- Sector Rotation: Recognizing trends in sector performance can guide investors toward effective capital allocation.
By integrating these indicators into their analysis of historical stock data, investors gain a more nuanced understanding of market dynamics. For instance, grasping GDP relationships between countries can explain why certain markets move together. The sheer volume of stock trading compared to a nation's economic output underscores the importance of historical stock data in global markets. As a percentage of GDP, the total value of stocks traded reveals market depth and financial development. In major economies like the United States, stock trading turnover regularly surpasses 100% of GDP, demonstrating highly active and liquid stock markets. Learn more about this at the World Bank.
Identifying Global Trends
Analyzing historical data across multiple markets allows investors to identify global trends before they reach their local markets. Tracking sector rotation patterns in emerging markets, for example, might uncover opportunities or risks that could eventually spread to developed markets. This gives investors a chance to anticipate market shifts and adjust their portfolios proactively. This forward-thinking approach is essential for staying ahead.
Building Comprehensive Datasets
Constructing datasets that combine both micro (individual stock) and macro (economic indicators) data is key for thorough market analysis. Platforms like ChartsWatcher let you build custom dashboards that integrate diverse data sources. This integrated approach provides a complete view of market dynamics, leading to more informed investment decisions. Such a platform is especially helpful for professional traders who require a complete picture and the ability to act swiftly.
Tools That Turn Raw Data Into Investment Insights
Having access to historical stock data is just the first step. The real power lies in transforming that raw data into actionable investment insights. This involves selecting the right tools and software to process, analyze, and visualize the data. This section explores various options for all skill levels, from simple spreadsheets to sophisticated programming languages and specialized trading platforms.
From Spreadsheets to Specialized Platforms: Choosing the Right Tool
The ideal tool for analyzing downloaded historical stock data depends on your technical skills and the complexity of your analysis. For beginners, spreadsheets like Microsoft Excel and Google Sheets offer a user-friendly starting point. They are great for basic calculations, charting, and simple data manipulation. However, for more in-depth analysis, dedicated software becomes essential.
-
Excel/Google Sheets: Perfect for basic charting and simple calculations, but limited in handling large datasets and advanced statistical methods.
-
Python/R: These programming languages provide flexibility and power for statistical modeling, data visualization, and even algorithmic trading. Python libraries like
pandasmake data manipulation and analysis extremely efficient. R is similarly powerful for statistical computing and graphics. However, both require coding skills and a steeper learning curve. -
Specialized Trading Platforms: Platforms like ChartsWatcher offer integrated charting tools, technical indicators, and backtesting capabilities specifically designed for traders. These platforms often streamline the entire workflow, from data import to strategy implementation, proving invaluable for serious traders.
To help you choose the right tool, we've compiled a comparison table highlighting the key features, skill levels required, and associated costs of various data analysis tools.
To help you choose the right tool, we've compiled a comparison of various software options for analyzing historical stock data. This table focuses on key features, required skill levels, and pricing to help you find the perfect fit.
Data Analysis Tools Comparison
| Tool/Software | Skill Level | Key Features | Cost | Best Use Case |
|---|---|---|---|---|
| Excel/Google Sheets | Beginner | Basic calculations, charting, data manipulation | Free/Low | Simple analysis, small datasets |
| Python/R | Intermediate/Advanced | Statistical modeling, data visualization, algorithms | Free | Complex analysis, algorithmic trading |
| ChartsWatcher | Intermediate/Advanced | Integrated charting, indicators, backtesting | Freemium | Active trading, technical analysis |
This table clearly shows that while spreadsheets are great for beginners, more advanced tools like Python/R and ChartsWatcher are necessary for complex analysis and algorithmic trading strategies.
Building Efficient Workflows for Data Updates
Efficient workflows are essential for maintaining current data and relevant analysis. Manually updating data is time-consuming and prone to errors. Automating this process saves you time and ensures accuracy. Python scripts can automate downloading and updating historical data from sources like Yahoo Finance or Alpha Vantage APIs. Platforms like ChartsWatcher often feature seamless data integration, automatically updating data feeds for real-time insights. This eliminates manual downloads and synchronizes your analysis with the latest market activity.
Automating Repetitive Tasks and Creating Professional Charts
Many analytical tasks, such as calculating moving averages or identifying trends, can be repetitive. Automating these with Python or R scripts significantly improves efficiency and minimizes human error. Furthermore, clear and insightful charts are essential for communicating findings. While spreadsheets offer basic charting, Python libraries like matplotlib and seaborn, along with R's ggplot2, provide highly customizable, professional-grade visualizations. ChartsWatcher enhances this by providing built-in charting tools tailored for traders, enabling rapid visualization of technical indicators and trading signals derived from the historical stock data. Building these reproducible processes saves time and increases accuracy across your investment research, ultimately contributing to stronger, data-driven decisions.
Avoiding the Mistakes That Kill Your Analysis

Accurate historical stock data analysis is essential for making informed investment choices. Even with reliable data sources like ChartsWatcher, using the wrong methods can lead to inaccurate conclusions. This section explores some common pitfalls that can undermine your analysis and offers strategies to avoid them.
Beware of Biases: Survivorship and Look-Ahead
Two significant biases can skew your historical stock analysis: survivorship bias and look-ahead bias. Survivorship bias arises when your analysis only includes currently successful companies, ignoring those that have failed. Imagine researching the top-performing stocks of the last 50 years. If you exclude companies that went bankrupt, your view of market returns could be overly optimistic.
Look-ahead bias occurs when you incorporate information that wasn't available at the time of your historical analysis. Using today's financial data to analyze past decisions gives you an unfair advantage, distorting the results.
Data Snooping: The Trap of False Confidence
Data snooping, also known as overfitting, is another potential trap. This happens when you manipulate your analysis to perfectly match past data, often by repeatedly testing variables until you find a pattern. While this might feel like a breakthrough, it creates a false sense of confidence. Your model, perfectly tuned to historical data, might not perform well with future data.
One solution is to use separate datasets. Build your strategy with one dataset and test its performance with a completely separate, unseen dataset. This provides a more realistic picture of how your model will perform in real-world situations.
Handling Corporate Actions: Splits and Dividends
Corporate actions like stock splits and dividend payments can also distort historical data. A 2-for-1 stock split halves a stock's price. Without adjusting for this split, your data will show a misleading price drop. Dividend payments similarly reduce a stock's price, but the investor receives an equivalent payment.
Using adjusted closing prices, which account for these corporate actions, gives you a more accurate picture of a stock's value over time. This is especially crucial when analyzing historical data over long periods.
Data Validation and Quality Control: Your Safety Net
Building robust data validation and quality control processes is crucial. Comparing your downloaded data with a second reliable source helps identify discrepancies. Regularly checking for missing or inaccurate data is also essential.
Tools like ChartsWatcher offer automated alerts and data validation, helping you avoid costly errors. These checks ensure your analysis rests on a solid foundation of accurate data, leading to reliable, actionable insights.
Ready to improve your trading with solid, reliable data analysis? Explore the powerful features of ChartsWatcher today! Discover how ChartsWatcher empowers your trading.
