What Is Average True Range Explained Simply
If you've ever tried to navigate a ship just by looking at a compass, you know it only tells you half the story.You’d know your direction, sure, but what about the waves? Are they gentle swells or massive, dangerous breakers threatening to capsize you? That’s where the Average True Range (ATR) comes in for traders. It's the market's wave-height gauge.
Understanding Volatility with Average True Range
The ATR doesn't care if the market is bullish or bearish—that's a job for other indicators. Instead, its sole purpose is to measure the degree of price movement over a set period. Think of it as the market’s speedometer; a high ATR means prices are swinging wildly, while a low ATR signals a quiet, consolidating market. It gives you a clear picture of volatility.
The Origin of ATR
The ATR isn't some new-fangled indicator. It was developed way back in 1978 by the legendary technical analyst J. Welles Wilder Jr. and introduced in his classic book, 'New Concepts in Technical Trading Systems.'
Unlike indicators that try to predict trend direction, the ATR was built purely to measure the raw energy of the market. This focus on volatility makes it incredibly versatile and valuable across all asset classes, whether you're trading equities, commodities, or forex. For a deeper dive into its history, Macroption offers a detailed ATR explanation.
Interpreting ATR A Quick Guide to Market Conditions
Making sense of the ATR is actually pretty straightforward. A high reading tells you there’s a ton of energy and activity in the market. A low reading suggests things have quieted down.
This simple table breaks down how you can use ATR readings to get a feel for the market's mood and what actions you might consider.
| ATR Value | Market Condition | Potential Trader Action |
|---|---|---|
| Low ATR | Low volatility, quiet market, or consolidation phase. Price movements are small and contained. | Look for potential breakouts, but be cautious of false signals. Position sizes can be larger due to lower risk per trade. |
| High ATR | High volatility, active market, or potential trend start/end. Price swings are large and rapid. | Confirm breakouts, adjust stop-losses to be wider to avoid being stopped out by noise, and consider smaller position sizes to manage risk. |
Ultimately, what you're looking for are changes in the ATR's momentum. A rising ATR signals that market energy is building, which could happen during a powerful uptrend, a sharp downtrend, or even a major reversal. Conversely, a falling ATR suggests the market is losing steam and might be entering a period of rest.
This insight is absolutely foundational for building robust risk management strategies. It helps you decide how wide to set your stop-loss orders and how to size your positions based on the current market "weather."
How The ATR Calculation Works
To really get what the ATR is showing you, it helps to pop the hood and see how it’s built. Don't worry, this isn't about getting lost in complex formulas. It’s about understanding the simple, yet brilliant, logic behind the indicator. It all starts with one core building block: the True Range (TR).
Think of the True Range as the engine that powers the whole indicator. A simple high-minus-low calculation for a single day can be misleading; it completely ignores price gaps that happen between trading sessions, like overnight or over a weekend. These gaps are huge clues about market volatility, and a basic daily range misses them entirely. The TR is designed specifically to capture them.
The Three Components of True Range
To make sure no volatility slips through the cracks, the TR for any given period is found by calculating three different values and simply picking the biggest one. This clever trick covers every possible scenario.
- The Current Period's High minus the Current Period's Low: This is your classic, standard intraday range.
- The Absolute Value of the Current High minus the Previous Close: This is how you catch any gaps to the upside.
- The Absolute Value of the Current Low minus the Previous Close: And this one accounts for gaps to the downside.
By taking the largest of these three, you get one single number that gives you an honest picture of the maximum price movement for that period. It’s a crucial step because it bakes in the impact of sudden market shocks or overnight news.
Key Takeaway: The True Range calculation is purpose-built to include price gaps. This gives you a much more accurate measure of volatility than just looking at the daily high and low, making it far more robust.
This infographic breaks down the simple flow, from finding these components to getting the final ATR value.
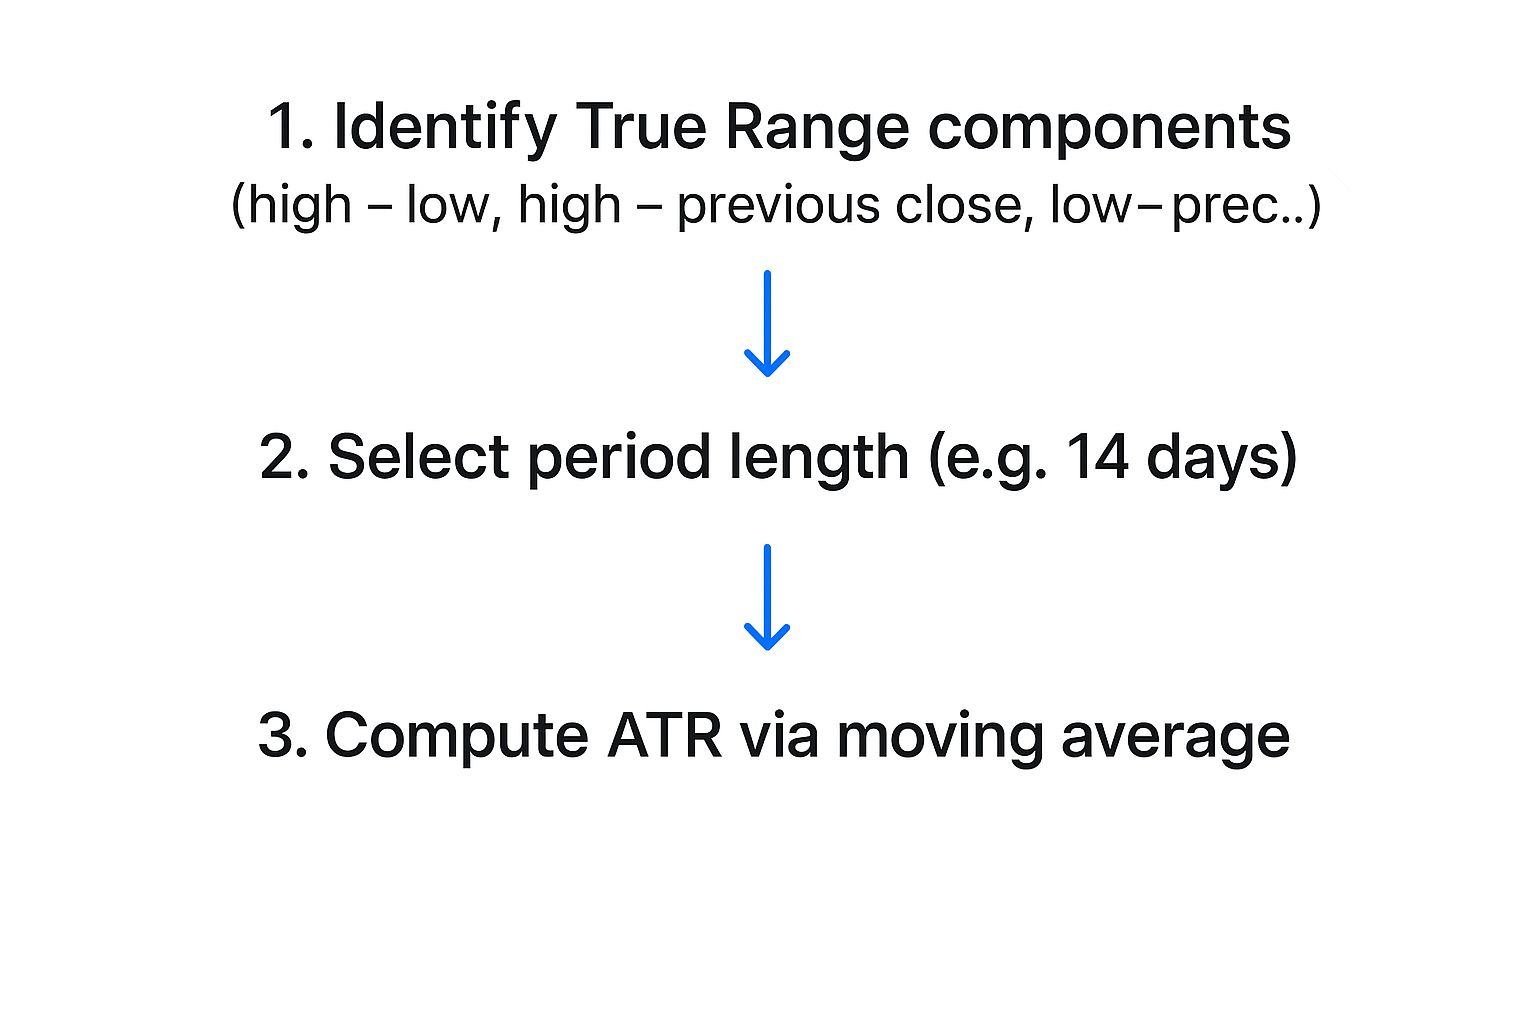
As the visual shows, each True Range value is calculated first, before being smoothed out into the single ATR line you see on your chart.
From True Range to Average True Range
Once you have the True Range for each period, the final step is straightforward. The Average True Range is simply a smoothed moving average of all those TR values. The standard setting, as designed by its creator, is 14 periods.
This just means the indicator takes the True Range values from the last 14 days (or 14 candles, if you're on an intraday chart) and averages them together. This averaging process smooths out the random noise from any single day's volatility, giving you a much more reliable gauge of the market's true energy level.
If you want to dive even deeper into the mechanics, check out our guide on how to calculate volatility for a more comprehensive look.
Reading the Story of Volatility on Your Charts
Now that we’ve broken down the calculation, let’s get practical. How does this actually look on a chart?
When you add the Average True Range indicator, it doesn't clutter up your price action. Instead, it appears as a single, clean line in its own window, usually right below your main price chart. Think of this line as a continuous readout of the market's energy level.
A rising ATR line is a clear signal that volatility is picking up. I like to think of the market as a resting lion; a climbing ATR is that lion starting to stir, stretch, and get active. This often happens right before big price moves—think breakouts from a tight range, sharp reversals, or explosive reactions to economic news.
On the flip side, a falling ATR line tells you that volatility is drying up. The market is getting quiet, with price ranges shrinking day by day. This is the lion settling down for a nap.
This screenshot shows the ATR doing its thing below the price chart, giving us a visual map of those volatility shifts.

It’s easy to see how the peaks in the ATR line up with those huge, decisive candles, while the valleys match periods of quiet, sideways chop.
Context Is Everything with ATR
Here's one of the most important things to get right: ATR is always relative. There's no magic number that universally means "high" or "low" volatility. A "high" ATR for a stable utility stock would be laughably low for a wild cryptocurrency like Bitcoin.
The real power of ATR isn't in its absolute number, but in how that number changes over time for one specific asset. You have to compare the indicator to its own history to pull out any meaningful insight.
Doing this is simple. Just look at the ATR's current level compared to where it’s been recently on the same chart.
- Is the ATR near a multi-month high? That's a red flag. Volatility is unusually stretched for this asset, and it’s probably a good time to tighten your risk management.
- Is the ATR at a multi-month low? This suggests the market is unusually quiet. It could be the calm before the storm—a major breakout might be just around the corner.
Understanding ATR in Different Market Conditions
To give you a real-world example, the S&P 500 index (SPX) typically has an ATR that hangs out between 10 to 50 points. But during the extreme stress of the 2008 financial crisis, its ATR shot past 60 points on several occasions. It more than doubled its average from the previous decade, perfectly reflecting the historic levels of fear and uncertainty. You can explore more historical volatility data to get a better feel for these patterns.
By learning to read these nuances, you go beyond just knowing what is average true range. You start using it to actually interpret the market's underlying energy. That's a skill that helps you make smarter, more context-aware trading decisions.
Putting ATR to Work in Your Trading Strategy
Alright, let's move from theory to action. Knowing what the Average True Range is is one thing, but making it work for you is where the real value lies. This is the point where ATR stops being just a squiggly line on your chart and becomes a practical tool for making smarter, data-backed trading decisions.
We're going to walk through three powerful, real-world ways traders use ATR every single day. Each one taps into ATR’s volatility readings to sharpen risk management and boost trade conviction.
Set Smarter Stop-Loss Orders
This is probably the most common—and effective—use for the ATR. Instead of guessing with arbitrary percentages or fixed dollar amounts, an ATR-based stop loss adapts to the market's current mood.
Think of it as giving your trade the right amount of "breathing room."
During quiet, low-volatility periods (low ATR), a tighter stop makes sense. But when the market is whipping around (high ATR), a tight stop is a recipe for getting knocked out of a perfectly good trade by meaningless noise.
The process is refreshingly simple:
- Check the Current ATR Value: As you enter a trade, take note of the ATR reading.
- Apply a Multiplier: Most traders use a multiple between 1.5x and 2.5x the ATR.
- Calculate Your Stop: For a long position, subtract the multiplied ATR value from your entry price. For a short position, you'd add it.
For example: Let's say you buy a stock at $100, and the current ATR is $2. Using a 2x multiplier, you’d place your stop-loss at $96 ($100 - (2 * $2)). This dynamic method helps you stay in the game and avoid getting shaken out by random price swings.
To illustrate how this approach stacks up against more traditional methods, let's compare them side-by-side.
Comparing ATR-Based Stops vs Fixed-Price Stops
| Feature | ATR-Based Stop-Loss | Fixed-Price Stop-Loss |
|---|---|---|
| Adaptability | Dynamic; adjusts automatically to market volatility. | Static; remains the same regardless of conditions. |
| Objectivity | Based on recent, quantifiable price movement. | Often based on arbitrary percentages or gut feeling. |
| Market Context | Gives trades more room in volatile markets, tightens up in quiet ones. | Can be too tight in volatile markets and too loose in quiet ones. |
| Risk of Premature Exit | Lower, as it accounts for normal market "noise." | Higher, especially during sudden volatility spikes. |
| Application | Universal across different assets (stocks, forex, crypto). | Less effective when comparing assets with different volatilities. |
As you can see, using the ATR gives you a significant edge by grounding your risk management in the market's actual behavior, not just a predetermined number.
Confirm High-Quality Breakouts
A price smashing through a key support or resistance level is exciting, but we've all been burned by failed breakouts. The price pokes through, runs out of gas, and then reverses—trapping hopeful traders. The ATR can be your conviction filter here, helping you tell a genuine breakout from a fake-out.
A real breakout should be driven by a surge of energy and participation. This burst of activity will show up as a clear spike in the ATR.
- Strong Breakout Signal: The price breaks a key level, and the ATR line simultaneously shoots higher. This suggests real momentum is fueling the move.
- Weak Breakout Signal: The price just barely creeps past a level, but the ATR stays flat or even drops. This is a major red flag that there’s little conviction, raising the odds of a quick reversal.
Use ATR for Better Position Sizing
Consistent risk management is the bedrock of any successful trading career. The ATR is fantastic for this because it helps you standardize your risk on every single trade, no matter how volatile an asset is. The core idea is simple: you take smaller positions in choppy, high-volatility markets and larger positions in quieter, more stable ones.
This approach ensures that a 2x ATR stop-loss on a wild tech stock represents the same dollar risk as a 2x ATR stop on a sleepy utility stock. It levels the playing field. Many professional traders rely on a 14-period ATR to set stop-loss levels that truly reflect the market's current temperament. For example, a forex trader might set stops at 1.5 to 2 times the ATR to protect their capital without getting stopped out prematurely. You can see more examples of this in action over at the thinkorswim Learning Center.
By weaving these three techniques into your routine, you'll start to unlock the full potential of the ATR indicator. To explore more advanced applications, check out our complete guide on how to use the ATR indicator.
Common ATR Mistakes and How to Avoid Them
The Average True Range is a fantastic tool for getting a read on market energy, but like any indicator, it’s not foolproof. A lot of traders, especially when they're just starting out, stumble into a few common traps that can lead to some painful mistakes. Getting a handle on these pitfalls is the first step to using ATR with more confidence and precision.

The absolute biggest and most frequent mistake is thinking ATR tells you which way the price is going. It doesn't. It’s critical to burn this into your brain: a rising ATR just means volatility is picking up. It tells you nothing about whether the price is headed for the moon or the floor. That surge in energy can happen just as easily in a market that's crashing as it can in one that's ripping higher.
A high ATR signals high energy, not a specific direction. Always pair it with trend-following or momentum indicators to get the full story on the price’s trajectory.
Mistaking Volatility for Momentum
It's so easy to see a sharp spike in the ATR line and immediately think a powerful trend is kicking off. But hold on. That spike could just as easily be signaling wild, choppy price action that's going nowhere fast.
- Momentum is about price movement with conviction in one direction.
- Volatility is just the size of the price swings, direction aside.
Confusing these two is a classic way to jump into trades based on market noise instead of a genuine trend. A rising ATR needs to be backed up by other evidence before you can assume a strong move is actually happening.
Applying One-Size-Fits-All Settings
Another common pitfall is just slapping the default 14-period setting on every chart and calling it a day. While the 14-period ATR is a great starting point, different markets have their own unique personalities. A notoriously volatile crypto isn't going to behave like a stable, blue-chip stock.
Using the same setting for everything is like trying to use the same wrench for every single bolt—it’s just not going to work. For example, a short-term day trader might find a shorter setting, like a 7-period ATR, is much more responsive to the quick shifts they're trying to catch. On the flip side, a long-term investor might prefer a 20-period ATR to smooth out the daily noise and focus on the bigger picture. You have to test and tweak the ATR period to fit the specific character and timeframe of whatever you're trading.
Ignoring Broader Market Context
Finally, a really dangerous mistake is looking at historical ATR values in a vacuum, completely ignoring what’s happening in the real world. An upcoming economic announcement, like a Fed interest rate decision or a major company’s earnings report, can make past volatility readings almost useless.
The historical ATR might be suggesting a calm, quiet market, but if a major news event is just hours away, a massive volatility spike could be lurking right around the corner. Smart trading is about blending your technical data with an awareness of what’s driving the market. Always have an eye on the economic calendar and be aware of events that could throw a wrench in the works. It’ll help you sidestep some very predictable—and costly—blunders.
Common Questions About the Average True Range
Even after you get the basics down, a few questions always seem to pop up when traders start putting the ATR to work. Let's tackle some of the most common ones to clear up any confusion and get you using the indicator with confidence.
What’s a Good ATR Setting to Use?
The classic 14-period setting is the industry standard, and it's the one J. Welles Wilder himself recommended. But honestly, the "best" setting really boils down to your personal trading style and what market you're looking at.
- A short-term trader might crank it down to a 5 or 7-period setting. This makes the ATR react much faster to sudden volatility spikes.
- A long-term investor, on the other hand, might set it to 20 or even 50. This smooths out the daily noise, giving a clearer picture of the bigger volatility trend.
The real key is to test what feels right for your strategy. A one-size-fits-all approach is rarely the path to success in trading.
Key Takeaway: While 14 is a great starting point, don't just set it and forget it. Your ideal ATR setting should match your trading timeframe and the unique personality of the asset you're watching.
Can ATR Predict Price Direction?
Absolutely not, and this is probably the most important thing to remember about the ATR. It is a non-directional indicator. It only measures the magnitude of volatility—think of it as the market's "energy level."
A rising ATR just means the price swings are getting wider. That could be happening in a monster uptrend just as easily as it could in a brutal freefall. You always need to pair ATR with a trend-following tool, like a moving average or a momentum oscillator, to get a sense of which way the market is actually heading.
How Is ATR Different from Standard Deviation?
Both indicators measure volatility, but they go about it in completely different ways. Standard deviation looks at how far the price has strayed from an average price (like a simple moving average). It’s all about price dispersion around a central point.
ATR, in contrast, measures the size of the price range itself, and its secret weapon is that it includes price gaps between trading sessions. This is why so many traders swear by ATR for setting stop-losses; its value is in dollars or pips, making it instantly usable for risk management without any extra math.
Ready to see what ATR can really do? Integrate it into your workflow with ChartsWatcher. Our platform lets you scan the market for specific volatility conditions, set up custom alerts, and backtest your strategies with ease. Start your free trial today at chartswatcher.com and get a much clearer view of market volatility.
