How to Use ATR Indicator: A Trader's Essential Guide
If you’ve ever felt like the market’s price swings are just chaotic noise, the Average True Range (ATR) indicator is about to become your new best friend. It’s designed to do one job and do it well: measure volatility. Think of it as a tool that cuts through the chaos to give you a single, clean number representing how much an asset has been moving.
A high ATR reading tells you the market is whipping around—lots of action. A low ATR suggests things are quiet and sleepy. Simple as that.
Decoding Volatility with the Average True Range Indicator
Before you can really put the ATR to work, you have to get what it's not. It won't tell you if a trend is bullish or bearish. It won’t signal that a stock is overbought or oversold. Its only mission is to quantify how much the price is moving.
I like to think of it as a speedometer for the market. Your car’s speedometer tells you how fast you’re going, but it doesn’t care about the direction. In the same way, the ATR shows you how volatile a stock is, giving you a concrete value for what might otherwise feel like random price action. This is exactly why it's a non-negotiable tool for managing risk.
The Core Concept of True Range
The real magic of the ATR comes from how it calculates "true range." J. Welles Wilder Jr. developed it back in 1978, specifically for commodity markets where price gaps between sessions were common. Stocks do this all the time, too—gapping up or down overnight. A simple high-low calculation would completely miss that volatility. For a deep dive into its origins, Investopedia.com offers a great overview.
To get the "true range," the indicator looks at three different measurements and picks the biggest one:
- The distance between the current bar's high and low.
- The distance from the current bar's high to the previous bar's close.
- The distance from the current bar's low to the previous bar's close.
It does this for a set number of periods—14 is the standard—and then smooths the results into a moving average. That’s the single line you see on your chart.
Key Takeaway: The ATR's superpower is its ability to capture volatility from overnight or weekend price gaps. That's a huge blind spot for many other volatility metrics.
Before we go further, here's a quick cheat sheet to keep the main ideas straight.
ATR at a Glance Key Concepts
This table breaks down the essential components of the ATR, what they mean in a practical trading context, and the most common setting you'll encounter.
| Component | What It Means for a Trader | Common Setting |
|---|---|---|
| True Range | The actual, gap-inclusive price movement for a single period. It’s the raw data behind the indicator. | Calculated per period (e.g., daily) |
| Average | The smoothing of the True Range over a set number of periods. This creates the single line on the chart. | 14 periods (e.g., 14 days) |
| ATR Value | A direct measure of volatility. A higher value means more price chop; a lower value means a quieter market. | Interpreted relative to the asset's price |
This table is your quick reference for understanding what drives the ATR and how to interpret it at a high level.
Why Volatility Matters in Trading
This isn't just theory; understanding volatility has a direct impact on your P&L. A market with a high ATR is like a boat in choppy seas—it creates bigger waves, which means more opportunity but also way more risk. If you set a tight stop-loss in that kind of environment, you’re practically guaranteed to get knocked out by normal market noise before your trade has a chance to work.
On the flip side, a low ATR market is calm, maybe too calm. It can signal a boring consolidation phase where nothing is happening, which is death for a trend-following strategy. By giving you an objective number for this "choppiness," the ATR helps you tailor your strategy—especially your stop-loss and position size—to fit the market's current personality.
Getting the ATR on Your Charts
Pulling up the Average True Range indicator on a platform like ChartsWatcher is the easy part—it's usually just a couple of clicks in your indicator library. But that's just step one. The real art is dialing in the settings so the indicator actually speaks to your trading style and the specific asset you're watching.
Right away, you'll see the most critical setting: the "period" or "length." This number tells the ATR how many recent candles (days, hours, minutes—whatever your timeframe is) to include in its calculation. The default is almost always 14 periods, a standard set by its creator, J. Welles Wilder Jr. For most traders, this is a fantastic, well-balanced place to start.
Dialing in the ATR Period for Your Strategy
A 14-period ATR gives you a solid, middle-of-the-road view of volatility. But you can—and should—tweak this number to get a sharper picture. Think of it like a camera lens: a shorter period zooms in for a sensitive, up-close look, while a longer period zooms out for a smoother, wider perspective.
-
Shorter Periods (like 5 to 7): This makes the ATR hyper-responsive to the latest price action. It’s perfect for day traders who need to spot immediate shifts in volatility. If you're hunting for quick breakout confirmations, a shorter period is your best friend.
-
Longer Periods (like 20 to 25): This setting will smooth out the ATR line, filtering out a lot of the short-term market "chatter." It's a much better fit for swing traders or long-term investors who care more about the broader volatility trend over several weeks or months.
If you're new to this, our guide on day trading strategies for beginners can help you understand how these timeframes shape your entire approach. The period you choose here will directly change how you read the signals.
Trader's Tip: Don't just pick one setting and forget it. I always recommend backtesting a shorter period (say, 7) against a longer one (like 21) on an asset you trade often. You'll be surprised how it changes your view of what's just noise versus a real shift in market energy.
What the ATR Line Is Actually Telling You
Once it's on your chart, the ATR appears as a single line in its own window below the main price action. The value of this line is your objective measure of volatility. Simple as that.
When the ATR line is climbing, it means volatility is picking up. The price ranges from one candle to the next are getting wider. This can signal the beginning of a powerful new trend, but it can also show up during a panic-driven market top or bottom. A rising ATR is confirmation that a move has real energy behind it.
On the flip side, when the ATR line is falling, volatility is drying up. The price ranges are tightening, and the market is getting quiet. This often happens right before a period of consolidation or sideways chop.
Here’s a critical mistake I see traders make: they assume a low ATR value means a reversal is about to happen. It doesn't. A flat, low ATR just tells you the market is calm. This "calm sea" could last for a long, long time, or it could be the quiet before an explosive breakout. The ATR measures what is, not what will be.
Using ATR for Dynamic Stop-Loss Placement
This is, without a doubt, one of the most powerful ways to use the Average True Range indicator. Seriously, forget about those arbitrary, fixed-percentage stop-losses that completely ignore the market's current mood. Using the ATR for your stop-loss is all about giving your trades an intelligent, dynamic cushion based on real-time volatility.
The goal is simple: place your stop far enough away to avoid getting shaken out by random market "noise," but close enough to protect your capital if the trade genuinely goes south. It's the difference between a frustrating, premature exit and actually staying in a winning trade long enough for it to play out.
This simple infographic breaks down how the ATR value is derived, which is the foundation for using it in your trading.
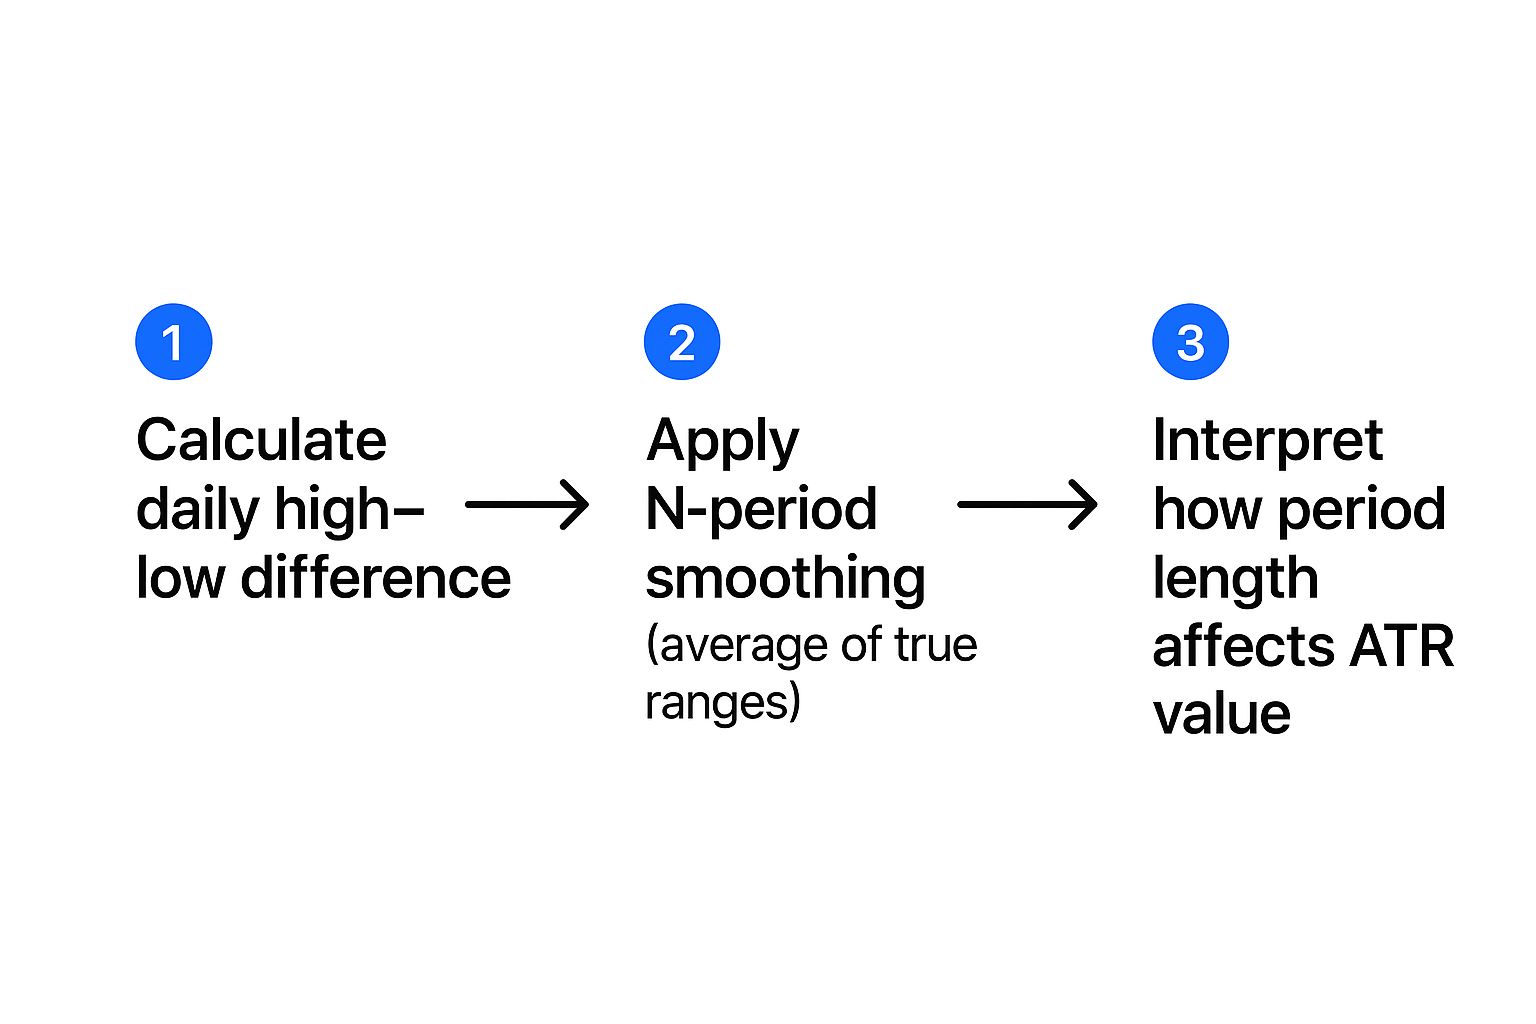
As the visual shows, the final ATR value is just a smoothed average of recent price ranges. The period length you choose directly influences how sensitive this value is.
The Basic Stop-Loss Formula
The core method involves taking the current ATR value and multiplying it by a factor, usually somewhere between 1.5 and 3. You then subtract this result from your entry price for a long position or add it for a short position.
A very common starting point is a 2x ATR multiplier. Many traders find this to be the sweet spot—it gives a trade enough room to breathe without taking on excessive risk.
The Formula in Action:
- For a Long Trade: Stop-Loss = Entry Price - (2 * ATR)
- For a Short Trade: Stop-Loss = Entry Price + (2 * ATR)
This approach automatically adjusts your risk to what the market is actually doing. In a quiet, low-volatility market (low ATR), your stop will be naturally tighter. In a wild, choppy market (high ATR), your stop will be wider, which helps protect you from getting stopped out by erratic price swings.
Real-World Stop-Loss Examples
Let's walk through how this works in a couple of different markets. Theory is one thing, but seeing it in practice is what matters.
Example 1: A Stock Trade Imagine you buy shares of a tech stock at $150. You glance at your ChartsWatcher chart and see the 14-day ATR is currently sitting at $3.50.
- Using a 2x multiplier, your volatility-adjusted stop distance is $7.00 (2 * $3.50).
- Your stop-loss order would be placed at $143.00 ($150 - $7.00).
This stop isn't based on a random guess; it's based on the stock's recent, actual movement.
Example 2: A Forex Trade Now, let's say you decide to go short on the EUR/USD pair at 1.0750. The 14-period ATR on your hourly chart reads 0.0025, which is 25 pips.
- With the same 2x multiplier, your stop distance is 50 pips (2 * 25 pips).
- You'd set your stop-loss order at 1.0800 (1.0750 + 0.0050).
In both cases, the ATR provides a logical, data-driven foundation for your risk management. You're adapting to the market instead of trying to force the market to adapt to your fixed rules.
Traders have been using the ATR to set stop-loss orders dynamically for years. In the S&P 500 index, for example, a trader might use the 14-day ATR multiplied by a factor of 1.5 to 3 to decide where to place their stop. Research actually shows that volatility-based stop methods can improve trade survival rates by up to 25% compared to fixed stops, especially in trending markets. This technique has gained serious traction since the early 2000s because it's proven its value in managing drawdowns. You can discover more about these volatility findings on Schwab.com.
Advanced ATR Strategies for Trade Entry and Position Sizing
While using the ATR for stop-losses is a defensive game-changer, its true power comes alive when you use it on offense. This is where we move the ATR from just a risk management tool to a core part of your trading plan, helping you decide not just where to get out, but when to get in and, critically, how much to risk.
One of the most reliable and powerful patterns in trading is the shift from low to high volatility. The ATR is your best tool for spotting this change before it happens.
Spotting Breakouts with Low ATR
Think of a low ATR reading as the market coiling up like a spring. When you see that ATR line on your chart compress and go flat for a while, it’s a huge clue that a big price move might be brewing under the surface. It's the classic "calm before the storm."
Personally, I make it a habit to scan for assets where the 14-day ATR has dropped to a multi-month low. It's a flashing light telling me to pay very close attention because a breakout could be just around the corner.
- How it Works: Markets are cyclical, constantly moving between quiet consolidation (low volatility) and strong trends (high volatility). A shrinking ATR tells you that the consolidation phase is likely getting exhausted.
- What to Do: Once you spot this pattern, start hunting for classic breakout setups like triangles, wedges, or tight rectangles. The low ATR adds a powerful layer of confirmation that the eventual move has the potential to be explosive.
Just remember, the ATR isn't a crystal ball—it won't predict the direction of the breakout. For that, you’ll still need to bring in your price action analysis, trendlines, or other trusted indicators.
Using ATR for Volatility-Based Position Sizing
This is where the magic really happens. With this technique, you can standardize your risk across every single trade, no matter what the market is doing. The idea is simple but profound: you take smaller positions in choppy, volatile markets and can afford to take larger positions in quiet markets, all while keeping your actual dollar-risk per trade the same.
This creates what professionals call a risk-normalized strategy. You’re no longer just guessing how many shares or contracts to buy; you’re letting the market's current volatility do the hard work for you.
A high ATR means wider price swings, which translates to higher risk per share. To compensate, your position size has to be smaller. On the flip side, a low ATR signals a calmer environment, letting you take on a larger position for the exact same amount of capital risk.
Let's break down how this works with a simple formula. First, decide on a fixed percentage of your account you're willing to risk on any single trade (a common starting point is 1%). Then, use the ATR to determine your risk per share.
The Formula: Position Size = (Total Capital * Risk %) / (ATR * Multiplier)
Example Scenario: Let's say you have a $25,000 account and you're sticking to a 1% risk rule, meaning you won't lose more than $250 on a single trade. You're looking at two very different stocks.
Here’s how the ATR-based formula automatically adjusts your exposure. Notice you buy far fewer shares of the volatile stock and many more of the quiet one, but your maximum potential loss on both trades is locked in at $250.
| Stock | Current Price | 14-Day ATR | Risk per Share (2x ATR) | Position Size |
|---|---|---|---|---|
| Stock A (Volatile) | $50 | $2.50 | $5.00 | 50 Shares ($250 / $5.00) |
| Stock B (Quiet) | $120 | $0.80 | $1.60 | 156 Shares ($250 / $1.60) |
This methodical approach strips emotion out of the equation and forces consistent risk management—a true cornerstone of long-term trading success.
Finding the Right ATR Multiplier for Stops
Choosing the right ATR multiplier for your stop-loss isn't a one-size-fits-all decision. A day trader needs a tighter stop than a long-term position trader. Your choice directly impacts how much room you give a trade to breathe versus how much risk you're willing to take.
Below is a quick comparison to help you find a starting point based on your own trading style.
ATR Multiplier for Stop-Loss Strategy
| ATR Multiplier | Trading Style | Pros | Cons |
|---|---|---|---|
| 1x ATR | Aggressive Day Trading, Scalping | Very tight risk control, high R:R potential. | Prone to being stopped out by normal market noise. |
| 1.5x ATR | Day Trading, Short-Term Swing Trading | Good balance between risk and breathing room. | Can still get shaken out in volatile markets. |
| 2x ATR | Standard Swing Trading | The industry standard; gives trades enough room to work. | Requires a smaller position size to maintain risk. |
| 3x ATR | Position Trading, Long-Term Trends | Excellent protection from volatility and shakeouts. | Wider stop means a much smaller position size. |
Remember, this table is a guide, not a set of hard rules. The best approach is to backtest different multipliers on the assets you trade and see what works for your strategy. Start with a standard like 2x ATR and adjust from there based on your results and comfort level.
Common Mistakes to Avoid When Using the ATR Indicator
Even the most powerful tools in a trader's arsenal can backfire if they're not fully understood. The Average True Range is a perfect case in point; it’s an incredibly useful indicator, but it’s also surrounded by a few common and costly misconceptions. If you want to use the ATR with confidence, you have to know what not to do.
The single biggest error I see traders make is treating the ATR like a directional indicator. Let me be crystal clear: a rising ATR line does not signal an uptrend. It only signals rising volatility. The market is getting livelier, and price swings are getting wider.
That burst of energy could absolutely fuel a massive rally. But it could just as easily power a brutal sell-off. Think of the ATR as a tachometer, not a GPS. It tells you how hard the engine is revving, but you need to look at price action or other indicators to know which way the car is headed.
Ignoring Extreme ATR Spikes
Another classic mistake is misinterpreting a sudden, dramatic spike in the ATR reading. When the ATR rockets to an extreme high after a long, established trend, it's often a flashing red warning light, not a green light to jump in. These spikes frequently signal exhaustion.
- In an uptrend: A massive ATR spike can mark a climactic top. This is where the last of the buyers pile in, driven by greed and FOMO. More often than not, this is a point of reversal, not a time to go long.
- In a downtrend: A similar spike can signal a panic-selling bottom. It looks like everyone who was going to sell has finally thrown in the towel. The trend might be on its last legs.
Trader's Insight: I like to think of an extreme ATR spike as the grand finale of a fireworks show. It's spectacular, but it usually means the show is over. These are moments that call for caution and tight risk management, not aggressive new positions.
Using a One-Size-Fits-All ATR Setting
Finally, we have the trap of sticking to one ATR period for every asset, every timeframe, and every market condition. The default 14-period setting is a fine place to start, but it's rarely the optimal choice. Your strategy should drive your settings, not the other way around.
A day trader hunting for quick scalps, for instance, needs an ATR that’s highly sensitive to immediate shifts in volatility. A much shorter period, like a 5 or 7, would be far more suitable. A long-term trend follower, on the other hand, would find that same setting way too "noisy." They’d get a much cleaner read on the broader volatility trend with a smoother, longer period like 21 or 25.
Failing to adjust your settings is like trying to use the same wrench for every single bolt—it just won’t work. For more on tailoring your tools to your trading style, our post on 8 must-know tips for day traders in 2025 dives deeper into the importance of customization.
By sidestepping these common blunders, you can transform the ATR from a simple line on your chart into a genuinely nuanced tool for making smarter trading decisions.
Common Questions I Hear About the ATR
Once you get the hang of the ATR, you start running into real-world questions when you see it on a live chart. Let's tackle some of the most common ones that pop up for traders.
What’s a "Good" ATR Value for Day Trading?
There’s no magic number. A “good” ATR is completely relative to the chart you’re looking at right now. The real insight comes from context, not some universal value.
For a day trader, seeing a super low ATR on a stock that's usually all over the place can be a huge tell. It often means the market is coiling up, building energy for a potential breakout. On the flip side, an unusually high ATR is a blaring warning sign. It screams "high risk," and that’s my cue to think about using smaller position sizes to keep my exposure in check.
Key takeaway: Stop comparing the ATR of Apple to the ATR of EUR/USD. The real question is: How does this stock's current ATR compare to its own average over the last 20 days? Answering that gives you an edge.
Can the ATR Predict Where a Breakout is Headed?
No, and this is probably the most important thing to burn into your memory. The ATR is completely non-directional. Think of it as an energy meter, not a compass.
When you see the ATR value spike, it’s simply confirming that volatility is expanding. The market is moving, and it has some force behind it. But the ATR gives you zero clues about which way that move is going. To figure out direction, you have to bring in other tools. Look at price action, lean on established trendlines, or see what a moving average is telling you.
How Should I Combine the ATR with Other Indicators?
The ATR is a team player. It works best in a supporting role, where it can add a crucial layer of risk management or confirmation to your primary strategy.
Here are a couple of powerful pairings I use:
- ATR + Moving Averages: This is a classic. Use something like a 50-period MA to identify the main trend. Then, apply the ATR to set a dynamic trailing stop-loss. This combo lets you protect your profits while giving the trade enough room to breathe and ride the trend.
- ATR + RSI: This duo is great for spotting potential reversals. Imagine the ATR is flatlining (the market is dead quiet) while the RSI starts climbing out of oversold territory. This could be a sign of accumulation just before a bullish pop.
Ready to put this into practice? ChartsWatcher has the advanced tools you need to blend the ATR into your trading system seamlessly. Take a look at our platform and start seeing market volatility with more clarity today.
