What Does Oversold Mean in Stocks and How to Spot It
So, what does it actually mean when a trader says a stock is oversold?
Put simply, it's a condition where a stock has been hammered by intense, relentless selling. This constant downward pressure pushes its price to a point that, based on its recent behavior, just seems too low. It often hints that the market’s negativity has gotten a bit out of hand, setting the stage for a potential price rebound or a “snap-back.”
Decoding the Oversold Signal in Stock Trading
When traders flag a stock as oversold, they aren't making a judgment call on the company's long-term value or its financial health. Far from it. They’re pointing out a purely technical observation about price momentum and market psychology.
Think of it like stretching a rubber band. The more you pull it down, the more tension builds for a powerful snap in the opposite direction. That’s an oversold stock. This state is driven entirely by short-term supply and demand dynamics.
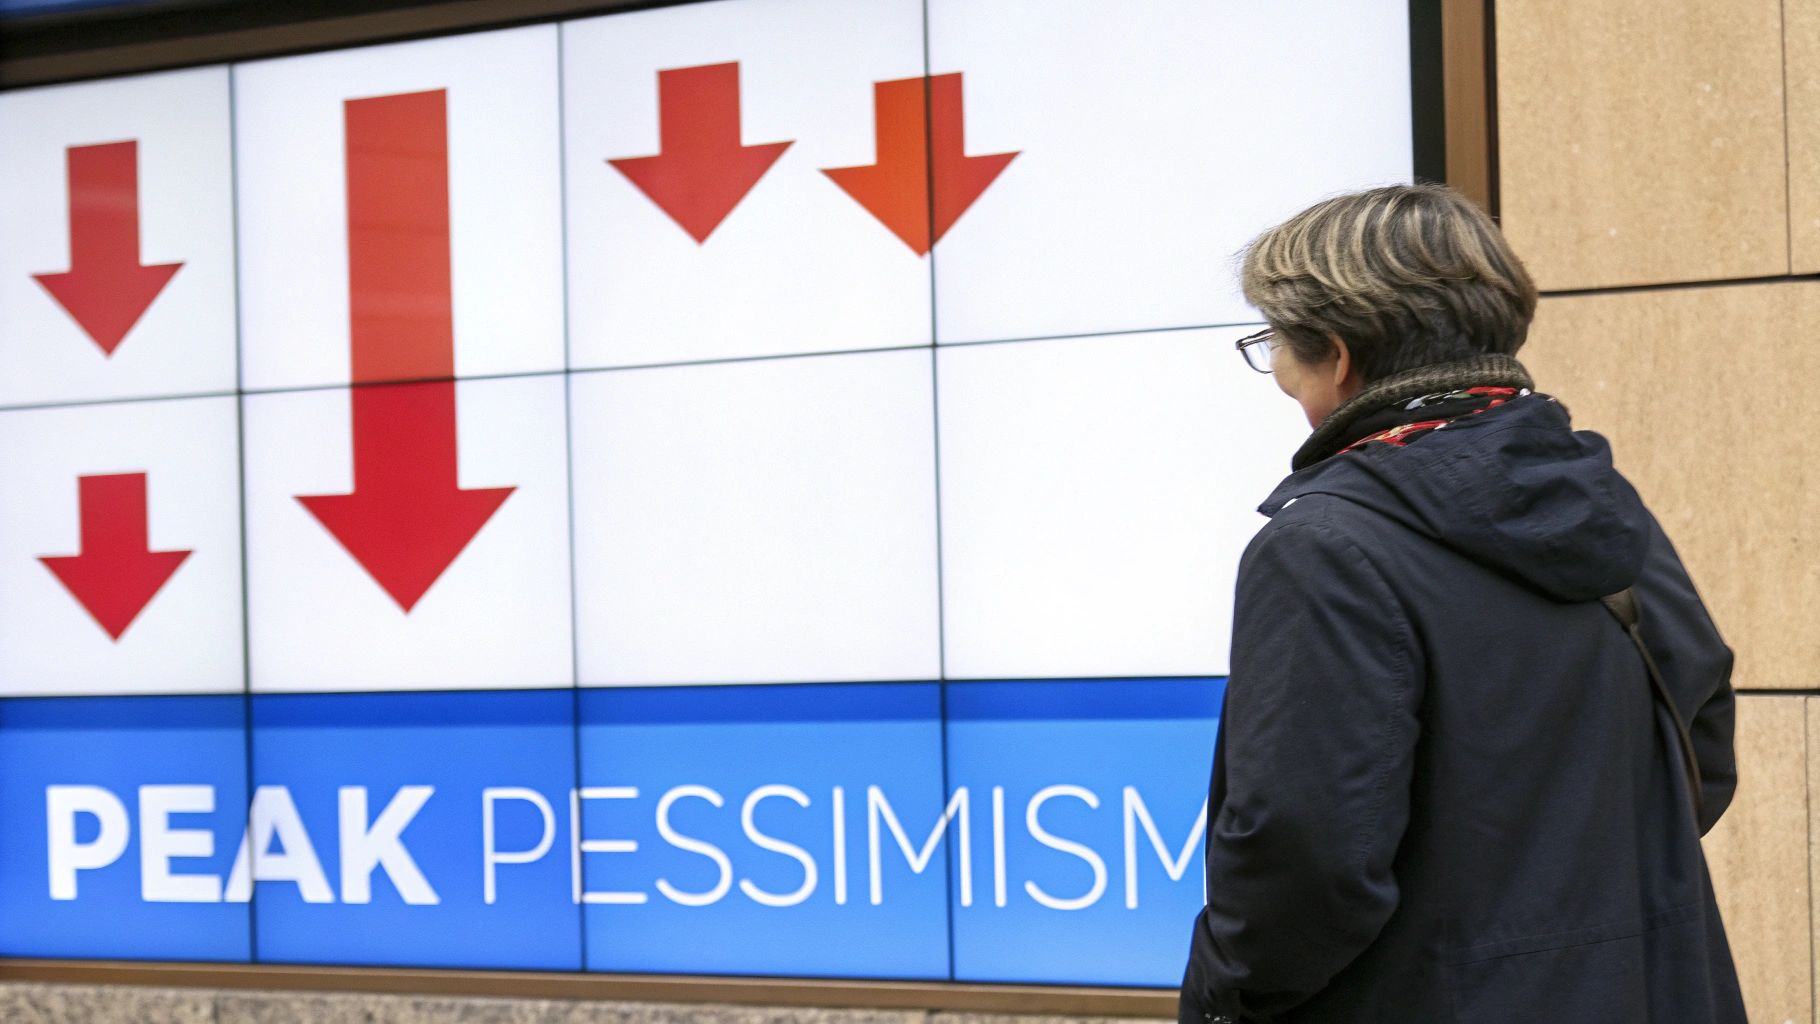
An oversold signal suggests that the sellers are pretty much tapped out—there just aren’t many people left to keep pushing the price lower. It’s a point of “peak pessimism.” At this stage, the balance of power can shift dramatically, making the stock a tempting target for contrarian buyers hunting for a short-term bounce. Getting a handle on this concept is vital because it helps you spot potential entry points that others, blinded by fear, might completely miss.
Distinguishing Oversold from Undervalued
It’s incredibly important not to mix up "oversold" with "undervalued." They sound similar, but they describe two totally different situations from opposite ends of the investing world.
To clear things up, here’s a quick breakdown of how these two concepts differ.
| Concept | Basis of Analysis | Typical Timeframe | Primary Indicators |
|---|---|---|---|
| Oversold | Technical: Based on price action, momentum, and trading volume. | Short-term (hours, days, sometimes weeks). | RSI, Stochastics, Bollinger Bands, Volume. |
| Undervalued | Fundamental: Based on a company's financial health and intrinsic value. | Long-term (months, years). | P/E Ratio, DCF Analysis, EPS Growth. |
As you can see, one is about reading the charts and the other is about reading the financial statements. They serve completely different purposes in a trading strategy.
An oversold stock is a signal about timing and short-term price momentum, whereas an undervalued stock is a judgment about its long-term value. A great company can become oversold, and a failing company can also become oversold on its way to zero.
The Trader's Toolkit for Identifying Oversold Conditions
Spotting an oversold stock takes more than just a gut feeling; you need the right set of tools. Experienced traders rely on a handful of proven technical indicators to measure market momentum and pinpoint when selling pressure has simply gone too far. These tools don't predict the future, but they offer a data-driven peek into market psychology.
Think of these indicators like the gauges on a car's dashboard. One tells you your speed, another your fuel level. While each is useful on its own, you need to glance at all of them to get the full picture of your journey. In the same way, combining a few key indicators gives you a much more reliable signal than just using one. Knowing how to read stock charts is the foundational skill that brings it all together.
Relative Strength Index (RSI)
The Relative Strength Index (RSI) is easily one of the most popular momentum oscillators out there. It measures the speed and change of price movements on a simple scale from 0 to 100.
- Oversold Signal: A reading below 30 is the classic signal that a stock might be oversold.
- What it Means: This low reading suggests that the recent selling has been so aggressive that the stock is running out of new sellers. The "rubber band" has been stretched way too far, and a snap-back reversal could be on the horizon.
Stochastic Oscillator
The Stochastic Oscillator is another powerful momentum indicator that compares where a stock's price closed relative to its price range over a set period. Just like the RSI, it works on a 0 to 100 scale.
An oversold condition is a measure of market momentum, not a company's fundamental value. This infographic helps clarify the key differences between a stock that is technically oversold and one that is fundamentally undervalued.
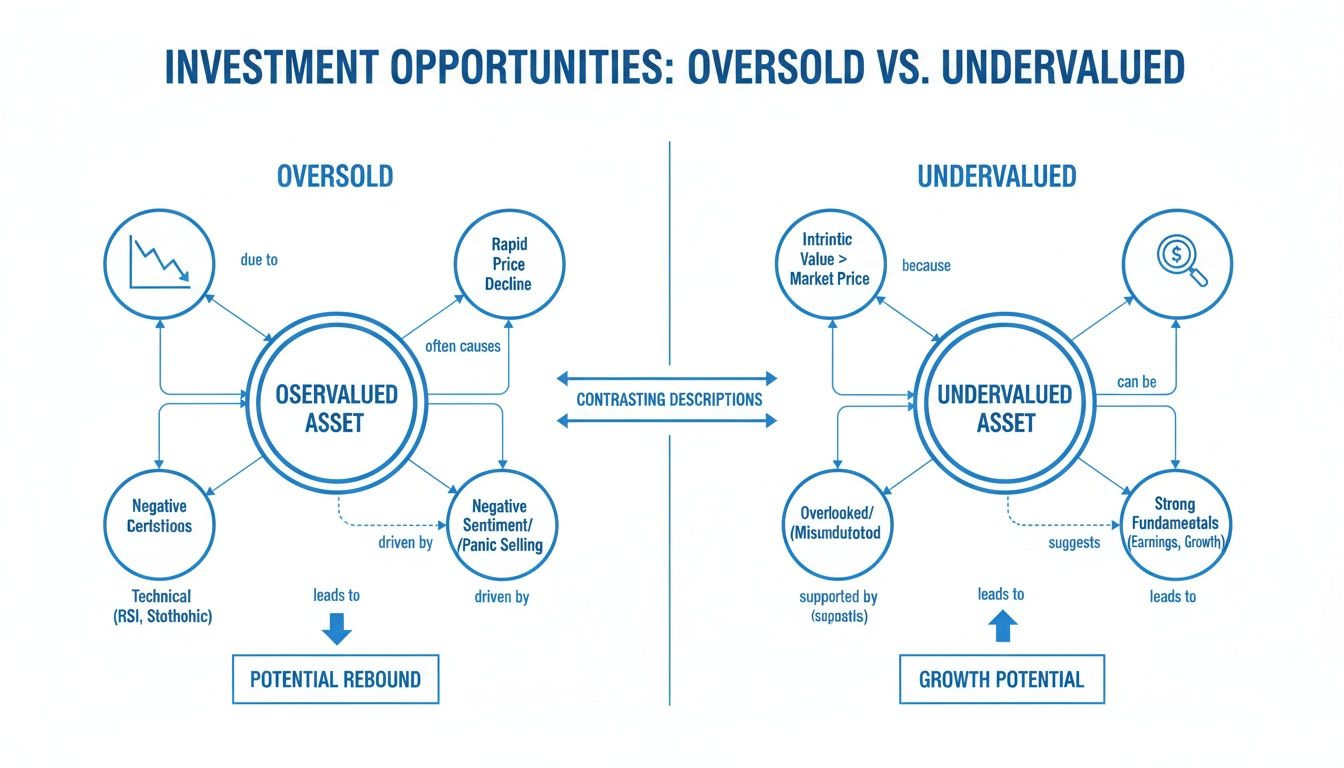
The visualization shows that oversold conditions are about short-term price dynamics, while undervaluation is about long-term intrinsic worth.
A key signal from this indicator is when its value drops into extreme territory.
- Oversold Signal: A reading below 20 is a strong sign of an oversold market.
- What it Means: This tells you the stock's price is closing near the absolute bottom of its recent trading range, signaling that the downward momentum might be completely exhausted.
Bollinger Bands
Created by the legendary John Bollinger, Bollinger Bands are a brilliant tool for measuring volatility. They consist of a middle band (a simple moving average) and two outer bands that represent standard deviations from that average.
- Oversold Signal: The price touches or breaks below the lower Bollinger Band.
- What it Means: This move signifies that the price is statistically far from its average. It suggests the recent selling spree is an extreme move that might not be sustainable for much longer.
We saw a powerful real-world example of these indicators during the March 2020 market crash. The RSI for the S&P 500 plunged below 30, hitting a low of around 23. This was a textbook oversold signal, suggesting the sell-off was fueled by pure panic, not just fundamentals. At the same time, the Stochastic Oscillator also dipped below 20, confirming the intense downside momentum.
The secret isn't to rely on a single flashing light. The best traders look for confluence, which is just a fancy word for when multiple indicators all point to the same conclusion. When the RSI is below 30 and the price pierces the lower Bollinger Band, the signal becomes far more compelling.
To really sharpen your skills, dive into our guide on the top overbought and oversold indicators for traders and start refining your strategy.
Understanding the Psychology of an Oversold Market
Technical indicators are fantastic tools, but it's crucial to remember what they're actually measuring. They aren't just squiggly lines on a chart; they're quantifying the raw, powerful human emotion that drives the market: fear. An oversold signal is less about algorithms and much more about the collective psyche of traders hitting a breaking point.
Think of it like a domino effect. When some bad news hits or a downtrend picks up steam, one person sells. Then another. Before you know it, the selling snowballs into a full-blown panic. This is classic herd mentality, where fear spreads like wildfire and logic gets thrown out the window.
In these moments, rational analysis takes a backseat. People aren't selling because a company’s five-year plan suddenly evaporated overnight. They're selling because they're terrified of losing even more money. This emotional overreaction is what shoves a stock's price far below what its fundamentals might justify, creating a major gap between its market price and its actual value.
Reaching Peak Pessimism
Once you understand this psychological backdrop, you can see what an oversold signal really represents. It often pinpoints the moment of peak pessimism—that critical juncture where just about everyone who was scared enough to sell has already hit the button.
At this point, the selling pressure is simply exhausted. With very few sellers left, it takes just a flicker of buying interest to start nudging the price back up. This is the very essence of contrarian investing, famously captured by Warren Buffett:
"Be fearful when others are greedy, and greedy when others are fearful."
An oversold stock is the market’s version of peak fear. For a savvy trader, this is a sign that the scales might be about to tip. The intense selling has created a vacuum, and any shred of good news or a slight shift in sentiment can be enough to trigger a sharp, powerful rebound.
Fear Gauges and Market Extremes
This psychological state isn't just theoretical; you can actually measure it. Instruments like the CBOE Volatility Index (VIX), often nicknamed the "fear index," are designed to track expected market volatility.
You’ll frequently see a powerful correlation between these two signals:
- High VIX Readings: Spikes in the VIX are a clear sign of widespread market fear and uncertainty.
- Oversold Indicators: At the same time, you'll often see technical indicators like the RSI plunging below 30.
When these two events happen in concert, it’s a strong confirmation that the market is being driven by emotion, not logic. For a prepared trader, this isn't a cue to join the panic. It’s a bright, flashing signal that a prime opportunity, born from the crowd's fear, could be just around the corner.
What Oversold Looks Like in the Real World
Theory is one thing, but seeing oversold conditions play out on a live chart is where the real learning begins. When you analyze how these signals appeared during actual market events, you start to understand the story behind the indicators—and more importantly, what can happen next.
These examples cut through the noise, revealing both the incredible opportunities and the hidden traps that catch unsuspecting traders. It’s one thing to know that an RSI below 30 is "oversold." It's another thing entirely to see it print on a chart during a full-blown market panic and feel the psychology driving that sell-off.
The Opportunity: Catching the Tech Sector Bottom
The tech sector gives us a classic case study of an oversold market that led to a massive rebound. When market sentiment shifts from greed to fear, it can happen in a flash, turning widespread panic into a golden opportunity for traders who know what to look for.
A perfect example played out during the tech rout of early 2022. By January, the Nasdaq 100 had been pummeled, tumbling 15% in just a month. This sent its RSI down to a deeply oversold reading of 28.
At the exact same time, giants like Apple (AAPL) and Tesla (TSLA) showed Stochastic Oscillator readings below 15, confirming the selling pressure was extreme. This wasn't just one indicator flashing a warning; it was a chorus. The signals strongly suggested the sell-off was driven more by raw fear than any sudden collapse in these companies' actual worth. For traders who recognized these classic signs, this moment of peak pessimism was a flashing green light. It came right before the Nasdaq ripped 22% higher by March 2022. You can dig deeper into this event and what it teaches about finding value in oversold stocks over at chartswatcher.com.
The Cautionary Tale: An Oversold Stock Can Always Get More Oversold
While the Nasdaq example is exactly the kind of setup we hunt for, it's just as crucial to study the times an oversold signal was a trap. This is a masterclass in risk management, and it gets to the heart of the question, "what does oversold mean in stocks?" It means a stock is stretched, but it doesn't mean it can't stretch further.
One of the biggest mistakes new traders make is thinking "oversold" means a stock can't possibly fall any lower. In reality, a stock with devastating fundamental problems can stay oversold for weeks or even months as it just keeps bleeding out.
Imagine a company that gets hit with an accounting scandal or announces a failed clinical trial. The news triggers a massive sell-off, pushing its RSI and Stochastics deep into oversold territory.
- The Signal: The RSI plunges below 20.
- The Trap: Traders pile in, assuming a quick, easy bounce is inevitable.
- The Reality: The news is so toxic that fresh waves of selling keep hitting the market. The stock just grinds lower day after day, staying pinned in the oversold zone.
This kind of scenario teaches a vital lesson: technical signals don't exist in a vacuum. An oversold reading in a rock-solid company during a market-wide panic is a world away from an oversold reading in a company whose entire business model is imploding. Always check the context before you even think about putting capital to work.
How to Build a Smarter Oversold Trading Strategy

Spotting a stock that’s flashing "oversold" is really only half the battle. If you just jump in and buy every stock that dips into oversold territory, you're looking at a fast way to drain your trading account. A pro, on the other hand, comes to the table with a clear, disciplined strategy that lays out exactly when to enter, where to place a stop-loss, and how to confirm the signal is real.
Patience and precision are what turn a potential opportunity into a profitable trade. The goal isn't to catch a falling knife; it's to enter the moment momentum starts shifting back to the buyers.
Defining Your Entry Triggers
Blindly buying a stock just because its RSI dropped below 30 is a classic rookie mistake. Smart traders know better. They wait for confirmation that the downward slide has actually run out of steam. A solid entry trigger is what turns a simple observation into a concrete, actionable plan.
Here are a few proven entry triggers you can build into your own strategy:
- Indicator Crossover: Don't just act when the RSI or Stochastic Oscillator hits oversold. Wait for it to cross back above that threshold. For example, if RSI drops to 28, you wait for it to climb back up to 31. This small move is a huge clue that buying pressure is starting to trickle back in.
- Bullish Candlestick Patterns: Once you get an oversold signal, look for a confirmation candle to print on the chart. A powerful pattern like a bullish engulfing or a hammer candlestick shows that buyers are stepping up to defend a specific price level.
Mastering Risk Management
Let’s be clear: no strategy works 100% of the time. The single most important rule in trading is to protect your capital. An oversold stock can always get more oversold, especially if there's bad fundamental news driving the sell-off. This is why having a non-negotiable stop-loss is absolutely critical.
A stop-loss isn't an admission of failure. It’s a professional tool for preserving your trading capital so you can live to trade another day. It is the bedrock of disciplined trading.
Before you ever click "buy," you must know exactly where your exit point is if the trade goes south. Set your stop-loss just below a recent low or at a key support level. This ensures you take a small, manageable loss instead of a catastrophic one if the downtrend decides to keep on rolling.
Spotting Bullish Divergence for Powerful Signals
Want to level up? One of the most powerful techniques out there is identifying bullish divergence. This happens when the stock’s price sinks to a new low, but a momentum indicator like the RSI or Stochastic Oscillator fails to follow suit, instead carving out a higher low.
This mismatch is a huge tell. It signals that the downward momentum is fizzling out, even as the price is still dropping. It’s like the sellers are getting exhausted. When you combine a bullish divergence signal with a clear entry trigger, you often get a high-probability trade setup.
To take this even further, you can explore various predictive modeling techniques to help anticipate market movements and build even more intelligent strategies.
Finding Oversold Stocks Automatically with ChartsWatcher
Manually flipping through hundreds of charts to spot an oversold stock is a recipe for frustration. It's slow, tedious, and by the time you find something, the opportunity might have already passed. In a market that moves by the second, you need a system that brings the setups to you.
This is where automation becomes your best friend. A dedicated stock scanner does the heavy lifting, filtering the entire market in real-time based on the exact rules you give it. Instead of hunting for setups, you let them come to you. You save hours of screen time and, more importantly, you don't miss a potential trade just because you were looking at the wrong chart.
Here’s a look at the ChartsWatcher scanner interface, where you can build your own custom filters to find specific market conditions.
As you can see, it’s simple to layer technical indicators like RSI and Stochastics to create a very precise, automated search for oversold conditions.
Building Your Custom Oversold Scan
With ChartsWatcher, you can put together a powerful, automated scan in just a few minutes. This system will then tirelessly watch the market for you, alerting you the moment a stock meets your definition of "oversold." This is how you take the concept of what does oversold mean in stocks and turn it into a practical, repeatable strategy.
Let's build a simple but effective scan to find high-potential oversold candidates:
- Set the RSI Filter: Your first rule is the classic. Look for stocks with an RSI (14) below 30. This is your primary signal that a stock has seen heavy, and potentially excessive, selling pressure.
- Add the Stochastic Filter: For confirmation, add a second rule for the Stochastic Oscillator (14, 3, 3) to be below 20. When both oscillators are this low, it strengthens the case that downside momentum is truly exhausted.
- Filter by Volume: To make sure the signals are meaningful and the stock is liquid enough to trade, add a filter for Average Volume (30) to be greater than 500,000 shares. This step is crucial—it weeds out thinly traded, erratic stocks where technical signals can be unreliable.
By layering these filters, you're not just finding any oversold stock. You're finding oversold stocks that have enough trading interest to make a potential reversal more likely.
From here, you can get even more creative. Dig into the full power of the ChartsWatcher stock scanner and add more layers to your analysis. For instance, you could add alerts to get instant notifications or use the backtesting feature to see how this oversold strategy would have performed over the last year.
This is how you shift from a manual hunt to a systematic, data-driven operation.
The Big Questions About Oversold Stocks
When you first start digging into technical analysis, the concept of "oversold" always brings up a few questions. Even seasoned traders can get tripped up on the nuances. Let's tackle some of the most common ones I hear all the time.
Is an Oversold Stock an Automatic "Buy" Signal?
Let's be crystal clear: absolutely not. Thinking this way is one of the fastest ways to lose money.
An oversold signal is simply a bright red flare telling you that the selling has been extreme and relentless. It's a prompt to start your research, not a green light to jump in. A fundamentally weak company with deteriorating financials can stay oversold—and keep falling—for a very, very long time.
How Long Can a Stock Actually Stay Oversold?
Longer than you think. A stock can wallow in oversold territory for days, weeks, or even months. This happens all the time, especially during a brutal bear market or when a specific company is dealing with some serious internal problems. The market's pessimism can easily crush any technical reading for an extended period.
This is precisely why risk management is non-negotiable. An oversold stock can always become more oversold. Setting a stop-loss isn't just a good idea; it's the only thing that will protect your capital from a stock that just keeps bleeding out.
What’s the Single Best Indicator to Find Oversold Stocks?
There isn't one. The pros don't rely on a single magic bullet; they look for confluence. This is where multiple, independent indicators all start flashing the same warning sign, giving you a much more reliable signal.
For spotting oversold conditions, a powerful and popular combination is:
- Relative Strength Index (RSI): Perfect for gauging the raw speed and momentum of recent price drops.
- Stochastic Oscillator: Great for seeing where a stock's price closed relative to its recent high-low range.
When you see both the RSI and Stochastics dipping into oversold territory at the same time, your odds of being right about a potential bounce go up dramatically. Using them together is always better than flying blind with just one.
Ready to stop searching and start finding? ChartsWatcher provides the powerful, real-time scanning tools you need to automatically identify the best oversold opportunities in the market. Build your first custom scan with ChartsWatcher today.
