Oversold Stock Definition Finding Trading Value
When traders talk about finding a stock that’s oversold, they're really talking about a potential bargain. It’s a situation where a wave of negative market sentiment pushes a share’s price well below what the company is actually worth.
This creates a window of opportunity for sharp-eyed traders who can spot an irrational sell-off when it happens.
What is an Oversold Stock?
Think of it like this: imagine your favorite high-quality brand suddenly ends up in the bargain bin, with prices slashed for no good reason. That's essentially what an oversold stock is. Panic selling, often triggered by bad news or sector-wide fear, drives its price down far beyond what its business fundamentals justify.
This gap between the market price and the company's true value is a major clue. It signals that emotions—not the company's performance—are in the driver's seat. This is precisely the kind of crack in the market that savvy traders look for to find a potential entry point.
From a technical standpoint, an oversold stock is often identified using indicators like the Relative Strength Index (RSI). When the RSI for a stock drops below 30, it suggests that the downward price momentum is getting stretched and the stock might be undervalued. You can find a bit more detail on what defines an oversold asset on MarketBeat.
To make this clearer, let's break down the key differences between an oversold stock and one that's trading at a fair price.
Oversold vs Fairly Valued Stock Characteristics
Here’s a quick comparison outlining the key differences between an oversold stock and one trading at a fair value.
| Characteristic | Oversold Stock | Fairly Valued Stock |
|---|---|---|
| Price Momentum | Sharp, often aggressive, decline | Stable fluctuations up and down |
| Market Mood | Excessive negativity, fear, or panic | Balanced optimism and caution |
| RSI Reading | Typically below 30 | Usually between 30 and 70 |
| Reversal Chance | Elevated; primed for a potential bounce | Normal, following the broader market trend |
This table helps illustrate how an oversold condition is an extreme state driven by sentiment, not a normal market fluctuation.
How Traders Pinpoint Oversold Stocks
An oversold signal is a starting point, not a guarantee. It's a clue that tells you to dig deeper, not a blind command to buy.
So, what pushes a perfectly good stock into the bargain bin in the first place? Several factors can create oversold conditions:
- Sector-Wide Sell-Offs: Fear in one part of the market can drag down even solid, unrelated stocks.
- Negative News: A single bad headline can cause a sharp, emotional swing in investor sentiment.
- Rapid Profit-Taking: After a long rally, traders might cash out all at once, creating a temporary price drop.
- Economic Surprises: Unexpected economic data can trigger widespread panic selling.
- Algorithmic Trading: Automated systems can amplify price drops, turning a small dip into a steep dive.
Because of this, experienced traders rarely rely on a single indicator. They'll often combine an oversold RSI reading with other tools like trading volume or classic chart patterns to confirm what they're seeing. This layered approach helps filter out false alarms and builds confidence before putting any capital on the line.
For example, seeing a stock's RSI dip below 30 is interesting. But seeing that happen right as the price hits a well-established historical support level? That's a much stronger signal. This blend of technical indicators and price structure is a smarter way to approach trades.
If you’re looking for tools to help you find these opportunities, scanners like ChartsWatcher can be configured to automatically scan the market for oversold setups, saving you a ton of manual work.
Using Indicators to Find Oversold Stocks
So how do you actually spot one of these potential bargains? You need the right set of tools. Just like a mechanic uses gauges to diagnose an engine, traders use technical indicators to get a read on a stock’s price action and hunt for those oversold conditions. These tools essentially translate the wild swings of market psychology into cold, hard data, pointing you toward stocks that sellers might have pushed down a little too aggressively.
Most of these indicators live under the big tent of technical analysis, which is all about studying price charts and trading volume to figure out where the market might head next. When it comes to finding oversold stocks, the undisputed king of indicators is the Relative Strength Index (RSI). It's a favorite among traders for a reason: it’s simple and it works.
The Relative Strength Index (RSI)
At its core, the RSI is a momentum gauge. It measures the speed and size of a stock's recent price moves and plots it on a simple scale from 0 to 100. Think of it as a pressure gauge for buying and selling.
- RSI Above 70: This suggests a stock might be overbought. The buying frenzy has gone on a little too long, a little too fast, and a pullback could be on the horizon.
- RSI Below 30: This is the magic number for our oversold stock definition. When the RSI dips below this line, it’s a strong signal that sellers have been in complete control and the stock might be undervalued, at least in the short term.
When a stock's RSI drops below 30, it’s like a flare going up. It doesn't mean you should blindly hit the "buy" button, but it’s a loud-and-clear signal that this stock deserves a spot on your watchlist for a potential rebound.
The infographic below really drives home the difference between an oversold stock and one that's trading closer to its fair value.
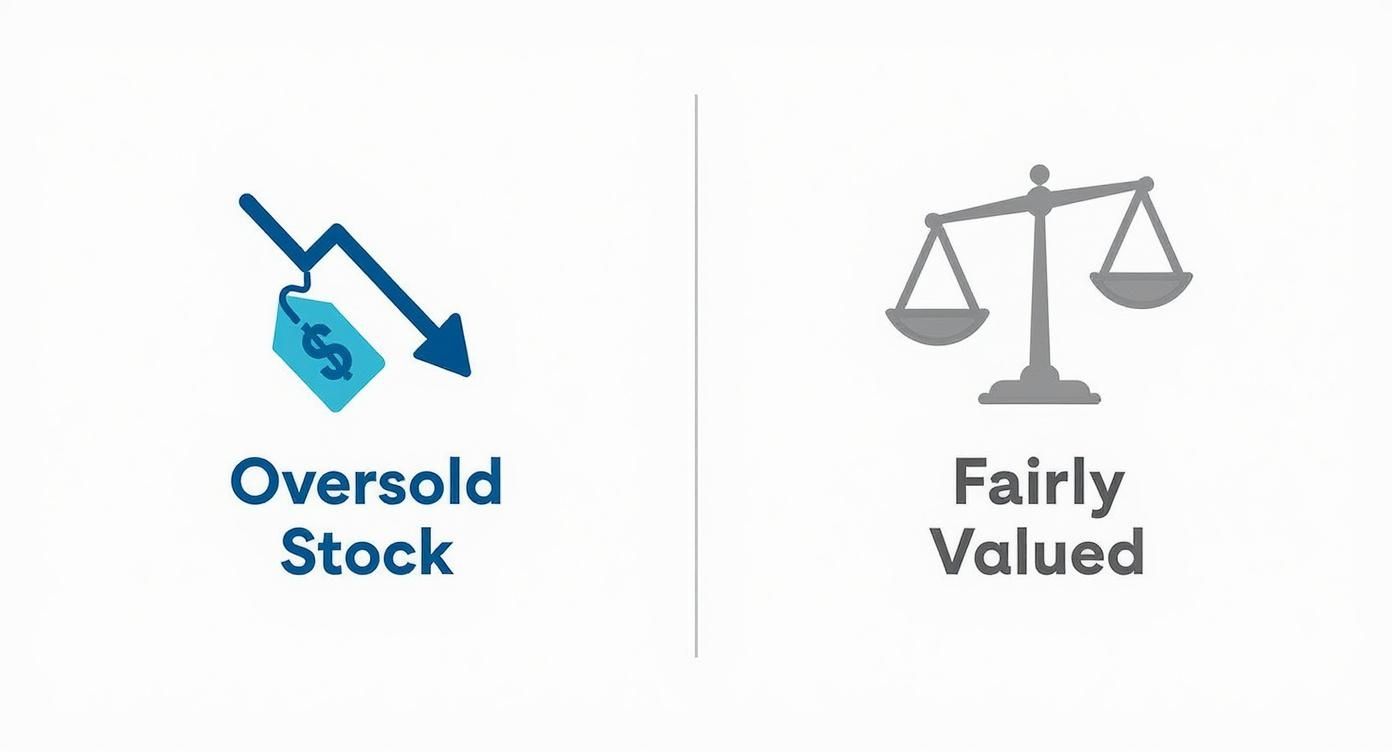
You can see how emotional selling can pull a stock's price way out of line with its perceived value.
Building Confidence with Multiple Indicators
Now, here’s a pro tip: relying on a single indicator is a risky game. False signals happen. A stock can stay oversold for a long, long time, especially if the whole market is in a nosedive. That’s why seasoned traders always look for confirmation. By getting a second or even third opinion from other indicators, you can build a much stronger case for a trade. If you want to dive deeper into this, check out our guide on using oversold and overbought indicators to time your trades.
A single indicator is a hint. A combination of indicators is a thesis. Smart traders look for confirmation to filter out the noise and increase their odds of success.
So, what other tools can back up what the RSI is telling you?
- Stochastic Oscillator: This one works a lot like the RSI, but it compares a stock's closing price to its price range over a set period. A reading below 20 is considered oversold and serves as a fantastic confirmation signal.
- Bollinger Bands: These are bands drawn two standard deviations away from a simple moving average. When a stock's price touches or crashes through the lower Bollinger Band, it’s a sign that the price has stretched too far to the downside and is likely due for a snapback toward the average.
By waiting for multiple signals to line up—say, an RSI below 30 and the price hitting the lower Bollinger Band—you dramatically improve the quality of your trade ideas and avoid getting faked out by market noise.
How Oversold Stocks Behave in the Real World
Technical indicators and charts are great, but the real test is seeing how a concept holds up when the market gets chaotic. To really get a feel for what oversold means, we need to look at how these situations played out during major market shocks—times when raw fear and panic took over.
These historical moments are where the best lessons are learned.

During moments of extreme stress, you'll often see entire sectors become oversold. It’s not about one company failing; it's about widespread negative sentiment dragging everything down with it.
Think back to the 2008 financial crisis. Countless stocks saw their RSI values plunge below 30 and stay there for weeks as waves of panic selling hit the market. A more recent example? The COVID-19 crash in March 2020. The S&P 500 dropped about 34% from its peak, pushing tons of high-quality, brand-name stocks deep into oversold territory. You can learn more about how indicators identify these market extremes on FXOpen.
The Rebound and the Warning
In many of these historical meltdowns, what came next was a sharp, powerful rebound. Traders who spotted the oversold signals—and, crucially, confirmed the underlying companies were still fundamentally solid—were in a prime position to ride the recovery wave. The market's snapback from the 2020 lows is a textbook example of this in action.
But these events also teach a vital lesson in patience and risk management.
An oversold reading is not a crystal ball. It’s a signal that the balance between buyers and sellers may be about to shift, but it offers no guarantees on timing or magnitude.
A stock can stay oversold for a long, long time, especially if the bad news just keeps coming. One of the costliest mistakes a trader can make is trying to "catch a falling knife" by jumping in too early.
This is why an oversold signal should always be the start of your research, not a blind command to buy. It’s an alert telling you to dig deeper, check the company's health, and look for other signs that the downward slide is finally losing steam.
Building a Smarter Oversold Trading Strategy
Spotting a stock with a low RSI is just the opening bell, not the finish line. A disciplined trader knows that a single indicator is only a hint, a nudge to look closer. The real work begins now, turning that oversold signal into a structured, high-probability trade.
Your first step is always confirmation. Don't just take the RSI's word for it. Look for supporting evidence from other indicators. Is the price also hitting its lower Bollinger Band? Is the Stochastic Oscillator reading below 20? When multiple tools point to the same conclusion, your confidence in the setup grows substantially.
Next, you have to look beyond the chart. A falling price can be a symptom of a much deeper problem. This is where a quick fundamental health check is critical. Is the company tangled in a lawsuit? Did it just lose a major customer? A stock can look oversold for a very good reason, and you need to make sure you aren't walking straight into a value trap.
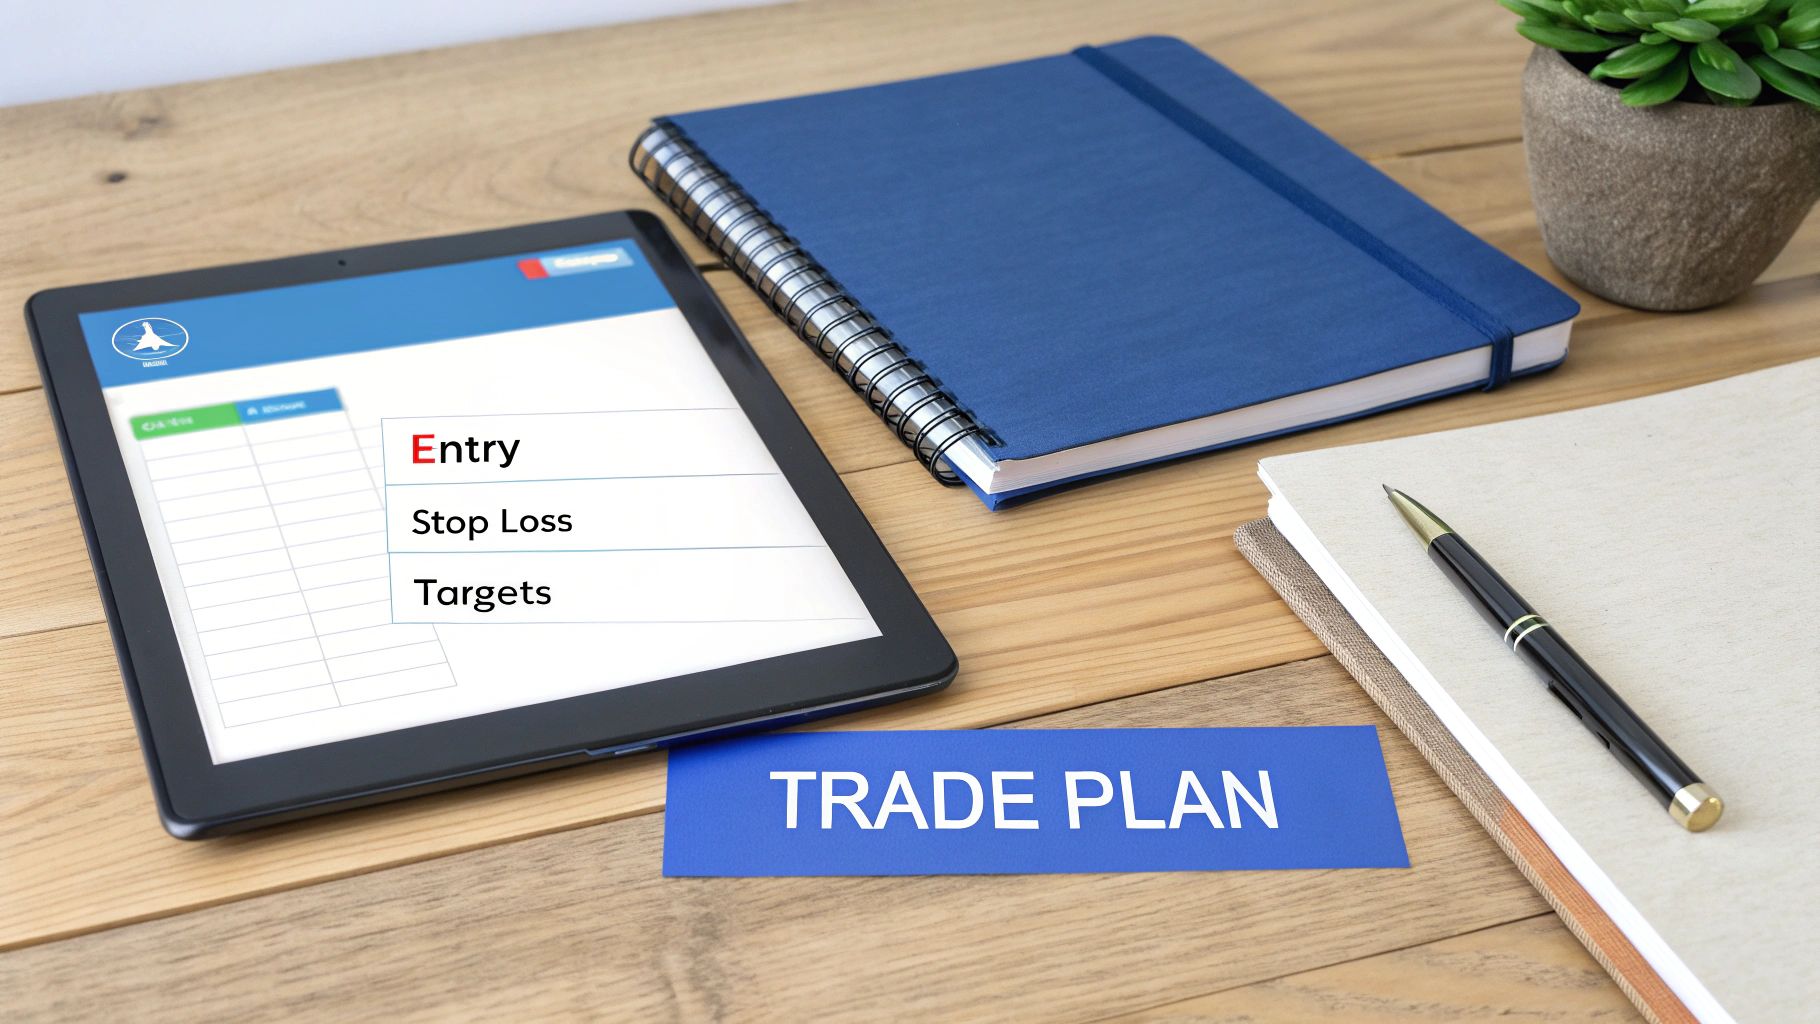
Structuring Your Trade
Once you've confirmed the signal and checked the fundamentals, it's time to map out your trade with absolute precision. This is what separates strategic trading from pure gambling.
- Define Your Entry: Don't just jump in because the RSI is low. Wait for a bullish reversal pattern to appear, something like a hammer candlestick or a bullish engulfing pattern. These are the market’s way of signaling that buyers are finally stepping back in.
- Set a Stop-Loss: This is your non-negotiable safety net. Figure out the maximum amount you are willing to lose and place a stop-loss order just below a recent low. This protects your capital if the downtrend decides to continue its plunge.
- Identify Profit Targets: Know where you’re getting out before you even get in. This could be a key resistance level you’ve identified or when the RSI climbs back toward the 50 or 70 mark.
Building a trading strategy around oversold signals is fundamentally an exercise in risk management. Your entry and exit rules are more important than the signal itself.
This structured approach is a core element of many trading styles, including what’s known as a mean reversion strategy. You can learn more about this disciplined method in our detailed guide on the topic: https://chartswatcher.com/pages/blog/mean-reversion-strategy-expert-data-driven-trading-tips.
To really dial in your approach, you can also explore market dynamics and advanced trading insights from specialized resources that analyze the forces driving these major price moves.
Common Traps and Risks to Avoid
While trading oversold stocks can feel like you've found a hidden gem, the path is littered with pitfalls that can turn a great setup into a painful loss. Knowing these risks is every bit as important as spotting the initial signal.
The single biggest mistake traders make is assuming "oversold" automatically means "cheap" or "undervalued." It doesn't. An oversold reading is purely a technical signal about price momentum, not a judgment on the company's actual worth. A stock can become oversold for perfectly good reasons—like crumbling business performance or an entire industry getting disrupted.
This leads us straight into the classic value trap: a stock that looks like a bargain but just keeps falling because of deep-seated, fundamental problems.
Recognizing Value Traps and Falling Knives
A low RSI reading offers zero protection if a company is fundamentally broken. Before you even think about buying based on an oversold signal, you have to play detective: Why is the stock falling? Is this just a market overreaction, or is it a genuine red flag waving in your face?
The other major risk is trying to "catch a falling knife." This is what happens when you jump into a steep downtrend way too early, only to watch the price continue its nosedive. A stock can stay parked in oversold territory (with an RSI below 30) for a surprisingly long time, especially during a grinding bear market.
A stock can stay irrational longer than you can stay solvent. Just because an indicator says a stock is oversold doesn't mean it can't go lower.
To keep your capital safe, be on high alert for these common mistakes:
- Ignoring the Broader Trend: Trying to fight a powerful market or sector downtrend is a low-probability bet. An oversold bounce is far more likely to fizzle out if the overall market sentiment is overwhelmingly negative.
- Neglecting Confirmation Signals: Relying on a single indicator is like driving with your eyes closed. Always wait for confirmation from other technical signals or clear bullish price action before pulling the trigger.
Ultimately, the key to avoiding these costly traps is to treat an oversold signal as a call to investigate—not a command to buy.
Got Questions About Oversold Stocks? We've Got Answers
So you've got the basics down, but that's usually when the real questions start popping up. When you're looking at a chart and your money is on the line, theory needs to turn into practice. Let's tackle some of the most common questions traders have once they start hunting for oversold stocks.
How Reliable Is the RSI, Really?
The Relative Strength Index (RSI) is one of the most respected tools in a trader's arsenal, but it's not a crystal ball. Think of it as a smoke alarm, not a firefighter. An RSI dipping below 30 is a powerful signal that tells you to pay close attention, but it's not a blind command to buy.
Its reliability shoots way up when you pair it with other indicators, like Bollinger Bands, or dig into the company's fundamental health. Context is everything. In a brutal, grinding bear market, a stock can stay "oversold" for what feels like an eternity. Always look at the bigger picture.
Oversold vs. Undervalued: What's the Difference?
This is a critical distinction that trips up a lot of people. They are absolutely not the same thing.
- Oversold is a technical condition. It’s all about price momentum and speed. A stock gets oversold because it has dropped hard and fast, usually due to panic selling.
- Undervalued is a fundamental condition. This means the stock’s market price is trading for less than its actual business is worth, based on things like earnings, assets, and growth prospects.
A stock can be oversold without being a good value. But when you find a stock that is both oversold and undervalued? That's the sweet spot.
The best opportunities often arise when the technical (oversold) and fundamental (undervalued) align, signaling that a temporary market panic has created a genuine bargain in a solid company.
Can a Great Company Become Oversold?
Absolutely. In fact, this is where some of the most legendary trading opportunities are born. A perfectly healthy, profitable company can get dragged down by forces that have nothing to do with its own performance.
Think about broad market crashes, negative news hitting an entire sector, or a massive overreaction to a minor earnings miss. When fear and emotion drive a sell-off—rather than a real problem with the company's long-term future—it can push a fantastic business into oversold territory. For the prepared trader, that's a prime opportunity to buy quality at a discount.
Gain a trading edge with ChartsWatcher, the advanced market scanning tool designed to help you spot oversold conditions and other key technical setups in real time. Customize your dashboards, set precise alerts, and find your next trade faster. Start your analysis today.
