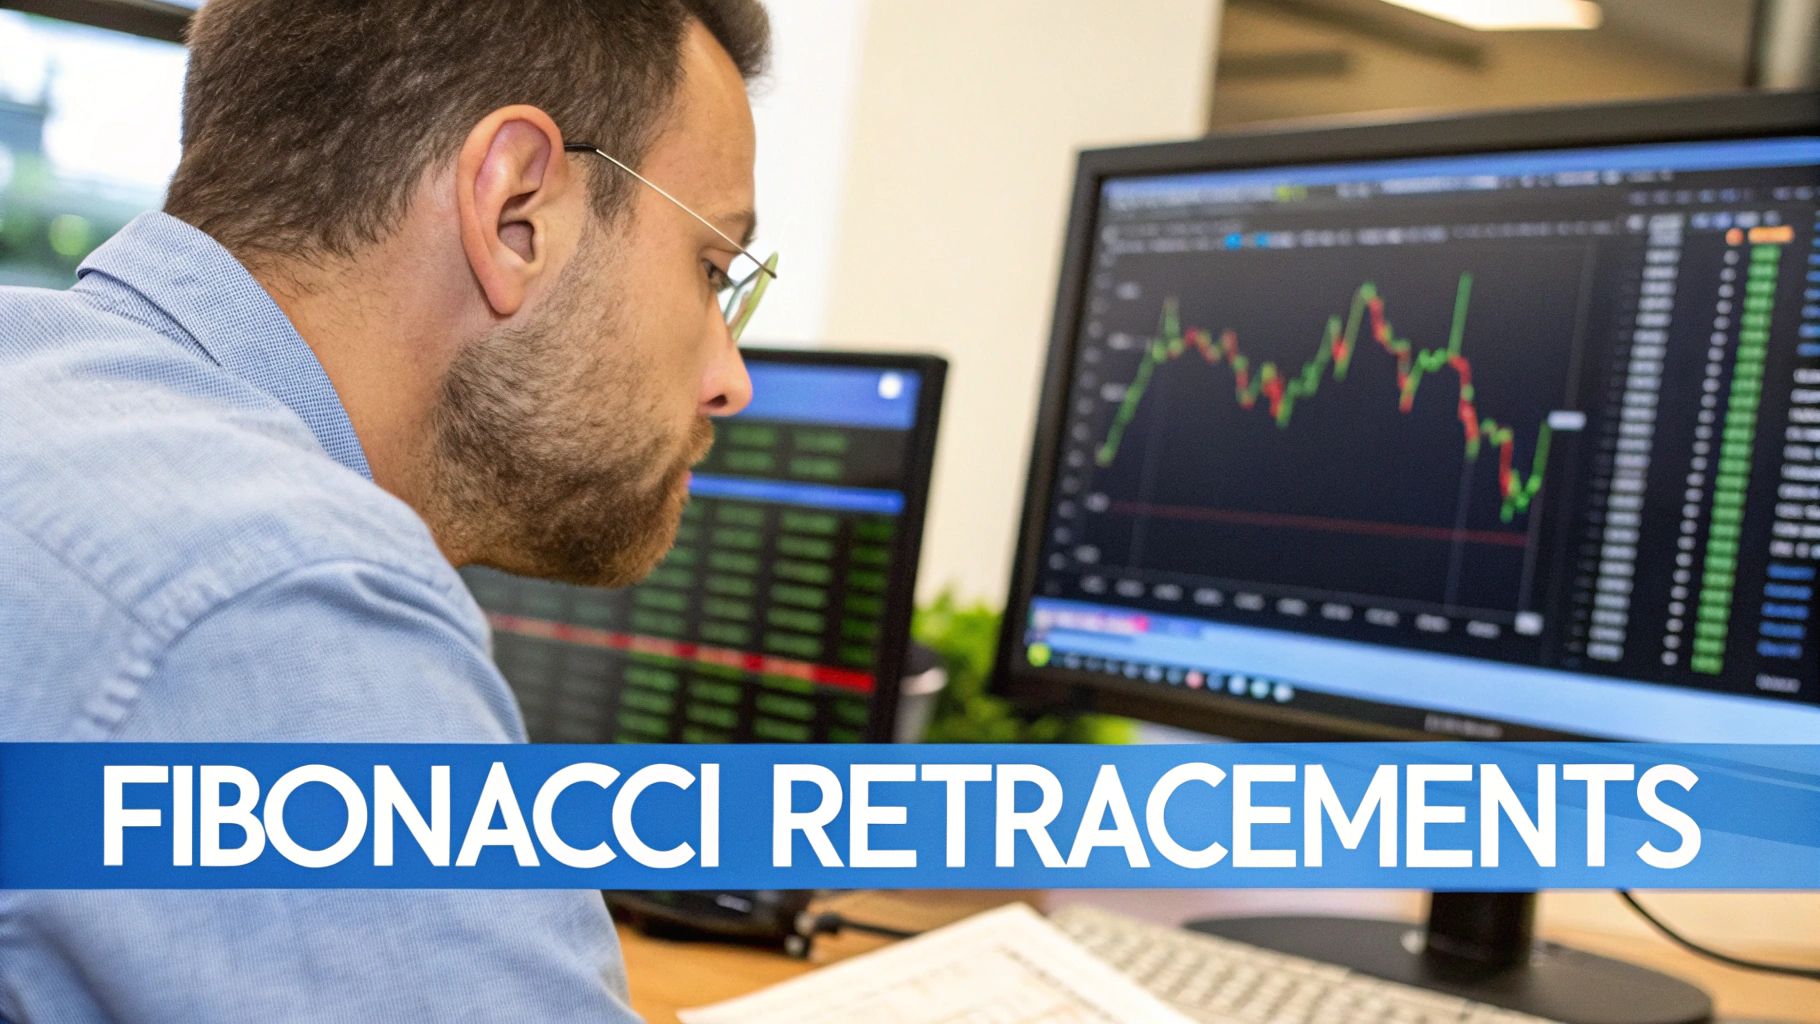
What Are Fibonacci Retracements? Key Trading Levels Explained
Fibonacci retracements are a staple in a technical trader's toolbox. At their core, they are horizontal lines you draw on a chart to flag potential support and resistance levels. Think of them as a roadmap for predicting where a stock's price might pull back to during a temporary dip within a larger trend.
What Are Fibonacci Retracements in Trading
Imagine a wave crashing onto the shore. It doesn't just hit the beach and disappear; it pulls back into the ocean before the next wave arrives. The stock market moves in a very similar way.
Prices rarely move in a perfectly straight line, even during a strong bull or bear market. Instead, they ebb and flow in a series of waves, with periods of upward momentum followed by temporary pullbacks or "retracements." Fibonacci retracements help traders anticipate where these pullbacks might finally run out of steam.
The tool itself is based on a mathematical sequence discovered way back in the 13th century by Leonardo Pisano, better known as Fibonacci. In this sequence, each number is simply the sum of the two that came before it (0, 1, 1, 2, 3, 5, 8, 13, and so on). From these numbers, traders derive key ratios that seem to appear over and over again in financial markets. If you're curious about the math, this detailed guide breaks down how the sequence creates trading ratios and the famous "golden ratio."
The Core Retracement Levels
When you apply the Fibonacci tool to a chart, it plots several horizontal lines at key percentage levels of a previous price move. These levels are the spots traders watch closely for signs of support or resistance.
This table breaks down the most significant levels you'll see on your chart and what they typically mean for price action.
Key Fibonacci Retracement Levels Explained
| Retracement Level | Significance in Trading | Typical Price Behavior |
|---|---|---|
| 23.6% | The first and shallowest retracement level. | Often acts as a minor support/resistance area in a very strong trend. A bounce here indicates powerful momentum. |
| 38.2% | A more significant level, often the first major stopping point for a pullback. | Traders watch for a pause or reversal here. If the price breaks through, it may head for the 50% level. |
| 50.0% | Not technically a Fibonacci ratio, but widely used as a key psychological halfway point. | A common area for price to reverse. A break below this often suggests a more profound trend change might be underway. |
| 61.8% | Known as the "golden ratio," this is often considered the most critical retracement level. | A bounce from the 61.8% level is a powerful confirmation that the original trend is likely to continue. |
| 78.6% | A deep retracement level, often the last line of defense before a full trend reversal. | A pullback to this level can offer a high-reward entry, but it also signals the trend is weakening. |
Ultimately, these levels provide a framework for anticipating market psychology and the natural rhythm of price movements.
By identifying these potential reversal zones, traders can make more informed decisions about where to enter a trade, place stop-loss orders, or take profits. It transforms guesswork into a structured strategy.
So, what are Fibonacci retracements? They're a technical analysis tool that helps you pinpoint high-probability areas for a trend to resume after a pullback. By understanding where these potential floors and ceilings are, you get a much clearer picture of the market's ebb and flow and can spot better trading opportunities.
The Meaning Behind Key Fibonacci Levels
Knowing the percentages is one thing, but the real skill is learning to read the market psychology behind them. Each Fibonacci level tells a story about the ongoing tug-of-war between buyers and sellers. These aren't just random lines on a chart; they're reflections of collective human behavior playing out in real-time.
Think of these levels like checkpoints in a marathon. A shallow pullback to the 23.6% or 38.2% level is like a runner just slowing down for a quick cup of water. It signals that the trend is incredibly strong, and buyers are practically tripping over themselves to get back in at the slightest discount. That shows powerful conviction.
A deeper retracement, however, tells a very different story.
The Mid-Point and the Golden Ratio
The 50% level, even though it's not an official Fibonacci ratio, is a huge psychological benchmark. It’s the exact halfway point of the entire move—a perfect equilibrium. If sellers manage to push the price past this 50% mark, it's often a big warning sign that they're gaining momentum and the original trend is starting to gasp for air.
Then you have the 61.8% level, famously known as the "golden ratio." This is arguably the most-watched Fibonacci level of them all. A solid bounce off this area is a powerful confirmation that the trend is still alive and kicking. Many traders see it as the last line of defense; a break below it often means the original move has run out of steam and a full reversal could be on the table.
Here's the secret: these levels often work because so many traders are watching them. This creates a self-fulfilling prophecy. When everyone expects a bounce at 61.8%, they place their buy orders there, creating the very support they were anticipating.
Evidence in Market Behavior
History shows these levels have real predictive value. For instance, one analysis of the Indian stock market found that prices pull back to a key Fibonacci level about 70% of the time. The 61.8% level, in particular, acts as a critical pivot point where major price reversals happen roughly 60% of the time.
By learning to interpret the story behind each level, you stop seeing lines and start understanding the market's mood. Of course, this isn't a standalone strategy. The real power comes from combining this insight with other core technical tools. To see how these levels act as dynamic barriers, check out our trader's guide to stock support and resistance, which breaks down these crucial concepts in more detail.
How to Draw Fibonacci Levels on Your Charts
Knowing the theory is one thing, but putting it into practice on a live chart is where you start to find a real edge. Drawing Fibonacci retracements isn't complicated; it's a simple process that turns those abstract percentages into concrete zones where you can plan entries and exits.
Let's walk through exactly how to do it, so you get it right every single time, no matter which way the market is headed.
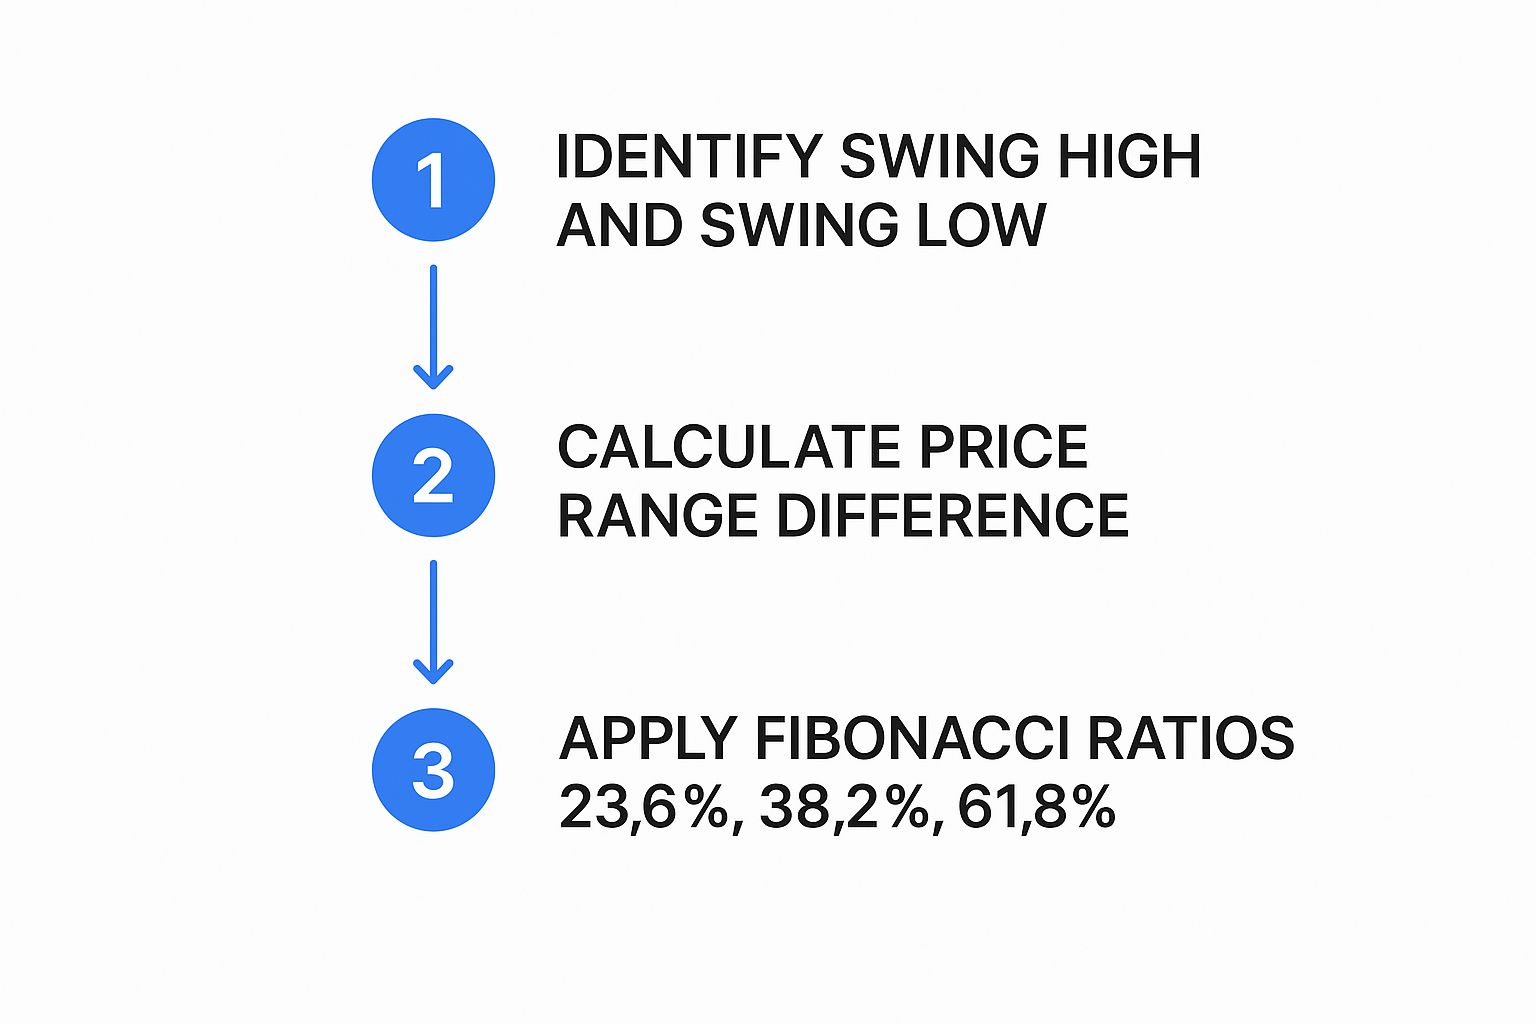
The whole game hinges on finding two critical points on your chart: the swing high and the swing low. These are simply the highest and lowest points of a single, significant price move. Think of them as the start and finish lines of one "wave" in the market.
Getting these anchor points right is everything. If you pick minor, insignificant wiggles in the price, your Fibonacci levels will be useless. You have to focus on the clear, sustained moves that define the recent trend. If you need a quick refresher on spotting the market's direction, our guide on how to draw a trendline is a great place to start.
Drawing Levels in an Uptrend
When a stock is climbing, you're looking to measure that big upward push to predict where a pullback might find a floor. This is where buyers might decide to jump back in. The process is logical and easy to remember.
- Select the Fibonacci Tool: Grab the Fibonacci retracement tool from your ChartsWatcher platform.
- Find the Swing Low: Pinpoint the absolute bottom of the recent rally. This is your first click.
- Find the Swing High: Now, find the absolute peak of that same move. This is your second click.
- Click and Drag: You'll click on the swing low first, then drag your mouse up to the swing high and release.
Boom. Your charting software instantly overlays the Fibonacci levels (23.6%, 38.2%, 50%, etc.) between those two points. These horizontal lines are now your potential support zones.
As you can see, the process is all about defining the boundaries of a trend and then applying the key ratios that traders have their eyes on.
Drawing Levels in a Downtrend
When a stock is falling, you just flip the logic. Here, you're measuring the drop to see where a temporary bounce might run out of steam and hit a ceiling.
- Select the Fibonacci Tool: Again, pick the retracement tool from your menu.
- Find the Swing High: This time, start at the absolute peak where the downtrend began.
- Find the Swing Low: Then, identify the bottom of that same downward leg.
- Click and Drag: Click first on the swing high and drag your cursor down to the swing low.
The tool will plot the levels for you. In a downtrend, these lines act as potential resistance areas where sellers could step back in and push the price lower.
Pro Tip: Always draw your tool from left to right across the chart. For an uptrend, that means going from low to high. For a downtrend, you'll naturally go from high to low. Keeping this consistent helps ensure your levels are always plotted correctly.
Building a Trading Strategy with Fibonacci Signals
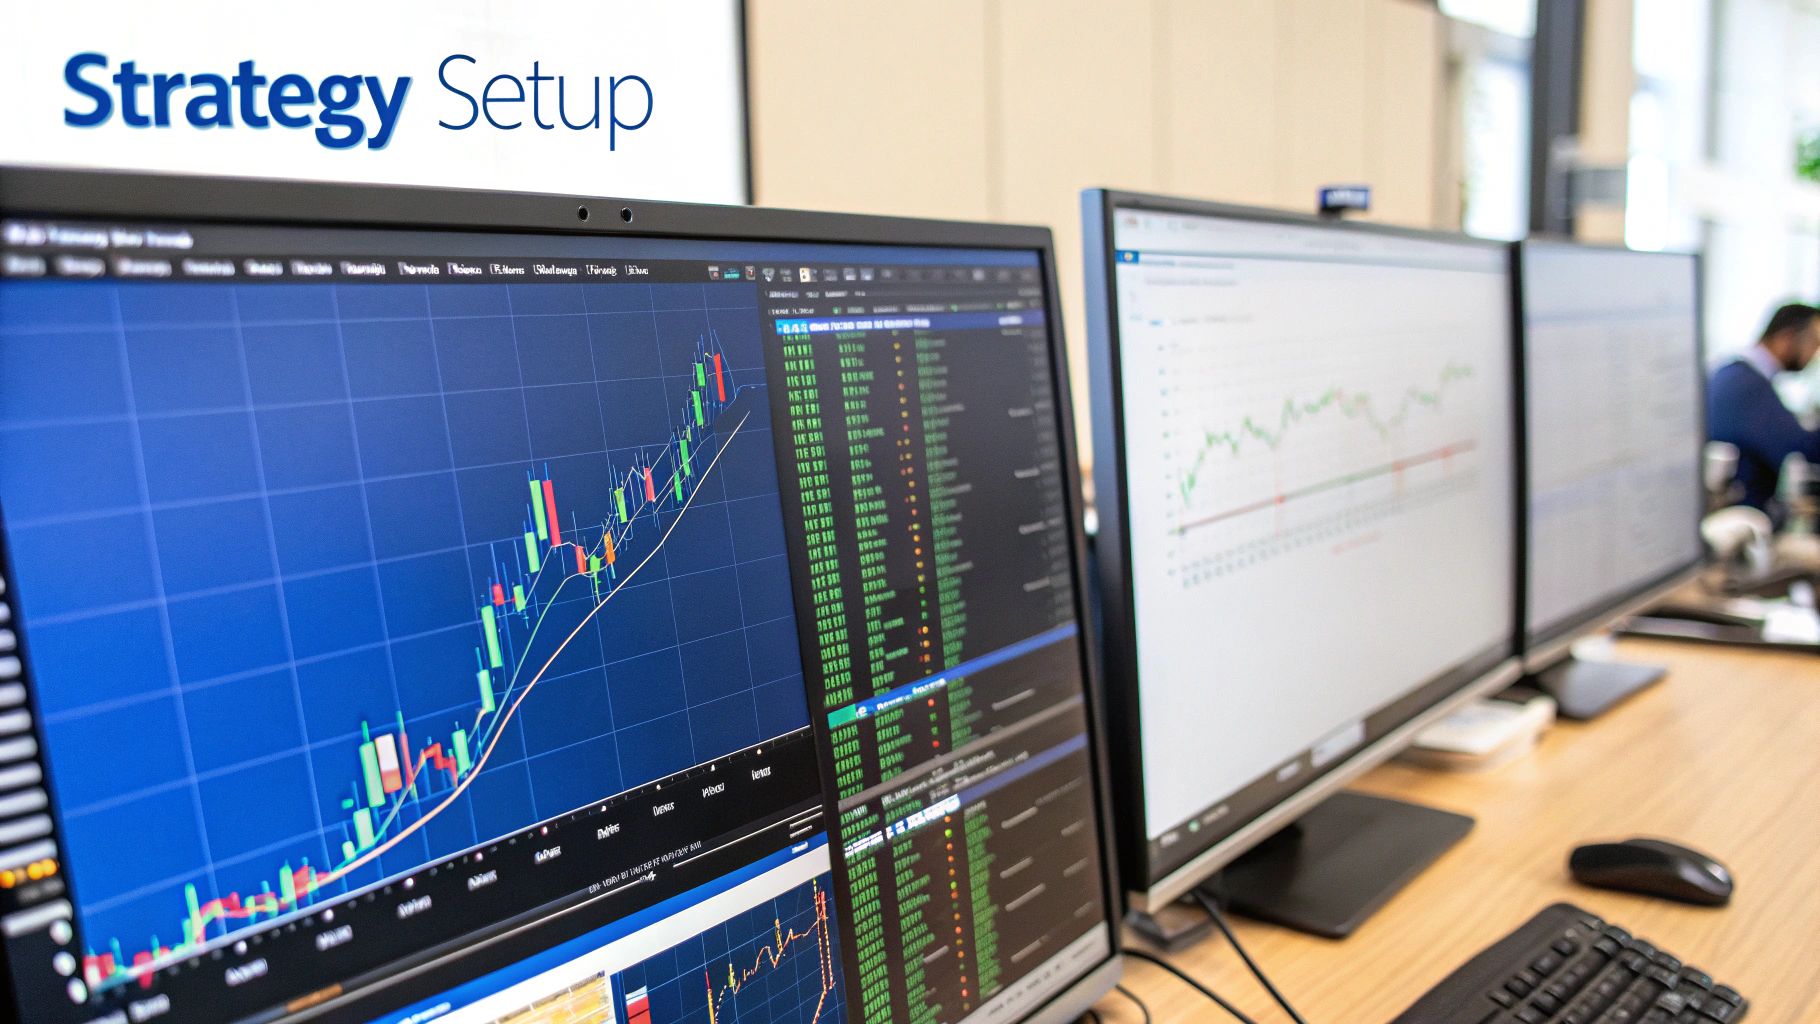
Drawing Fibonacci levels on your chart is just the first step. The real art is turning that analysis into a concrete trading plan—one with clear rules for when to jump in, where to set your safety net, and when to cash out. This is what transforms those lines from interesting observations into an actionable strategy.
A solid strategy built around Fibonacci retracements isn't just about blindly buying at the 61.8% level and hoping for the best. It demands a structured approach to managing risk and confirming your signals. Frankly, this is what separates traders who are consistently profitable from those just guessing.
Setting Your Entry Triggers
Your entry trigger is the specific event that screams, "It's time to get in!" Instead of just placing a buy order right on a Fibonacci level, you need to wait for confirmation that the level is actually holding.
This might be a bullish candlestick pattern, like a pin bar or an engulfing candle, forming right on that support line. Patience here is everything. By waiting for the market to show its hand, you get confirmation that other traders also see that support level and are buying, which stacks the odds in your favor.
Placing Strategic Stop-Loss Orders
Every single trade needs an exit plan for when things go south. A stop-loss order is your financial safety net, no exceptions. When you're using Fibonacci levels, a logical spot for your stop-loss is just below the next key level.
For instance, if you enter a long trade at the 50% retracement, you could place your stop-loss just underneath the 61.8% level. This gives your trade a little room to breathe but makes sure you cut your losses quickly if the support completely breaks down.
The most powerful trade setups often happen at points of confluence. This is where a Fibonacci level lines up perfectly with another technical indicator—think a moving average, a pivot point, or a major trendline. When multiple signals point to the same price zone, it becomes a high-probability area for a market reaction.
Identifying Profit Targets
Just like you plan your entry, you need to plan your exit. This is where Fibonacci extensions come in handy. These are levels projected beyond the original price swing and are perfect for setting profit targets.
The 127.2% and 161.8% extensions are common first and second targets for traders looking to ride a trend's continuation. For those looking to turn these technical analysis skills into a career, exploring high-paying crypto trader jobs can be a lucrative path where this kind of strategic planning is essential. By setting these targets ahead of time, you can take profits systematically instead of letting fear or greed dictate your exit.
Real-World Examples of Fibonacci Trades
Theory is a great starting point, but watching Fibonacci levels work their magic on a live chart is what really makes the concept click. Let's move from abstract ideas to concrete trades by breaking down two classic examples.
These case studies will show you exactly how traders use these levels to spot opportunities in both rising and falling markets. We’ll look at an uptrend to find a perfect "buy the dip" setup and then dissect a downtrend to pinpoint a prime shorting opportunity. The goal here is to turn lines on a chart into a repeatable process you can use yourself.
Example One: Buying the Dip in an Uptrend
Picture a stock that's on a tear, consistently printing higher highs and higher lows. After a powerful move up from $100 (the swing low) to $150 (the swing high), the price finally starts to pull back. This is the moment a trader would grab the Fibonacci retracement tool, drawing it from that $100 low up to the $150 peak.
As the tool plots the key levels on the chart, the trader just watches and waits for the price to find its footing.
- The price slices right through the 38.2% level without much of a fight.
- It then breaks below the 50% level, which might make some traders a little nervous.
- Finally, the stock finds solid ground right at the 61.8% level, which is around $119.
At this "golden ratio," a bullish pin bar candle forms—a clear sign that buyers are jumping back in with force. That’s the confirmation signal. A trader could confidently enter a long position here, placing a stop-loss just below the 78.6% level for protection. The first target would be the previous high of $150, with potential for more. Sure enough, the stock reverses and resumes its uptrend, soaring to new highs.
Example Two: Shorting a Rally in a Downtrend
Now, let's flip the script. Imagine a stock caught in a nasty downtrend. After a steep drop from a swing high of $80 down to a swing low of $50, the price starts a small relief rally—a classic "dead cat bounce." This time, the trader draws the Fibonacci tool from the $80 high down to the $50 low to map out potential resistance zones.
The price rallies past the 23.6% and 38.2% levels. But as it approaches the 50% retracement level at $65, the rally completely stalls out. A bearish engulfing candle appears, signaling that sellers have wrestled back control.
This is a textbook entry for a short trade. The trader could place a stop-loss just above the 61.8% level to keep risk tight. The initial profit target would be the recent swing low of $50. As expected, the stock gets rejected hard from the resistance level and continues its downward spiral.
These examples highlight a key principle: Fibonacci retracements are not just for stocks. Research confirms their application in markets like energy and cryptocurrencies, where levels derived from the golden ratio often mark pivotal reversal points. Read the full research on algorithmic strategies using these levels for more insight.
Beyond individual trades, understanding the broader operational successes within the trading industry can provide valuable context, such as with a custom Salesforce implementation success story in the trading industry. By studying these patterns, you can build a more robust analytical framework.
Common Mistakes That Can Wreck Your Fibonacci Analysis
Fibonacci retracements are a fantastic tool, but like any sharp instrument, you can hurt yourself if you don’t handle them correctly. A lot of traders, especially when they're just starting out, stumble into the same few traps. Knowing what these are is the first step to using Fibs with the kind of precision that actually helps your trading.
One of the most common blunders is drawing your anchor points on tiny, insignificant price wiggles. For your Fibonacci levels to have any meaning, you have to connect them to a clear, major swing high and swing low. If you just slap them on some minor chop, you’ll get a bunch of useless lines that the market will blow right through.
Forcing It on the Wrong Market
Another classic mistake is trying to jam Fibonacci retracements onto a market that’s just going sideways. The tool is built to measure pullbacks inside a trend. If there's no clear uptrend or downtrend, the price is just bouncing around without direction, and your Fib levels will be completely random. Trying to use them here is like trying to navigate a flat, open field with a mountain climbing map—it's the wrong tool for the job.
The single biggest mistake traders make? Treating Fibonacci levels like they're crystal balls that can't be wrong. They are simply areas of probability, not guarantees. A trade should never be taken just because the price hit a Fib level.
At the end of the day, remember that drawing the levels always has a bit of subjectivity. Two different traders might pick slightly different swing points. This is exactly why you must always look for confluence—getting a confirmation from other signals like moving averages, trendlines, or specific candlestick patterns. By sidestepping these common errors and waiting for other indicators to back up your analysis, you build a much more disciplined and effective trading strategy. You turn a simple drawing tool into a real strategic advantage.
Here's the rewritten section, designed to sound like an experienced human expert while preserving all the original information, links, and formatting requirements.
Common Questions I Hear About Fibonacci Trading
As you start weaving this powerful tool into your trading, a few questions always pop up. It's totally natural. Getting a handle on the nuances is what builds real confidence and helps you figure out exactly how Fibs fit into your own strategy.
Let’s tackle some of the most common ones I get asked.
Are Fibonacci Levels Just a Self-Fulfilling Prophecy?
This is a great question, and the honest answer is… it’s a bit of both. There's no denying that a huge part of why these levels work is simply because so many traders are watching them. When a flood of buy orders hits the 61.8% level, that collective action is what creates the support everyone was expecting.
But there's more to it. These ratios show up everywhere in nature, from the spiral of a seashell to the shape of galaxies, hinting at some kind of underlying mathematical order in the universe. Whether you believe in the market's herd mentality or the math of nature, the result is the same: these levels have proven to be a remarkably consistent way to gauge market psychology.
What Is the Best Timeframe for Fibonacci Analysis?
One of the best things about Fibonacci retracements is how well they adapt. The core principles work just as well on a 5-minute chart for a day trader as they do on a weekly chart for a long-term investor. It's a truly versatile tool.
That said, signals on higher timeframes (like daily or weekly charts) generally carry more weight. Think about it: a bounce off a weekly 50% level is a much bigger deal than a quick reaction on a 1-minute chart. It reflects the decisions and capital of far more market participants over a longer period, making it a more significant and reliable signal.
Does Fibonacci Work for All Stocks and Markets?
Fibonacci retracements really shine in markets that have a clear direction—either a strong uptrend or a defined downtrend. The tool is built to measure pullbacks within a trend. So, if you try to apply it to a choppy, sideways market with no clear momentum, it's not going to give you much to work with.
It also tends to be less effective on low-volume, erratic stocks. For the levels to hold any meaning, you need an asset with enough liquidity and trading activity to create those smooth, predictable price waves. Without that, you’re just drawing lines on noise.
Ready to put Fibonacci analysis to work with professional-grade tools? ChartsWatcher gives you the advanced charting and scanning you need to spot high-probability setups with precision. Start making more informed trading decisions today by exploring our features.
