A Trader's Guide to Stock Support Resistance
Stock support and resistance are simply price levels on a chart that a stock struggles to break through. Think of support as a price floor where buyers have historically stepped in, and resistance as a price ceiling where sellers tend to take over. Getting a handle on these levels is absolutely fundamental to technical analysis.
Decoding the Battle Lines of the Market
Imagine a stock's price is like a tennis ball in a match. The ground is the support level—a point where the ball consistently bounces back up. The highest point a player can smash the ball before gravity pulls it back down is the resistance level—a ceiling that's tough to punch through. In trading, these aren't physical barriers, but they might as well be. They're powerful psychological lines etched into the market's collective memory.
These concepts are way more than just lines on a chart; they show you the constant tug-of-war between two core market forces: demand (buyers) and supply (sellers).
- Support The Demand Zone: This is a price area where buyers start seeing real value and get more aggressive. As the price drops to this level, demand kicks in, soaking up all the selling pressure and causing the price to "bounce" back up.
- Resistance The Supply Zone: This is a zone where sellers feel the stock is getting a bit pricey and start cashing in their profits. As the price climbs toward this ceiling, the supply of shares for sale swells, overwhelming the buyers and pushing the price back down.
The Psychology Behind the Price Levels
At the end of the day, support and resistance are just visual maps of market psychology. They exist because traders have memories. If a stock consistently fails to break above $50, traders remember that. The next time it approaches that level, they're much more likely to sell, which just reinforces $50 as a resistance point. It's a classic self-fulfilling prophecy, where shared belief becomes market reality.
Historical price data reveals that specific price levels repeatedly act as psychological barriers, where demand and supply dynamics change markedly. These are fundamental concepts used worldwide to anticipate price movements in stock markets.
Why It Matters for Your Trading
Knowing where these battle lines are drawn gives you a foundational map for navigating the market. It helps you anticipate potential turning points where a trend might hit the brakes or even reverse. Support levels can flag great moments to consider buying, while resistance levels highlight areas to think about selling or taking profits.
This knowledge is the first step from just watching prices wiggle around to actually understanding the story the chart is telling. As you can learn in this analysis of identifying price levels, historical data consistently shows support levels acting as price floors and resistance as ceilings.
How to Find Key Levels on Your Charts
Spotting potential support and resistance zones is what turns a messy, confusing chart into a strategic map for your trades. It might look complicated at first, but honestly, it all starts with simple visual analysis. You're basically hunting for spots in a stock's history where the price has repeatedly stalled out or turned around.
The most direct way to do this is by connecting the dots. Find at least two major peaks (highs) or valleys (lows) that sit at roughly the same price level, then draw a horizontal line to connect them. A line linking multiple lows creates a potential support floor, while one connecting multiple highs marks a potential resistance ceiling.
The more times the price has bounced off that line, the more significant traders consider that level to be.
This chart shows a great example of how candlestick patterns often respect and bounce right off a well-defined support level.
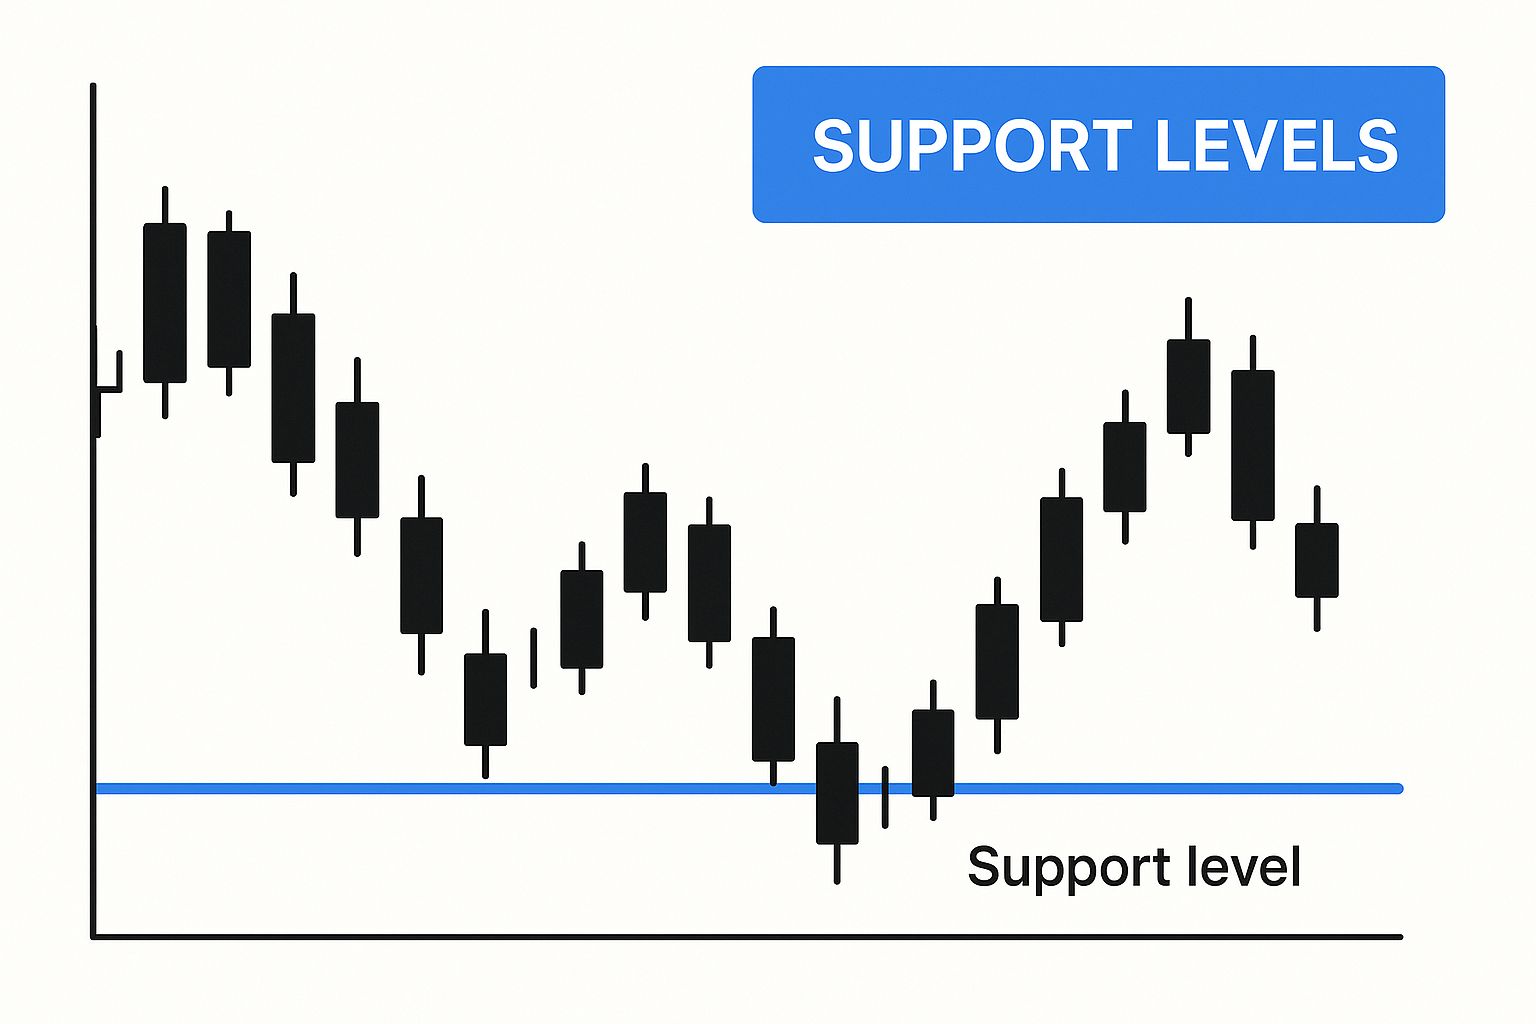
You can see how that horizontal line, once established, acts as a clear floor where buying pressure consistently steps in to overpower the sellers.
Identifying Levels Without Drawing Lines
While those simple horizontal lines are fundamental, they're not the only tool in the shed. Plenty of other methods can give you dynamic or psychologically important levels that add much-needed depth to your analysis. Getting a handle on these is a key part of learning how to analyze stock charts like a pro.
Here are a few other popular methods to add to your toolkit:
- Moving Averages: These indicators smooth out price action and often act as dynamic support or resistance. In an uptrend, for example, a stock might consistently pull back to its 50-day moving average before bouncing higher, turning that indicator into a moving support line.
- Trendlines: When a stock is moving in a clear direction, you can draw diagonal lines. Connect the higher lows in an uptrend to create a support trendline, or connect the lower highs in a downtrend to form a resistance trendline.
- Psychological Numbers: The market is made up of humans, and humans love round numbers. A stock might struggle to break above $50 or $100 simply because those levels feel significant to traders, creating natural resistance points out of thin air.
Before we combine these, let's quickly summarize the most common ways traders find these critical price zones.
Common Methods for Identifying Support and Resistance
| Method | Description | Best For |
|---|---|---|
| Horizontal Lines | Connecting historical highs or lows at the same price. | Identifying clear, static price levels that have acted as barriers in the past. |
| Moving Averages | Using indicators like the 50-day or 200-day MA. | Finding dynamic support/resistance that moves with the price in a trending market. |
| Trendlines | Drawing diagonal lines connecting higher lows or lower highs. | Defining the boundaries of an ongoing uptrend or downtrend. |
| Psychological Levels | Focusing on big, round numbers (e.g., $50, $100). | Spotting potential turning points based purely on market psychology. |
Each of these methods provides a different lens through which to view the market's structure. While powerful on their own, their real strength is unlocked when they start to overlap.
Putting It All Together
The most powerful support and resistance levels are the ones confirmed by multiple methods at once. This is what traders call "confluence."
Imagine a scenario where a stock's historical support at $98.50 also lines up perfectly with its rising 200-day moving average, and it's sitting just below the big psychological number of $100. This confluence of signals creates a much stronger and more reliable support zone than any single indicator could on its own.
By layering these different techniques, you start to build a comprehensive picture of the market landscape. This multi-layered approach helps you pinpoint the most critical price zones—the places where the battle between buyers and sellers is likely to be the most intense. And that gives you a much clearer edge.
The Market Psychology Driving These Levels
It’s easy to look at support and resistance levels as just lines on a chart, but they’re much more than that. They are the visible footprint of human emotion. These price barriers aren’t cooked up by some fancy algorithm; they are built by the collective psychology of millions of traders acting on two of the market’s most powerful forces: fear and greed.
Getting a handle on these emotional currents is what separates basic chart-reading from truly insightful market analysis. At its core, the market has a memory. Traders remember past price points where big moves happened, and these memories shape their future decisions, often creating a self-fulfilling prophecy.
The Emotional Rollercoaster at Resistance
Let's imagine a stock runs up to $110 and then takes a nosedive back to $90. Right away, three distinct groups of traders are now watching this stock, and each one's emotional state helps solidify $110 as a resistance level.
-
The Remorseful Buyers: Anyone who bought at or near the $110 peak is now underwater and kicking themselves. As the price starts creeping back toward $110, their only goal is to get out at breakeven. They place their sell orders right where they bought in, creating a wall of supply.
-
The Relieved Sellers: Traders who sold at $110 the first time are feeling pretty smart. If the price gives them another shot at that level, they see it as a golden opportunity to sell high again, adding even more downward pressure.
-
The Patient Shorts: The traders who shorted the stock at $110 cashed in on the way down. They now view that level as a proven ceiling and are likely waiting to open new short positions if the price gets close to it again.
All three of these groups are piling their sell orders around the exact same price point, which is what gives resistance its strength.
At its heart, a resistance level is a psychological barrier where traders collectively believe an asset is overvalued. This shared sentiment creates selling pressure that can halt or reverse an uptrend.
The Fear and Greed Driving Support
The exact same psychological forces just work in reverse to create a support level. Picture that same stock bouncing hard off the $90 mark. As the price drops back toward this level, a whole new set of emotional reactions comes into play.
Buyers who missed that first bounce are now dealing with a serious case of FOMO (fear of missing out). They see this as a second chance to buy the stock "on sale." Meanwhile, those who bought at $90 and made money feel validated and are ready to buy more, reinforcing their winning decision.
This creates a powerful zone of demand. When you understand the human behavior behind stock support resistance, you can look at a chart and not just see lines, but see the story playing out between buyers and sellers. It gives you a much better feel for the strength of these levels and helps you anticipate how the market might react.
Practical Trading Strategies You Can Use
Spotting support and resistance levels is one thing, but actually turning that analysis into a profitable trade? That’s where the real skill comes in. Once you've mapped out the key price zones on a chart, you can stop guessing and start executing structured, risk-managed strategies.
Let's walk through two powerful approaches built on the foundation of stock support and resistance. These aren't just theories; they provide clear rules for when to get in, where to place your stop-loss to protect your capital, and how to set logical profit targets.

Strategy 1: The Range Trading Approach
Range trading is tailor-made for markets that are stuck in a sideways grind, bouncing between a well-defined support floor and a resistance ceiling. Think of it like a game of ping-pong. Your job is to buy when the price hits the bottom of the range and sell when it gets to the top.
This strategy shines when a stock is in a consolidation phase, without a clear long-term uptrend or downtrend. The boundaries of the range become your action points.
- Entry Signal: Look to buy when the price nears the support level and shows signs of bouncing higher, like a bullish candlestick pattern forming.
- Stop-Loss Placement: Set your stop-loss order just below that support level. If the price breaks through this floor, your trade idea is proven wrong, and you get out with a small, manageable loss.
- Profit Target: Your main goal is to take profits just below the resistance level at the top of the range.
This methodical system keeps emotional decision-making out of the picture and gives you a clear risk-to-reward framework for every single trade.
Strategy 2: The Breakout Trading Method
While range trading is all about profiting from containment, breakout trading is about capitalizing on the escape. This is an exciting strategy where you enter a trade the moment a stock’s price smashes decisively through a key support or resistance level, signaling the potential start of a big new trend.
A breakout happens when a stock price moves beyond a defined support or resistance level, often signaling a major shift in market sentiment. Volume is a huge confirming factor; trading volumes often jump by an average of 30-40% on breakout days, showing that a lot of traders are piling in.
That surge in volume is your confirmation that the breakout has real momentum behind it—it's not just random market noise. It shows there’s real conviction driving the move.
Confirming a Real Breakout from a Fakeout
The biggest headache for a breakout trader is the dreaded "fakeout"—when the price pokes through a level only to snap right back. The best way to avoid this trap is to demand confirmation, and trading volume is your most reliable ally here. A genuine breakout should always come with a significant spike in volume.
Here's a simple checklist to follow for a breakout trade:
- Identify a Strong Level: Find a support or resistance level that the market has tested multiple times. The more tests, the more significant the level.
- Wait for the Break: Don't jump the gun. The price needs to close decisively above resistance or below support. A quick wick poking through the level isn't enough.
- Confirm with Volume: Look for a surge in trading volume that is well above its recent average. This step is absolutely critical.
Once you have these three pieces in place, you’ve got a high-probability entry signal. Of course, smart trading goes beyond just chart analysis. It's also about managing your overall financial picture, which includes looking into tax saving tips for investors to maximize what you keep.
For a deeper dive into these practical applications, our comprehensive guide on building a support and resistance trading strategy has even more detail.
Taking Your Analysis to the Next Level
Once you’ve got a handle on drawing your own lines and spotting those key psychological zones, it's time to explore the more advanced techniques that give modern traders an edge. These tools don't just confirm what you see; they add a layer of objectivity and automation to your stock support resistance analysis, helping you find levels you might have missed on your own. This is where you graduate from a manual process to a more data-driven approach.
One of the most powerful and reliable concepts in all of technical analysis is role reversal. Think of it like a battlefield where territory changes hands. Once a resistance ceiling is broken with conviction, the whole dynamic flips. That old ceiling, which was a wall of sellers, often becomes the new support floor—a fresh zone of demand where buyers step in.
The same thing happens in reverse. When a support level gives way, it frequently becomes the new resistance. Traders who bought at the old support are now desperate to sell at that same price just to get their money back, creating a new supply zone. This is a fundamental principle because it proves how past price action continues to shape future market behavior.
Automating Level Identification
While drawing lines by hand builds crucial charting skills, automated tools can give you objective, pre-calculated levels that take the guesswork out of the equation. They’re based on pure math, applying formulas to historical price data to deliver a consistent framework for finding potential turning points.
Two of the most popular automated tools you'll see are:
- Fibonacci Retracements: This tool maps out potential support and resistance by calculating key percentage pullbacks between a major high and low. The levels traders watch like hawks are 38.2%, 50%, and 61.8%. You'll use these to anticipate exactly where a stock might stop falling and turn back around.
- Pivot Points: Calculated from the previous day's high, low, and close, Pivot Points give you a ready-made map of support (S1, S2, S3) and resistance (R1, R2, R3) levels for the current trading day. Day traders and other short-term operators live by these for setting their entries, stops, and profit targets.
A broken resistance level that becomes new support is more than just a pattern on a chart; it's a clear signal that market sentiment has fundamentally shifted. Buyers who were once scared off have now seized control and are actively defending their new ground.
The Future of Support and Resistance Analysis
The next frontier for identifying these critical zones is already here, driven by machine learning and artificial intelligence. Algorithms are now being trained to sift through massive datasets, spotting complex patterns completely invisible to the human eye. This is shifting stock support resistance analysis from a reactive art into a predictive science.
For example, sophisticated models can now forecast these price levels with startling accuracy. One of the most promising approaches uses a Long Short-Term Memory (LSTM) neural network—a type of AI known for its skill in predicting sequences—and combines it with Fibonacci levels. As some groundbreaking research shows, these models can anticipate support and resistance zones far more effectively than old-school statistical methods.
You can dive into the findings of this innovative research on how AI predicts price levels yourself. It offers a fascinating glimpse into the future of trading, where tools integrated into platforms like ChartsWatcher will provide traders with powerful, forward-looking insights.
Common Questions About Support and Resistance
Even after you get the hang of support and resistance, a few questions always seem to pop up. That’s perfectly normal. These levels aren't set in stone; they're dynamic, and clearing up the gray areas is what separates struggling traders from confident ones.
Let's dive into some of the most common questions I hear from traders. Getting these answers straight will help you go from just knowing the theory to actually using these concepts to make better trades.
How Reliable Are These Levels, Really?
Think of support and resistance as zones of high probability, not unbreakable iron walls. They're not guarantees, but their reliability shoots up when other technical signals line up at the same price—a powerful concept called confluence. For instance, a known support level gets a whole lot stronger if the 200-day moving average is sitting right there with it.
The more times a level gets tested and holds, the more traders start paying attention to it, which reinforces its strength. But no level lasts forever. Breakouts are a natural part of the market cycle, which is exactly why you should always use a stop-loss.
A support or resistance level is just a reflection of market psychology. Its strength isn't absolute; it's constantly being tested by the collective tug-of-war between buyers and sellers. Always be prepared for it to break.
What Is the Difference Between Minor and Major Levels?
The biggest difference between minor and major levels boils down to timeframe and significance. They tell different stories about the market's movements, and knowing which one you're dealing with is key to getting your strategy in sync with the bigger picture.
- Major Levels: These are the big ones. You'll spot them on longer-term charts, like the weekly or monthly, and they represent massive turning points in the stock's primary trend. When a major level breaks, it's a huge deal and can signal a real, long-term shift in market direction.
- Minor Levels: These are the smaller ripples within the larger ocean. They show up on daily or intraday charts and are perfect for short-term trades or for fine-tuning your entries and exits. They don't have nearly the same impact on the stock's overall trajectory as the major levels do.
What Happens When a Level Finally Breaks?
When a key level gives way, it’s one of the most powerful signals a chart can give you. It’s a clear sign that the balance of power between buyers and sellers has shifted decisively. The side that was holding the line has lost control.
If the price punches cleanly through resistance, it means the buyers have overwhelmed the sellers. That’s a bullish signal, and the path of least resistance is now upward. And in a cool twist, that old resistance ceiling often becomes the new support floor—a classic concept known as role reversal.
On the flip side, a break below support tells you the sellers have taken charge and the price is likely headed lower. That broken support floor will then frequently act as a new ceiling of resistance on any attempts to rally back up.
Ready to stop guessing where key levels are? ChartsWatcher provides powerful scanning and charting tools that automatically identify critical support and resistance zones, giving you a clear, actionable map of the market. Discover how ChartsWatcher can sharpen your trading edge today.
