Support Resistance Trading Strategy: Real Profits Guide
Why Certain Price Levels Control Your Trading Success
Have you ever watched a stock's price hit an invisible ceiling and retreat, or find a solid floor just when it seemed like it would never stop falling? It’s not random. This behavior is driven by the collective psychology of traders, and it's the foundation of any support resistance trading strategy. Once you grasp why these levels form, you can start using them to your advantage.
These levels become powerful because a huge number of traders, from small retail accounts to massive financial institutions, are all watching the same historical price points. Think of a stock that has repeatedly failed to push past $50. Traders start to expect it to fail there again. They place sell orders around that price, creating a "ceiling," or what we call a resistance level. It's a self-fulfilling prophecy where the shared belief in the barrier actually creates the barrier.
The Psychology of Buyer's Remorse and Seller's Relief
Emotions are a huge driver at these key levels. Let’s say you buy a stock at $45, but it immediately drops to $40. You're instantly filled with buyer's remorse, thinking, "If this thing just gets back to $45, I'm selling to get my money back." Now, imagine thousands of other traders bought at the same price and feel the exact same way. Their combined sell orders create a wall of supply right at $45, forming a tough resistance level.
On the flip side, what about traders who missed out on a stock that rocketed from $30 to $60? They are kicking themselves with the fear of missing out (FOMO) and promise, "If it ever drops back to $30, I'm not missing it this time." This collective desire to buy at that price creates a "floor," or support level, where buying demand is strong enough to halt a decline.
Understanding Market Sentiment at Key Levels
This is the essence of technical analysis.
- Support is a price zone where a falling stock tends to attract enough buyers to stop the drop.
- Resistance is a price zone where a rising stock meets enough sellers to stall its climb.
We find these levels by looking at a chart's history and seeing where the price has reversed multiple times. A big mistake many traders make is seeing these levels as exact, razor-thin lines. In reality, they are zones of conflict. A price might poke slightly above a resistance level or dip just below support before reversing.
Pay close attention to how the price behaves. A strong level will often see a quick, sharp rejection. In contrast, if the price starts lingering around a level, testing it repeatedly with smaller and smaller pullbacks, it could be a sign that the level is about to break. Learning to read these subtle cues in price action is what separates traders who profit from these levels from those who get caught in false moves.
Finding The Levels That Actually Matter
I've seen countless traders plaster their charts with dozens of lines, turning a clean price chart into a Jackson Pollock painting. The secret isn't to mark every tiny peak and valley. Instead, you need to identify the price zones that have real weight—the ones where big money is making decisions. A successful support resistance trading strategy is built entirely on the quality of the levels you choose, so let's cut through the noise and find what actually works.
Think in Zones, Not Exact Prices
One of the biggest hurdles for traders is treating support and resistance like a brick wall at an exact price. If you set a sell order precisely at a $100.00 resistance line, you're setting yourself up for frustration when the price tops out at $99.85 and reverses without you. Professionals don't see single lines; they see zones of conflict. These are areas where the tug-of-war between buyers and sellers gets heated.
For instance, instead of just marking $100 as your line in the sand, you might identify a resistance zone from $99.75 to $100.50. This buffer accounts for the natural ebb and flow of market orders and helps you avoid getting shaken out by minor price wiggles. When the price pokes into this zone and gets slapped back down, that’s a much more powerful signal than a simple touch of an arbitrary line.
Pinpointing High-Probability Levels
So, how do we find these all-important zones? Your best starting point is with the major swing highs and swing lows on your chart. These are the obvious turning points where a trend lost steam and reversed. Historically, these levels have been critical in financial markets, acting as psychological barriers that influence price. A swing high marks a peak before a decline, while a swing low is a trough before a rebound. You can dive deeper into how professionals use these pivots by exploring the historical context of support and resistance on Pepperstone.
Here are a few practical tips I personally use to confirm if a level is worth watching:
- Look for Multiple Touches: The more times a price level has been tested and has held its ground, the more significant it becomes. A level that has flipped from support to resistance (or vice-versa) is especially potent.
- Check Higher Timeframes: A key level on the daily chart carries much more weight than one on a 5-minute chart. I always start my analysis on a higher timeframe, like the daily or weekly, to map out the major battlegrounds. Only then do I zoom into smaller timeframes to fine-tune my entries.
- Analyze Volume: Pay close attention to volume when the price approaches a key level. A big spike in volume as the price is rejected from a zone confirms that large institutions are actively defending it. This gives you much more conviction in the trade.
Decoding Price Action at Critical Moments
Finding strong support and resistance zones is a great start, but the real magic happens when you interpret what the market is telling you as the price arrives. A perfectly drawn line on your chart doesn't mean much unless you can read the subtle clues in the price action. This is what separates a basic approach from a durable support resistance trading strategy—it’s about moving beyond just drawing lines to truly understanding market behavior.
Gauging Momentum and Market Strength
Think of it like a car approaching a wall. If it smashes into it at 100 mph and bounces right off, you know that's a solid wall. But what if the car just slowly rolls up and starts nudging it over and over? You'd start to question the wall's strength. Price action is very similar. A sharp, high-speed move into a resistance level followed by an immediate, forceful rejection is a strong sign the level is being defended.
On the other hand, if the price lazily drifts toward a support level and then starts hovering just above it, pressure might be building for a breakdown. This is why watching how the price behaves is crucial for good market timing. For instance, a series of higher lows pushing into a static resistance line often shows that buying pressure is building, which could lead to a breakout. You can learn more about these kinds of market timing patterns on MindMathMoney.com.
Candlesticks and Volume: Your Truth Detectors
When you're trying to figure out what's happening at these critical price points, candlesticks and volume are your best tools. They give you the context that a simple line on a chart can't.
- Rejection Wicks: Look for candles with long wicks at key levels. A long upper wick at resistance (like a Pin Bar) tells you buyers tried to push higher but were slammed back down by sellers. It’s a classic rejection signal.
- Engulfing Patterns: A massive bearish candle that completely swallows the previous bullish one right at resistance is a powerful sign of a reversal. It shows a sudden, dramatic shift in power from buyers to sellers.
- Volume Spikes: Always keep an eye on the volume bars. A big spike in volume as price is rejected from a level adds serious weight to the signal. It suggests that major market participants are actively defending that price zone, giving you more conviction for a potential trade.
Learning to tell the difference between a real reversal and a simple pause is a core trading skill. To see more detailed examples, check out our comprehensive guide on price action trading strategies. When you combine solid level analysis with these real-time clues, you can avoid getting caught in false moves and find more high-quality trading setups.
Turning Analysis Into Profitable Trades
Spotting a great level is one thing; making money from it is another game entirely. The gap between identifying solid support or resistance and actually executing a profitable trade is where many aspiring traders stumble. It isn't just about drawing lines—it’s about having a clear plan for when to pull the trigger. Let's bridge that gap with some proven execution methods for your support and resistance trading strategy.
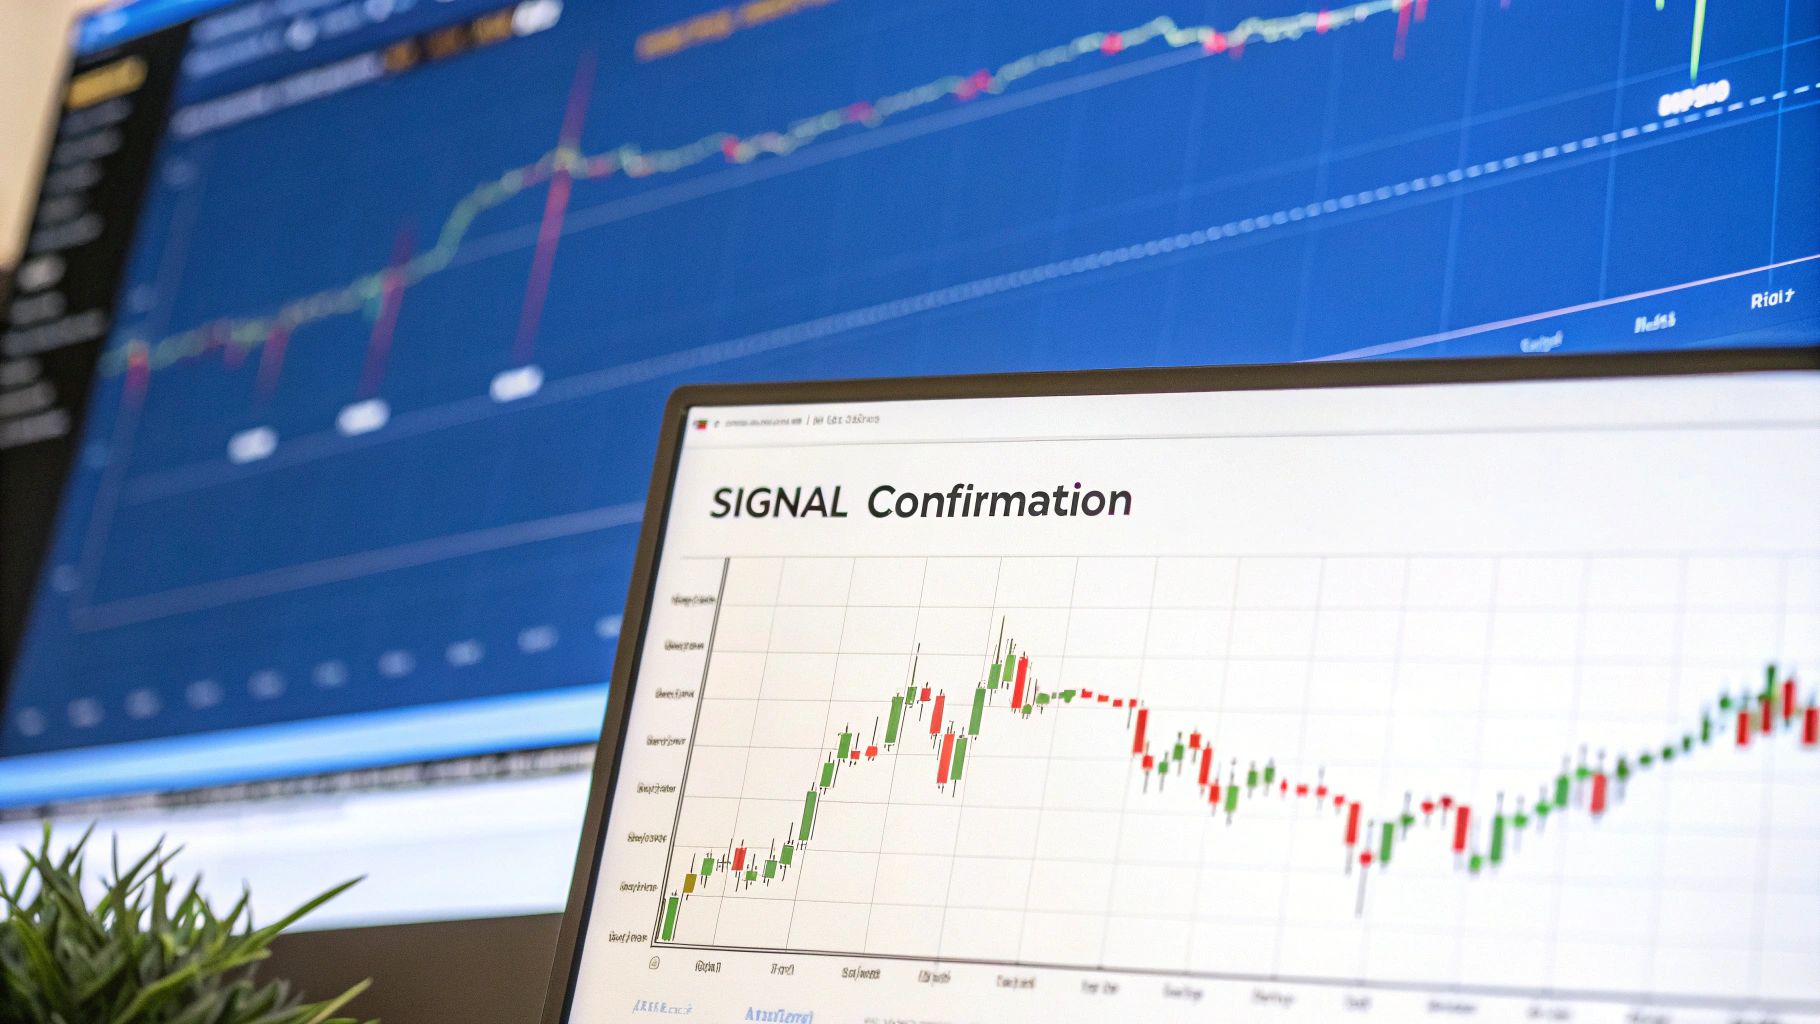
This simple workflow visualizes the core process: identifying your level, waiting for a confirmation signal, and then executing the trade with predefined risk parameters.
Following this sequence brings structure to your trading, helping you move from a reactive to a proactive mindset.
Entry Techniques: From Conservative To Aggressive
Your entry technique should match your risk tolerance. A more conservative approach is the bounce play. Here, you wait for the price to hit your level and show clear signs of rejection—like a strong rejection candle—before you enter. This offers a higher probability of success because you have confirmation the level is holding.
For example, if a stock hits a $50 resistance and forms a prominent bearish engulfing candle, you could enter a short position, placing your stop-loss just above the candle's high. This method prioritizes safety over capturing the absolute peak of the move.
On the other hand, an aggressive approach involves a breakout strategy. This is for capturing major momentum moves when a level finally breaks. Here, you'd place a buy-stop order just above a key resistance level or a sell-stop order just below support. When the price breaks through, your order is triggered automatically.
The risk is higher—you could get caught in a "fakeout"—but the reward potential is significant if you catch the beginning of a new trend. The key is to see increased volume on the breakout, which confirms genuine momentum.
To better understand these different approaches, the table below compares various strategies for trading support and resistance. It breaks down entry methods, risk profiles, and typical time horizons to help you see which one fits your personal trading style.
| Strategy Type | Entry Method | Risk Level | Time Horizon | Success Rate |
|---|---|---|---|---|
| Bounce (Conservative) | Wait for rejection candle at S/R level | Low to Moderate | Short-Term (Intraday/Swing) | High |
| Breakout (Aggressive) | Enter on a break of the S/R level | High | Medium to Long-Term | Moderate |
| Breakout & Retest | Wait for price to break and retest the level | Moderate | Short to Medium-Term | High |
| Zone Fading | Shorting at resistance, buying at support | Moderate | Short-Term | Varies |
This table shows there's no single "best" way to trade these levels. A conservative trader might prefer the higher success rate of a bounce play, while a momentum trader might accept the higher risk of a breakout for greater potential reward.
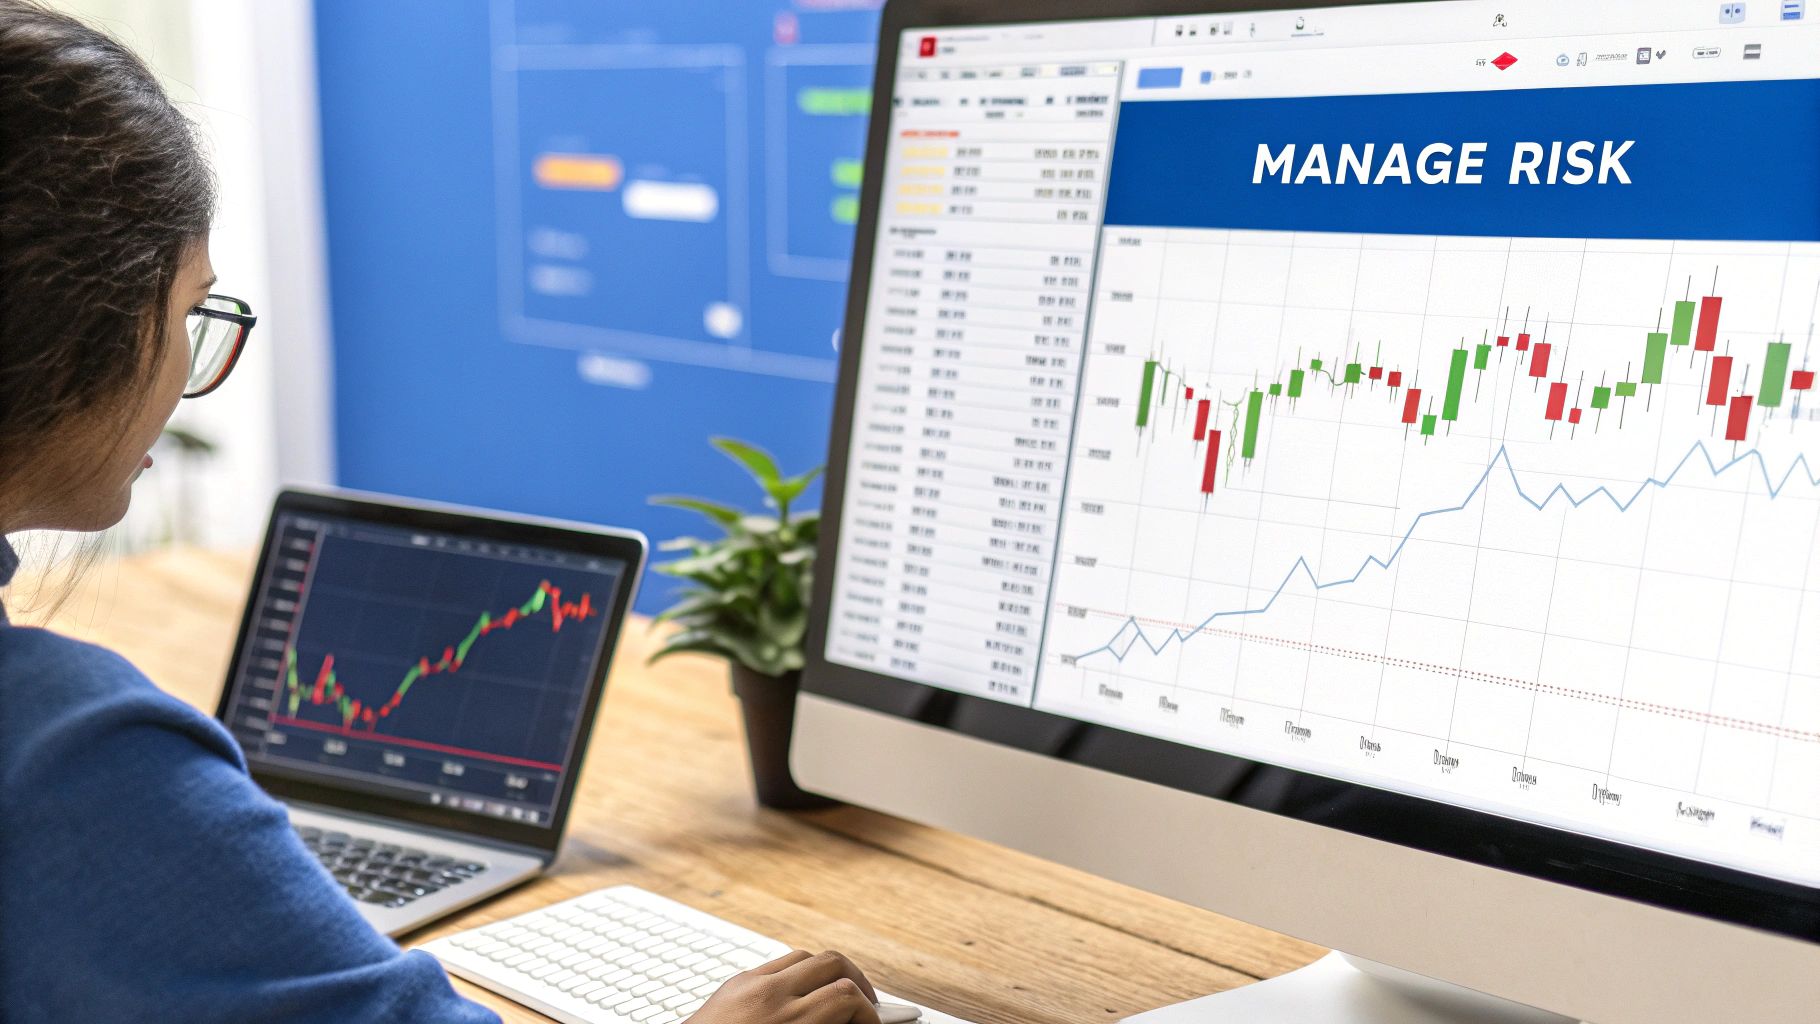
Protecting Capital and Sizing Your Position
No strategy is complete without airtight risk management. Your stop-loss placement is non-negotiable. For a bounce trade, a logical stop is just beyond the rejection candle or the support/resistance zone itself. For a breakout, the stop could go back on the other side of the broken level, assuming it will now act as a new floor or ceiling.
Position sizing is equally crucial. A common rule is to never risk more than 1-2% of your trading capital on a single trade. For instance, with a $10,000 account, a 1% risk is $100. If your trade setup requires a $1 stop-loss per share, you can buy 100 shares ($100 risk / $1 stop-loss).
This mathematical approach removes emotion and ensures no single bad trade can wipe you out, allowing you to survive long enough for your edge to play out.
Professional Techniques For Consistent Results
Ready to take your support and resistance trading strategy from the beginner level to something more dependable? To find consistency, you need to move past simply drawing lines on a chart and start thinking in layers. This means looking for high-probability setups where multiple technical factors all point to the same conclusion, creating what traders call confluence zones. Think of these as the market's "perfect storm" moments, where the evidence for a trade becomes hard to ignore.
Let's paint a picture. You've identified a clear horizontal resistance level on the daily chart where the price has been rejected before. That's a decent start. But what if a key Fibonacci retracement level and the widely watched 200-period moving average also converge at that exact same price? That's a confluence zone. A rejection from this area is much more significant than one from a standalone line. Using a tool like ChartsWatcher, you can easily overlay these different forms of analysis to make these powerful zones pop out on your chart.
Enhancing Levels With Volume Profile
Another powerful method pros use is volume profile analysis. This isn't your standard volume-at-the-bottom-of-the-chart indicator. Instead, a volume profile is displayed horizontally across your price chart, showing you exactly where the most trading volume has occurred. It reveals the price levels that big institutions and other major market players have paid the most attention to.
A High-Volume Node (HVN) is a key feature of the volume profile. It acts like a price magnet, often forming strong support or resistance because so much business was conducted there in the past. When you find a key support or resistance level that aligns perfectly with an HVN, your confidence in that level should increase dramatically. It's a clear signal that a major battle between buyers and sellers previously took place, and that area is likely to be defended fiercely again.
To build a solid foundation for your analysis, it's helpful to combine several trusted indicators. The table below outlines some essential tools and their optimal settings for identifying strong support and resistance zones.
| Indicator | Purpose | Timeframe | Key Settings | Signal Strength |
|---|---|---|---|---|
| Volume Profile | Identify High-Volume Nodes (HVNs) that act as price magnets. | Daily, 4-Hour | Session or Visible Range | High |
| Moving Averages | Provide dynamic support/resistance (e.g., 50 & 200 EMA). | Daily, 4-Hour | 50 EMA, 200 EMA | Medium to High |
| Fibonacci Retracement | Pinpoint potential reversal levels based on key ratios. | Drawn on recent major swings | 0.50, 0.618, 0.786 levels | Medium |
| Pivot Points | Show classic support and resistance levels based on prior day's data. | Daily for intraday charts | Standard (Classic) | Medium |
| RSI (Relative Strength Index) | Confirm overbought/oversold conditions at key levels. | Matches chart timeframe | 14-period, 70/30 levels | Confirmatory |
This table serves as a great starting point for building a multi-layered analytical approach. The goal isn't to use every indicator on every trade, but to find confluence where two or three of these tools point to the same price area, significantly strengthening your trade thesis.
Advanced Position Management
Finally, making money in trading isn't just about finding good entries; it's about how you manage the trade once you're in it. Profitable traders don't just "set it and forget it." They actively manage their positions to maximize gains and minimize risk.
Here are a few tactics to consider:
- Scaling In: Instead of jumping in with your full position size at once, try entering with a smaller piece when the price first touches your level. If the price action confirms the reversal, you can add to your position with more confidence.
- Dynamic Stop Loss: Don't let a winning trade turn into a loser. As a trade moves in your favor, trail your stop-loss order. For a long trade, you could move it up just below recent swing lows to lock in profits and protect your downside.
- Strategic Profit-Taking: Rather than aiming for one big home-run target, consider taking profits in stages. For example, you could sell one-third of your position when you reach a 1:1 risk/reward ratio, another third at 2:1, and let the final piece run with a trailing stop. This strategy helps you consistently bank profits while still giving you a shot at a much larger gain.
Protecting Capital While Maximizing Gains
Finding high-probability support and resistance levels is a great start, but it's only one piece of the trading puzzle. What really separates consistently profitable traders from those who struggle is their dedication to risk management. A successful support resistance trading strategy isn't just about picking the right entry; it's about protecting your account so you can show up to trade another day. This means ditching the "gut feelings" and adopting a strict, disciplined approach to every position you take.
Before you even think about hitting the "buy" or "sell" button, your first job is to define your risk. This all begins with your stop-loss.
Setting Intelligent Stop Losses
A classic mistake many traders make is setting their stop-loss way too close to their entry point just to minimize the dollar amount at risk. This is a recipe for frustration, as you'll often get knocked out of a perfectly good trade by normal market fluctuations before it has a chance to play out. Your stop-loss shouldn't be arbitrary; it needs to be placed at a logical level where your original trade idea is clearly invalidated.
Imagine you see a stock bounce firmly off a key support zone and you decide to go long. A smart stop-loss would be just below the low of that rejection candle or slightly underneath the entire support area. This approach respects the market's structure and gives the trade some breathing room. In contrast, putting it just a few pennies below your entry is practically asking to get stopped out.
Position Sizing and Capital Preservation
Once you’ve figured out where your stop-loss will go, you can determine your position size. This is the real secret to weathering losing streaks, which are a guaranteed part of trading for everyone. A solid rule of thumb is to only risk a small percentage of your trading capital, typically between 1% and 2%, on any single trade.
Let's walk through a quick scenario:
- Account Size: You have a $25,000 account.
- Risk per Trade (1%): You're willing to risk $250 on this trade.
- Trade Idea: You want to buy a stock at $50.00 after it bounced off support, with your logical stop-loss set at $49.00.
- Risk per Share: The distance from your entry to your stop is $1.00 ($50.00 - $49.00).
- Position Size: Your position size would be 250 shares ($250 total risk / $1.00 risk per share).
Following this simple math ensures that even a string of five straight losses won’t do serious damage to your account. This discipline is what builds a foundation for a long-term trading career. If you want to explore this topic further, we have a complete guide on mastering day trading risk management that dives much deeper. Always remember, your number one job as a trader is to protect your capital.
Building Your Trading Success Framework
Let's move beyond theory and build a practical system you can actually use. A solid support and resistance trading strategy isn't just about drawing lines on a chart; it's about creating a repeatable process for every single trade. This framework becomes your professional checklist, the thing that keeps you disciplined when market chaos and emotions are running high. Think of it as your pre-flight check before you commit any capital.
Your Pre-Trade Checklist
Before you even dream of hitting that buy or sell button, you need to run through a few critical checks. This isn't busywork; it's the mental model that will keep you grounded and focused on high-probability setups, filtering out the noise.
-
How strong is the level? First, zoom out. Is the support or resistance zone obvious on a higher timeframe, like the daily or 4-hour chart? A level that's clear on multiple timeframes is much more significant. Also, how many times has it been tested? A freshly established level might act differently than one that has been respected multiple times. Look for confluence, too—does the level line up with a moving average or a key node from a volume profile analysis?
-
What is the price action telling you? A level is just a line in the sand until the market confirms it. Never enter a trade simply because the price has arrived at your zone. Wait for the market to give you a clear signal. This could be a powerful rejection candle (like a pin bar with a long wick), a bullish or bearish engulfing pattern, or even just a noticeable slowdown in momentum as price approaches the level. You're looking for proof that other traders see the same thing you do.
-
Does the risk/reward make sense? This is non-negotiable. Is the potential profit from the trade at least twice what you're risking? Identify the next major support or resistance level as your logical profit target. Then, place your stop-loss at a point where your trade idea is clearly proven wrong. If the potential gain doesn't significantly outweigh the potential loss, simply pass on the trade. There will always be another one.
The image below gives you a great visual of how technical analysts use historical price action to map out these crucial zones.
This chart perfectly illustrates how past peaks and valleys create areas that influence future price movements, which is the very foundation of technical analysis.
Tracking Progress and Refining Your Edge
Your trading journal is the single most valuable feedback tool you have. It’s not just for logging wins and losses; it’s for digging into the why behind each outcome. After every trade, be honest with yourself: Did I follow my plan to the letter? Did I get impatient and jump the gun? Was my stop-loss placed logically, or was it based on fear?
Consistently reviewing this data is what uncovers your personal trading patterns—both the good and the bad. This commitment to self-analysis is what separates amateurs from traders who achieve long-term profitability. It allows you to double down on what works and fix what doesn't.
To bring this entire process together—from analysis to execution—having the right tools can make a world of difference. A platform like ChartsWatcher is designed to help you build and manage this framework. It allows you to create custom dashboards, combining your charts, alerts, and notes in one place, helping you execute your strategy with precision and confidence.
