Using the Risk Reward Ratio for Smarter Trades
To put it simply, the risk-reward ratio is a quick calculation that tells you how much you stand to make for every single dollar you put on the line. It's the gut-check metric that forces you to ask one critical question before you ever place a trade: Is this actually worth it?
What Is the Risk Reward Ratio in Trading

Think of every trade you take as a calculated bet. The risk-reward ratio is what shows you the odds before you put your chips on the table. It’s the absolute bedrock of disciplined trading, helping you systematically filter out weak setups and stick to a logical game plan, even when the market is going haywire.
At its heart, the ratio just compares two crucial numbers:
- Potential Risk: This is the total amount you could lose if the trade goes sour and hits your stop-loss.
- Potential Reward: This is the profit you’d bank if the trade works out and hits your target.
A ratio of 1:3, for example, means you're risking $1 for the chance to make $3. This simple math turns trading from a pure guessing game into a strategic business. Your decisions become based on favorable probabilities, not just gut feelings or emotions.
For a deeper look into how these principles apply in more complex environments, you can explore things like advanced profit optimization strategies like Maximal Extractable Value (MEV).
Why This Metric Is Non-Negotiable
Without a clear risk-reward ratio, traders are flying blind and often fall into classic emotional traps. They might hang on to a loser for way too long, just hoping it’ll turn around. Or they'll cut a winner short because they're scared of giving back profits. This metric is the cure—it forces you to have a plan before you get in.
By defining your exit points in advance—both for a loss and a win—you take panicked, in-the-moment decision-making completely out of the equation. This one habit is one of the biggest things that separates consistently profitable traders from everyone else.
This foundational concept lets you build a trading system that can take a few hits and still come out ahead. A trader with a solid risk-reward ratio doesn't have to win all the time; they just need their wins to be meaningfully bigger than their losses.
Before we get into the nitty-gritty of the calculation, let's break down the components.
Risk Reward Ratio At a Glance
Here’s a quick table that lays out the core pieces of the risk-reward ratio. It’s a simple concept, but seeing it broken down like this makes it crystal clear.
| Component | What It Represents | Example Calculation |
|---|---|---|
| Risk | The total potential loss from your entry point to your stop-loss price. | Entry at $100, Stop-Loss at $98 = $2 Risk |
| Reward | The total potential profit from your entry point to your take-profit target. | Entry at $100, Profit Target at $106 = $6 Reward |
| Ratio | The relationship between your potential risk and your potential reward. | $2 Risk / $6 Reward = 1:3 Ratio |
As you can see, the math itself is incredibly straightforward. The real power comes from making this calculation a non-negotiable step in your trading routine.
How to Calculate Your Risk Reward Ratio
This is where the rubber meets the road—turning theory into a practical, repeatable skill. Calculating your risk-reward ratio is the single most direct way to size up a trade's potential before you put a single dollar on the line. The best part? The whole process is refreshingly simple.
All you need are three key numbers you should be defining for every trade anyway: your entry price, your stop-loss, and your profit target. By locking these in, you’re creating a clear game plan that keeps emotion out of the driver's seat. Let’s break down the formula and then run through a real-world example.
The Simple Risk-Reward Formula
The math itself is just straightforward division. You’re simply dividing the potential loss by the potential gain.
Risk-Reward Ratio = (Entry Price - Stop-Loss Price) / (Take-Profit Price - Entry Price)
The number this spits out tells you exactly how much profit you're shooting for relative to every dollar you risk. For example, if the formula gives you 0.5, that means you’re risking $1 to make $2—a 1:2 risk-reward ratio.
Let's walk through how this looks in a live trading scenario.
Imagine you’ve spotted a great buying opportunity in XYZ Corp. After doing your homework, you decide on these specific levels for your trade:
- Entry Price: You plan to buy shares at $50.
- Stop-Loss Price: If the stock drops to $48, your trade idea is proven wrong, and you'll get out to cap your losses.
- Take-Profit Price: You believe the stock has the juice to run up to $56, where you plan to sell and cash in.
With these numbers locked in, we can plug them into the formula.
Calculating Your Potential Risk
First things first, let's figure out what's at stake. Your risk is the distance between where you get in and where you get out if you're wrong. It’s the maximum you're prepared to lose on each share.
- Potential Risk = Entry Price - Stop-Loss Price
- Potential Risk = $50 - $48 = $2 per share
In this trade, you're risking a known quantity: $2 for every share you buy. By setting that stop-loss, you’ve drawn your line in the sand.
Calculating Your Potential Reward
Next up is the fun part: the potential reward. This is the gap between your entry price and your profit target, representing the upside you’re aiming for.
- Potential Reward = Take-Profit Price - Entry Price
- Potential Reward = $56 - $50 = $6 per share
If everything goes according to plan, you stand to make a $6 profit for every share you hold.
Bringing It All Together
Now, we just compare the two numbers to get our final ratio.
- Risk-Reward Ratio = Potential Risk / Potential Reward
- Risk-Reward Ratio = $2 / $6 = 0.333...
To make this easy to digest, we express it as a ratio. For every $2 we risk, we have a potential $6 reward. We can simplify this by dividing both sides by the risk ($2), which gives us a clean 1:3. This means you are risking $1 for the chance to make $3.
This one simple number is a powerful filter for your trading. A 1:3 ratio is generally seen as very attractive because your winners will be three times larger than your losers. It gives you an incredible edge, allowing you to be profitable even if you only win a minority of your trades. As a rule of thumb, many disciplined traders won't even consider a setup with a ratio below 1:2, making sure their wins always pack a punch.
For a deeper dive, you can learn more about how to calculate your risk reward ratio and apply advanced tips in our complete guide.
Setting Data-Driven Stop-Loss and Profit Targets
A risk-reward ratio is only as good as the exit points you define. The math is simple, but if your stop-loss and profit targets are picked from thin air, the whole calculation becomes meaningless. This is where traders graduate from guesswork to a professional, data-driven approach based on what the chart is actually telling them.
Instead of choosing numbers that feel right, disciplined traders use technical analysis to find logical price levels. These levels are rooted in market structure—the historical battlegrounds where buyers and sellers have fought for control. When you ground your exits in this reality, you build your risk-reward ratio on a solid foundation, not just hope.
Using Market Structure to Set Your Stop-Loss
Think of your stop-loss as your emergency exit—the exact point where your trade idea is officially proven wrong. Placing it correctly is a delicate balance. Too tight, and normal market "noise" will knock you out of a perfectly good trade. Too loose, and you'll swallow an unnecessarily large loss. The key is to place it where the market’s underlying structure breaks down.
A common and effective technique is to set your stop-loss just below a major support level. Support is a price area where buying pressure has historically stepped in to stop a stock from falling further. Placing your stop just underneath it means you’re only taken out of the trade if the market makes a decisive break through that critical floor.
Another powerful method involves using the Average True Range (ATR). The ATR is a technical indicator that measures a market’s recent volatility. By placing your stop-loss a certain multiple of the ATR away from your entry (like 2x ATR), you give the trade room to breathe and automatically adjust for whether the market is calm or chaotic.
Key Takeaway: A proper stop-loss isn’t just a random price; it’s a strategic level that invalidates your original reason for entering the trade. It respects the market's natural volatility and structure.
For a much deeper dive into mastering this critical skill, check out our complete guide on how to set stop-losses like a pro.
Identifying Logical Profit Targets
Just like your stop-loss, your profit target should be based on logic, not greed. An unrealistic target can easily turn a winning trade into a losing one if the market reverses before you get there. The goal is to identify areas where the price is likely to hit a wall.
One of the most reliable approaches is to set your take-profit target just below a major resistance level. Resistance is the opposite of support—it's a price ceiling where selling pressure has historically overwhelmed buyers, causing rallies to stall. Aiming for this area is a high-probability move because you're acknowledging a known obstacle.
Here are a few other battle-tested methods for setting both stops and targets:
- Support and Resistance: For long trades, place stops below support and target the next resistance level. For shorts, do the opposite. Simple and effective.
- Previous Highs and Lows: A recent swing high is a natural profit target for a long trade. For a short, a recent swing low is a logical place to cash out.
- Fibonacci Extensions: This tool projects potential price targets based on the size of a previous move, giving you data-backed levels where a trend might run out of steam.
To make sense of these options, it helps to see them side-by-side. Each method has its own strengths depending on what you're trying to achieve with your trade plan.
Methods for Setting Stop-Loss and Take-Profit
| Method | Best For Stop-Loss | Best For Take-Profit | Key Consideration |
|---|---|---|---|
| Support/Resistance | Placing stops just beyond these key levels to avoid premature exits. | Setting targets just before these levels to anticipate price stalls. | These are zones, not exact lines; allow for some flexibility. |
| Average True Range (ATR) | Dynamically adjusting stop distance based on current volatility. | Not typically used for targets, as its primary function is risk management. | The multiplier (e.g., 1.5x, 2x) needs to be tested for your strategy. |
| Fibonacci Levels | Using retracement levels (e.g., 61.8%) as logical points of invalidation. | Using extension levels (e.g., 1.618) to project where a trend may end. | Most effective in clear, trending markets rather than choppy ones. |
Choosing the right method depends on the market, your timeframe, and your personal trading style. The important thing is to have a reason for every level you choose.
By adopting these data-driven techniques, you transform your risk-reward ratio from a hypothetical number into a practical tool. Your entry, stop, and target become a cohesive plan based on actual market behavior, giving your trading the structure it needs to be consistent over the long haul.
Balancing Your Win Rate and Risk Reward Ratio
Many traders obsess over a high win rate, convinced that more winners means more profit. In reality, it’s not just how often you succeed—it’s how much you make when you do. Profitability lives in the gap between win rate and risk reward ratio.
Finding that sweet spot separates the disciplined from the frustrated. It lifts the weight off your shoulders when you face losses. And most importantly, it shifts your energy toward building big wins that outweigh the small setbacks.
Why A High Win Rate Can Be Misleading
Imagine hitting 90% of your trades. Sounds like a dream come true, right? Now picture that each win only nets you $10, but every loss burns $100.
Despite winning nine out of ten, the math doesn’t lie—you’re still in the red. That’s what happens when your ratio sits at 1:0.1. Striving for perfection breeds pressure and can push you into poor choices once a losing streak finally lands.
The goal isn’t to avoid losses, but to make sure your average win outweighs your average loss. This principle, known as positive expectancy, is the bedrock of long-term success.
How A High Risk Reward Ratio Creates An Edge
But here’s the flip side. A trader winning only 40% of the time can still come out ahead if they aim for a 1:3 risk reward ratio on every setup.
Consider ten trades:
- 4 Wins: 4 × $300 profit = +$1,200
- 6 Losses: 6 × $100 loss = −$600
- Net Profit: +$600
On paper, losing more often but sizing winners three times larger flips the script. Over time, large wins absorb the small, controlled losses—and that’s the math working in your favor.
The following infographic breaks down how to set profit targets using support, resistance and the Average True Range (ATR) so your ratio isn’t guesswork.
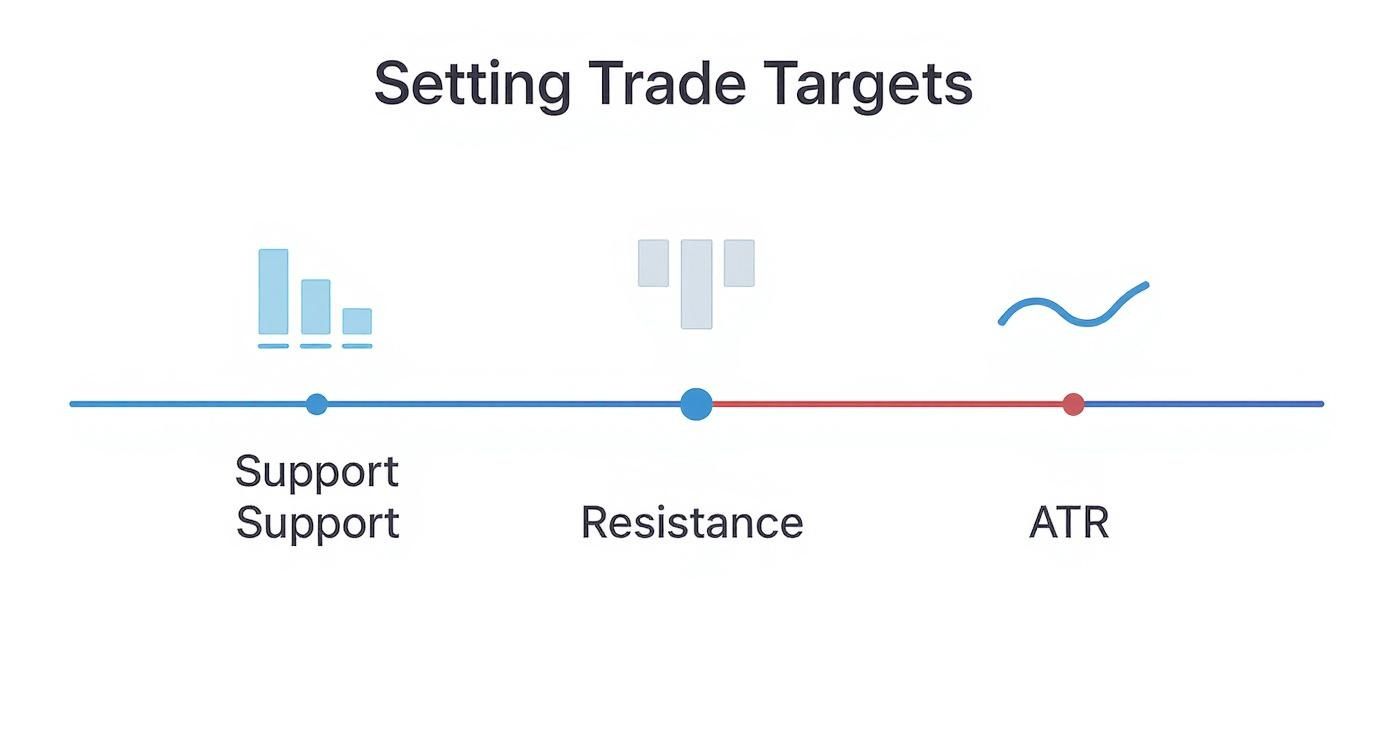
When you tie your targets to real market structure, you build a risk reward ratio with purpose. No more arbitrary guesses—just data-driven levels that tilt the odds in your favor.
Global markets have proven this time and again. Over the past 124 years, US equities returned 6.9% annualized in real terms, outpacing the UK at 4.8%. That steady performance, paired with moderate volatility, made the US market’s long-term risk reward profile one of the most attractive in the world. You can discover more insights about these global stock market returns and see how other regions have fared.
Building wealth isn't about dodging every dip. It's about stacking the odds—so your winners stand tall above your losers.
Common Risk Reward Mistakes and How to Fix Them

Knowing the theory behind risk-reward is one thing. Actually sticking to it when your hard-earned cash is on the line? That's a whole different ball game. Far too many traders understand the rules perfectly but fall into common psychological traps that blow up their best-laid plans.
These mistakes almost always come down to fear, greed, or a simple lack of discipline when the pressure is on. But here's the good news: just recognizing these pitfalls is the first step to fixing them. Once you understand why you're making these errors, you can build the discipline to turn a textbook concept into a real-world cornerstone of your profitability.
Mistake 1: Moving Your Stop-Loss Mid-Trade
This is, without a doubt, the most destructive habit in trading. You do your homework, find a perfect entry, and set a logical stop-loss based on the chart's structure. But then the price ticks against you, and that little voice of fear starts whispering. You nudge your stop "just a little bit" lower to give the trade more breathing room, hoping for a miraculous turnaround.
Stop. Right. There.
That single action completely demolishes your original risk-reward ratio. Your well-planned 1:3 trade can instantly morph into a disastrous 2:1 loser, where you're now risking far more than you ever hoped to gain. It’s an emotional decision, not a strategic one, and it opens the door to catastrophic losses.
The Fix: Treat your initial stop-loss as sacred. Once it’s set, it does not move further away from your entry price. Period. The only acceptable adjustment is to move it in your favor to lock in profits on a winning trade—a technique called a trailing stop.
Think of your stop-loss as the fire escape in your trading plan. You don't start messing with it when the building is on fire. You let it do its job and protect your capital.
Mistake 2: Chasing Unrealistic Profit Targets
On the flip side of fear is greed. Some traders get obsessed with hitting a home run on every single trade, aiming for a "perfect" risk-reward ratio like 1:5 or even 1:10. They'll set a profit target miles away, far beyond any logical resistance level, just because it makes the ratio look amazing on paper.
What happens next is painfully predictable. The trade moves nicely in their favor, gets tantalizingly close to their fantasy target, and then reverses course and smacks their stop-loss for a full loss. Greed blinded them from taking a solid, high-probability profit.
The Solution: Ground your profit targets in reality. Look at the chart, not your dreams.
- Find the nearest major resistance level and set your target just below it.
- Use tools like Fibonacci extensions to project where the price is likely to go.
- Consider taking partial profits. Bank some cash at a logical first target (like a 1:2 ratio) and let the rest of the position run.
This pragmatic approach ensures you are consistently taking what the market is willing to give you, not what you wish it would.
Mistake 3: Ignoring the Market Context
A great risk-reward ratio means absolutely nothing if the trade setup itself is garbage. A classic rookie error is forcing a trade in terrible market conditions just because the numbers pencil out. For example, trying to swing for a high-reward home run in a choppy, sideways market is a recipe for frustration and losses.
The market has a personality—is it trending, ranging, or just plain volatile? That broader context is critical because it dictates which strategies and ratios have the best chance of succeeding. Historical data backs this up. A study of global equity markets found that from the early to late 20th century, the US market delivered the highest uninterrupted real rate of return at 4.73% annually, while the median for other markets was just 1.5%. You can learn more about how the US market provided superior returns without significantly higher risk. Different environments offer different opportunities.
The Solution: Always start with a top-down analysis. First, figure out the overall market condition. Only then should you hunt for individual setups that align with that context and offer a solid R:R. If the market is stuck in a range, focus on shorter-term trades with more modest targets. If it's trending hard, that's when you can confidently aim for those bigger winners.
Integrating Risk Reward into Your Trading Plan
This is where the rubber meets the road. Making the risk-reward ratio a non-negotiable part of your daily routine is how you turn theory into consistent, profitable trading. It’s about building a system that forces discipline, kicks emotion to the curb, and makes every trade a calculated business decision instead of a gamble.
It all starts with a simple, mandatory checklist you run through before you even think about hitting the “buy” button.
This pre-flight check ensures you have a complete strategy in place before the market’s noise can mess with your head.
Your Pre-Trade Checklist
A solid plan doesn't have to be complicated, but it absolutely must be concrete. For every single setup you consider, you have to be able to define:
- The Entry Price: At what exact price is your trade idea validated?
- The Stop-Loss: Where is your idea proven wrong? This number defines your maximum risk.
- The Profit Target: Where will you cash out? This number sets your potential reward.
- The Calculated Ratio: What’s the final risk-reward ratio? Does it meet your minimum standard (e.g., 1:2 or better)?
By making this checklist a hard-and-fast rule, you automatically filter out the junk—those low-quality trades that just don't offer enough upside for the risk you're taking. It forces you to think like a professional, where protecting your capital is always job number one. Understanding how these principles are applied is crucial for anyone looking at professional roles, like the ones described in Junior Crypto Analyst Trader positions.
This disciplined approach isn't just about winning more individual trades; it compounds over time and shapes your entire portfolio's performance. The same logic applies to long-term investing. Look at the classic 60/40 portfolio (60% stocks, 40% bonds). A massive study covering 1901 to 2022 found that the Australian 60/40 portfolio delivered the highest annualized return at 6.4% with the lowest risk, making it the best risk-adjusted performer. The US was right behind with a 6.2% return, proving how balancing risk and reward is the engine of long-term success. You can read the full research on portfolio performance to dig into the details.
This structured planning is not just a pre-trade exercise; it’s a tool for continuous improvement. A detailed trading journal with these data points becomes an invaluable resource for post-trade analysis.
From Planning to Performance
Once a trade is closed, win or lose, you can go back to your journal and see what really happened. Did you stick to your stop-loss? Were your profit targets actually realistic, or were they just wishful thinking?
This feedback loop is what helps you sharpen your strategy, spot bad habits, and build the kind of consistency that separates the amateurs from the pros.
Ultimately, baking the risk-reward ratio into your plan isn’t about finding some magic formula. It’s about creating a disciplined process that protects you from your worst impulses and forces you to trade with a clear, logical edge every single time.
Of course. Here is the rewritten section, crafted to sound completely human-written and natural, following all the specified requirements.
Your Risk-Reward Questions, Answered
Even when traders get the basic idea of risk-reward, putting it into practice on a live chart brings up a lot of questions. Let's clear up some of the most common sticking points so you can start using this tool with confidence, no matter how you trade.
What’s a Good Risk-Reward Ratio for a Beginner?
If you're just starting out, here’s a simple rule that will save you a lot of grief: never take a trade with less than a 1:2 risk-reward ratio. That means for every single dollar you put on the line, your target should offer at least two dollars in profit.
Sticking to this rule does something incredibly important—it builds discipline from day one. It forces you to be picky and makes sure that when you are right, your winners are big enough to easily cover your losers. You don't need to win every trade; you just need your wins to matter.
By demanding a 1:2 ratio or better, you stop worrying about being right all the time. Instead, you focus on making sure your wins are big enough to pay for your losses and still leave you with a profit.
Does the “Right” Ratio Depend on My Trading Style?
Yes, it absolutely does. A day trader hunting for quick scalps thinks very differently than a swing trader aiming to catch a multi-week trend. Your ratio has to match your timeframe and strategy.
- Day Trading: You're in and out of the market fast, catching small moves. A 1:1.5 or 1:2 ratio is often a realistic and solid goal for these kinds of trades.
- Swing Trading: You’re holding positions for days or even weeks, trying to ride a much larger move. To make it worth tying up your capital that long, you should be aiming for much bigger returns—think 1:3 or even higher.
Can This Idea Be Used for Long-Term Investing?
Definitely. Long-term investors don't always use the term "risk-reward ratio," but the underlying principle is the bedrock of smart investing. They’re constantly weighing a stock's potential upside against the risk of losing their capital for good.
For instance, an investor might analyze a company and decide its fair value is around $100 per share. If the stock is currently trading at $50, they see a potential 100% return (the reward). The risk, in the simplest terms, is the stock going to zero. This simple calculation helps them decide how much to invest and build a portfolio where the potential home runs far outweigh the inevitable strikeouts.
Master your trading strategy by visualizing your risk-reward ratio on every trade. ChartsWatcher provides the advanced charting and analysis tools you need to make data-driven decisions. Start filtering for high-probability setups at chartswatcher.com.
