Unlocking Market Moves The Calculation Of Pivot Points
Ever wish you had a map of the market's most likely turning points before the trading day even starts? That’s exactly what pivot point calculations give you. They take the previous day's high, low, and close prices and turn them into a predictive framework of support and resistance levels.
Getting a handle on this simple math is the first step toward using a powerful tool that professional traders have relied on for decades.
Why Traders Obsess Over Pivot Point Calculations
At its core, the obsession with pivot points comes down to one thing: objectivity.
Unlike drawing a trend line or spotting a chart pattern—which can look different from one trader to the next—pivot points are purely mathematical. This means countless traders, from small retail accounts to massive institutions, are all looking at the exact same levels on their charts. When that many eyes are on the same price, those levels often become self-fulfilling prophecies.
This shared viewpoint creates a powerful psychological dynamic in the market. As the price creeps up to a resistance level like R1, sellers anticipate a reversal and start placing orders, adding downward pressure. On the flip side, as the price drops near a support level like S1, buyers see a potential bargain and step in, creating demand. It's this collective action, all rooted in a shared calculation, that gives pivot points their punch.
The Foundation of Market Sentiment
Think of the main Pivot Point (PP) as the day's balancing point. The calculation itself is a simple average, but what it tells you is profound:
- Trading Above the Pivot Point: When the price opens and stays above the main PP, it suggests buyers are in control. This is a clear signal of bullish sentiment for the session.
- Trading Below the Pivot Point: Conversely, if the price action is happening below the main PP, sellers have the upper hand, pointing to bearish market sentiment.
This simple bullish/bearish gauge, pulled directly from the pivot point calculation, offers an immediate and unbiased snapshot of the market's mood.
A trader's edge isn't always found in some complex, secret indicator. Often, it's about deeply understanding the simple tools that the majority of the market is using. Pivot point calculations are a foundational piece of that puzzle, turning raw price data into actionable market intelligence.
Learning the math behind the different pivot methods—like Standard, Fibonacci, and Camarilla—isn't just a textbook exercise. It’s essential for building a trading strategy you can actually rely on. When you know why a level is where it is, you can trust it, test it, and ultimately use it to gain a real market edge. This guide will pull back the curtain on the calculations, turning those abstract lines on your chart into a personal roadmap for navigating the day's market movements.
The Core Formulas Behind Pivot Point Calculation
To really get a feel for pivot points, you have to look under the hood and understand the engine that drives them. The math isn't complicated, but each formula offers a slightly different take on where the market might be headed. At their core, these calculations turn three simple data points from the last trading session into a full set of predictive levels for the next one.
The foundation for every single pivot point calculation rests on just three key pieces of information:
- High (H): The highest price the asset hit during the previous period.
- Low (L): The lowest price the asset reached in that same timeframe.
- Close (C): The final price when the period ended.
This simple diagram shows how these three inputs are the only building blocks needed.
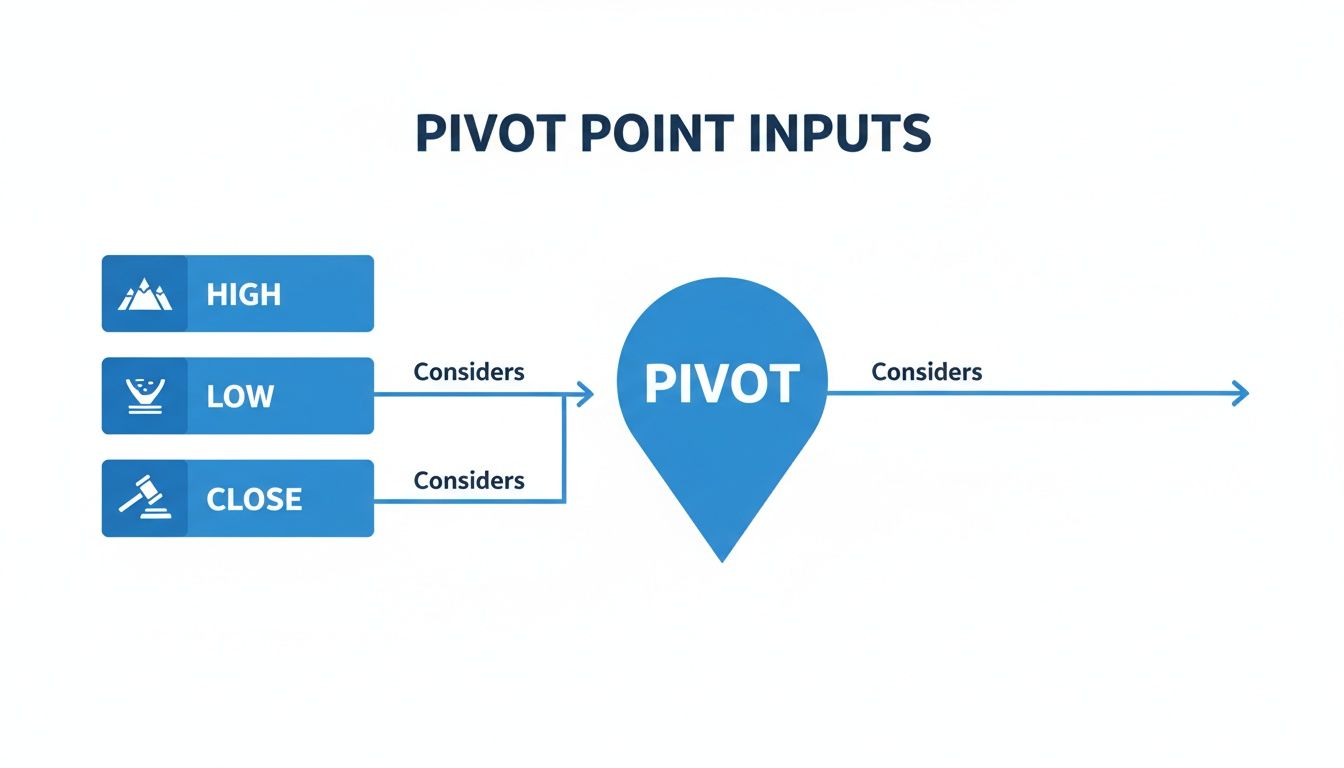
This visual flow really drives home the objectivity of pivot points. The levels you see on your chart are derived directly from past price action, not from someone's gut feeling or opinion.
Standard Pivot Point Calculation
The most common and widely used method is the Standard, or Classic, pivot point. Think of it as the original blueprint that all the other variations were built upon. It kicks things off by finding the average price of the previous period to establish the main Pivot Point (PP).
The main Pivot Point (PP) is the cornerstone of the whole system:
PP = (High + Low + Close) / 3
Once you have this central pivot, the support (S) and resistance (R) levels are calculated from it.
- Resistance 1 (R1) = (2 x PP) - Low
- Support 1 (S1) = (2 x PP) - High
From there, higher resistance and lower support levels are projected out from this base.
- Resistance 2 (R2) = PP + (High - Low)
- Support 2 (S2) = PP - (High - Low)
- Resistance 3 (R3) = High + 2 x (PP - Low)
- Support 3 (S3) = Low - 2 x (High - PP)
This classic approach gives you a balanced, symmetrical view of potential turning points around that central pivot. It's a solid, reliable starting point for any trader new to this kind of analysis.
Woodie's Pivot Point Calculation
Woodie’s pivot points are a popular twist that puts more emphasis on the closing price. The thinking here is that the closing price holds the most weight from the previous session, as it's where the market ultimately settled. This subtle shift can sometimes produce levels that are a bit more in sync with the current market sentiment.
The formula for Woodie's main pivot gives double the weight to the close:
PP = (High + Low + 2 x Close) / 4
The support and resistance levels are then calculated using the same logic as the Standard method, but they use this new, close-weighted PP as their foundation. This often results in slightly different levels, giving you an alternative perspective on the chart.
Fibonacci Pivot Point Calculation
As the name suggests, this method weaves the famous Fibonacci sequence into the mix. After calculating the standard PP, the support and resistance levels are found by adding or subtracting Fibonacci multiples of the previous day's trading range (High - Low).
The key Fibonacci ratios used here are 0.382, 0.618, and 1.000.
- Resistance 1 (R1) = PP + (0.382 x (High - Low))
- Support 1 (S1) = PP - (0.382 x (High - Low))
- Resistance 2 (R2) = PP + (0.618 x (High - Low))
- Support 2 (S2) = PP - (0.618 x (High - Low))
- Resistance 3 (R3) = PP + (1.000 x (High - Low))
- Support 3 (S3) = PP - (1.000 x (High - Low))
Traders who already use Fibonacci retracements and extensions in their analysis often love this method. It combines two powerful technical concepts into one cohesive tool.
Camarilla Pivot Point Calculation
Developed back in 1989 by a bond trader named Nick Scott, Camarilla pivot points are designed to help traders stay on the right side of the trend. The formulas use the same High, Low, and Close inputs but apply a unique set of multipliers that generate levels much closer to the current price than other methods.
This proximity makes them a favorite among short-term traders and scalpers looking for quick reversals and breakouts. The underlying logic is that price has a high probability of mean reversion, or returning to its average.
Here's the core of the Camarilla calculation:
- R4 = C + ((High - Low) x 1.1 / 2)
- R3 = C + ((High - Low) x 1.1 / 4)
- S3 = C - ((High - Low) x 1.1 / 4)
- S4 = C - ((High - Low) x 1.1 / 2)
For Camarilla traders, the most critical levels are typically the third and fourth support and resistance levels (S3, R3, S4, R4). These act as key decision points for entering breakout or reversal trades.
Comparing Popular Pivot Point Calculation Formulas
With several methods available, it helps to see the formulas side-by-side to appreciate the subtle but important differences. This table breaks down how the main pivot point (PP) and the first level of support (S1) and resistance (R1) are calculated for each type.
| Pivot Type | Pivot Point (PP) Formula | Resistance 1 (R1) Formula | Support 1 (S1) Formula |
|---|---|---|---|
| Standard | (High + Low + Close) / 3 | (2 x PP) - Low | (2 x PP) - High |
| Woodie | (High + Low + 2 x Close) / 4 | (2 x PP) - Low | (2 x PP) - High |
| Fibonacci | (High + Low + Close) / 3 | PP + (0.382 x (High - Low)) | PP - (0.382 x (High - Low)) |
| Camarilla | (Does not use a central PP) | C + ((High-Low) x 1.1/6) | C - ((High-Low) x 1.1/6) |
As you can see, the starting point—how the main pivot is calculated or if it's used at all—is what creates the different "flavors." Woodie's gives more weight to the close, while Fibonacci applies its famous ratios to the previous day's range.
Getting comfortable with these formulas is a big step toward becoming a more proficient trader. Just as it's useful to know how to calculate other crucial investment metrics like Return on Investment, understanding the math behind your indicators is key. Each pivot point calculation gives you a slightly different map of the market, and knowing how those maps are drawn is the first step toward using them effectively.
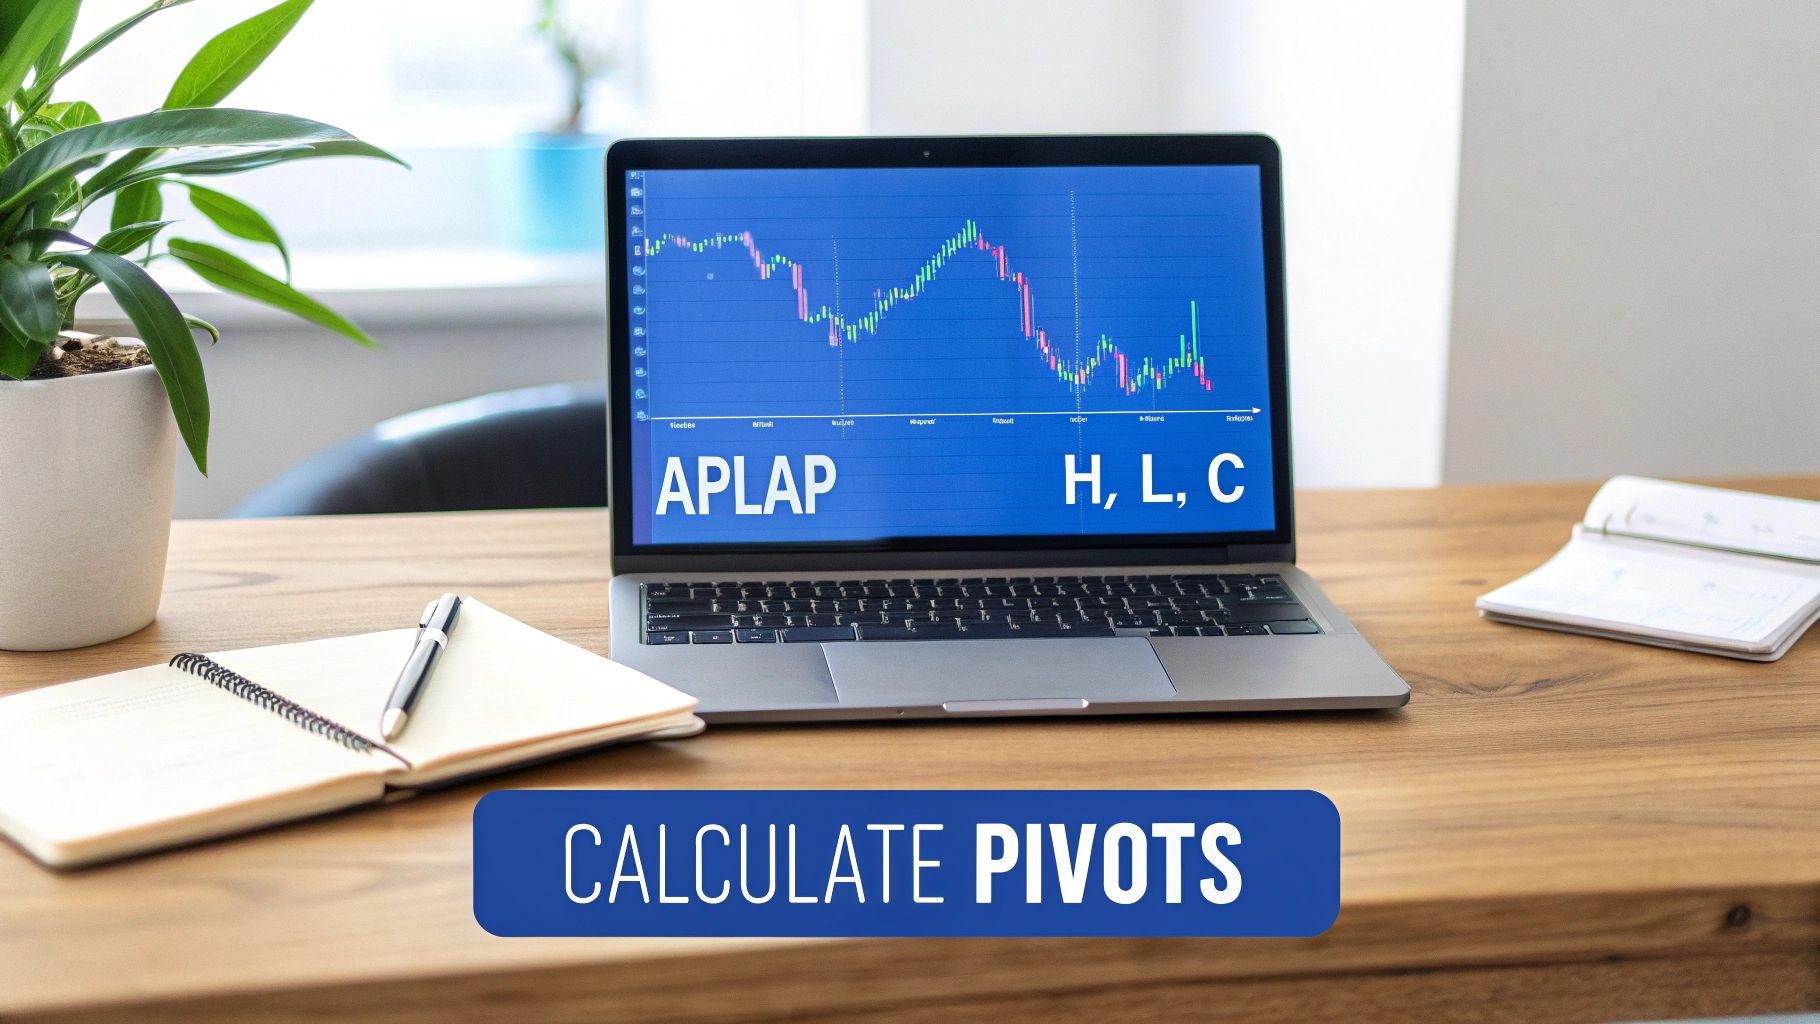
Calculating Pivot Points Step By Step With Real Data
Reading through formulas is one thing, but you don’t really get it until you plug in some real numbers. Let's walk through the entire calculation from start to finish using actual market data. This is how you bridge the gap between theory and what you actually see on a chart.
For this example, we’ll use a stock everyone knows: Apple Inc. (AAPL). To get started, we just need three simple data points from the previous trading day: the high, low, and closing price. You can find this on any financial website or right inside your trading platform. If you're doing a deeper analysis, it often helps to download historical stock data easily so you have a clean dataset to work with.
Let's say for a particular day, AAPL’s price action looked like this:
- High (H): $191.45
- Low (L): $189.23
- Close (C): $191.04
That’s it. These three numbers are all we need to map out our key levels for the next session.
Standard Pivot Point Calculation Example
First up, we'll run the numbers using the most common method: Standard Pivots. Everything starts with the main Pivot Point (PP), which acts as the foundation for all the other levels.
Step 1: Calculate the Main Pivot Point (PP) The formula is just a simple average of our three key prices.
- PP = (High + Low + Close) / 3
- PP = ($191.45 + $189.23 + $191.04) / 3
- PP = $571.72 / 3
- PP = $190.57
This value, $190.57, is our central pivot—the primary balance point for the next trading day.
Step 2: Calculate Support and Resistance Levels Now, using our new PP and the original high and low, we can project the key support (S) and resistance (R) levels.
-
Resistance 1 (R1) = (2 x PP) - Low
- R1 = (2 x $190.57) - $189.23
- R1 = $381.14 - $189.23
- R1 = $191.91
-
Support 1 (S1) = (2 x PP) - High
- S1 = (2 x $190.57) - $191.45
- S1 = $381.14 - $191.45
- S1 = $189.69
We can keep going to find the second-tier levels, which often come into play on more volatile days.
-
Resistance 2 (R2) = PP + (High - Low)
- R2 = $190.57 + ($191.45 - $189.23)
- R2 = $190.57 + $2.22
- R2 = $192.79
-
Support 2 (S2) = PP - (High - Low)
- S2 = $190.57 - ($191.45 - $189.23)
- S2 = $190.57 - $2.22
- S2 = $188.35
So, for the upcoming session, a trader using Standard Pivots for AAPL would be watching these key levels: R2 ($192.79), R1 ($191.91), PP ($190.57), S1 ($189.69), and S2 ($188.35).
Fibonacci Pivot Point Calculation Example
Now, let's see how much things change just by swapping out the formula. We'll use the exact same AAPL data but apply the Fibonacci pivot calculation instead. This method uses the day's trading range multiplied by key Fibonacci ratios. The PP calculation itself stays the same.
Step 1: Reconfirm the Main Pivot and Calculate the Range Our Pivot Point is still $190.57. The first thing we need is the trading range.
- Range = High - Low
- Range = $191.45 - $189.23
- Range = $2.22
Step 2: Calculate Fibonacci Support and Resistance Here, we'll bring in the well-known Fibonacci ratios of 0.382 and 0.618.
-
Resistance 1 (R1) = PP + (0.382 x Range)
- R1 = $190.57 + (0.382 x $2.22)
- R1 = $190.57 + $0.85
- R1 = $191.42
-
Support 1 (S1) = PP - (0.382 x Range)
- S1 = $190.57 - (0.382 x $2.22)
- S1 = $190.57 - $0.85
- S1 = $189.72
Notice the difference? The Fibonacci R1 is at $191.42 (compared to Standard's $191.91), and the S1 is at $189.72 (compared to Standard's $189.69). They’re close, but definitely not the same.
This side-by-side comparison is crucial. It shows that the specific pivot point calculation you choose directly impacts the levels you see and, by extension, the trading decisions you might make. One method could suggest a key resistance level is still far away, while another shows the price testing it right now.
This hands-on exercise proves that pivot points aren't just arbitrary lines on a chart. They are the direct result of a repeatable mathematical process. When you understand how they're built, you gain the confidence to not just use these levels but to truly understand what they represent.
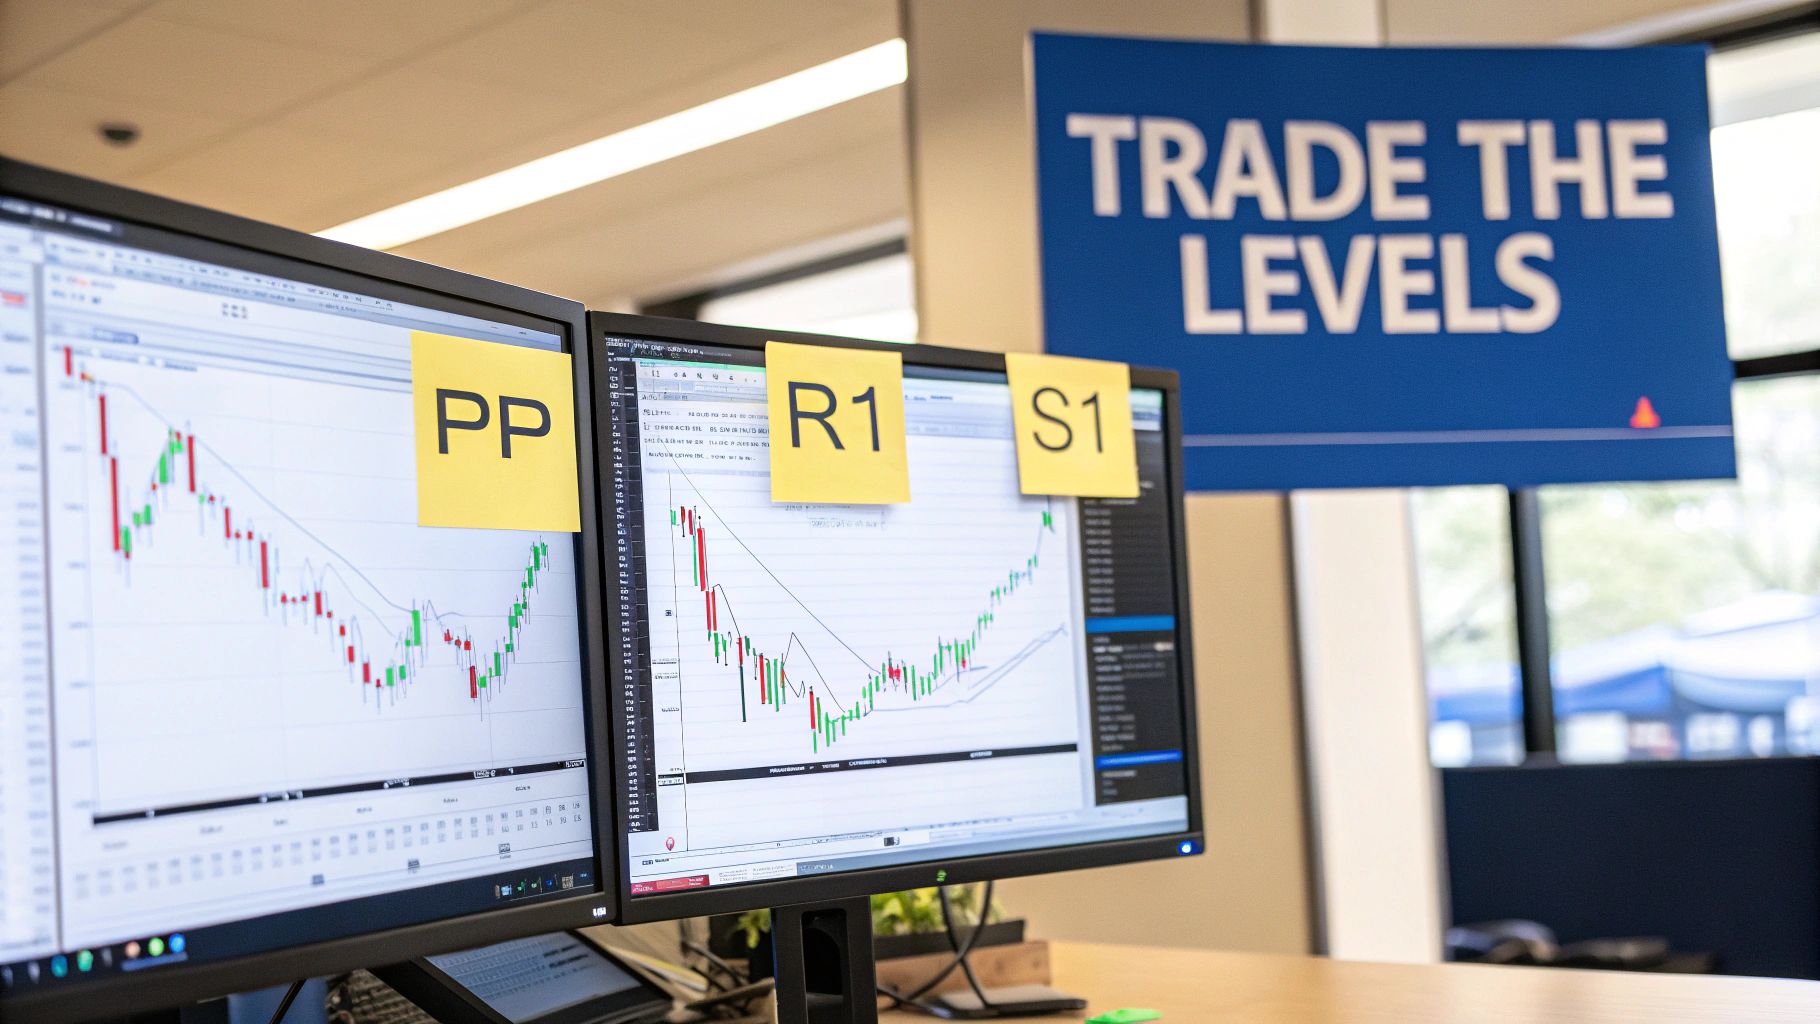
Translating Pivot Calculations Into Trading Decisions
Knowing how to crunch the numbers for pivot points is only half the battle. The real magic happens when you translate those static levels into dynamic, real-time trading decisions. Once you plot the pivots on your chart, they create an objective framework for reading the day's price action and building a strategy you can actually follow. It’s the difference between reading sheet music and playing the instrument.
The most fundamental rule is incredibly simple: if the price is trading above the main Pivot Point (PP), it suggests a bullish bias for the day. If it's below, the bears are likely in control. This gives you a quick sentiment filter right at the opening bell. From there, the support (S) and resistance (R) levels become your tactical map, showing you exactly where to look for entries, exits, or places to manage your risk.
Understanding Bounces And Breakouts
Trading with pivots really boils down to two core scenarios: bounces (reversals) and breakouts (continuations). Your job is simply to watch how the price reacts when it approaches one of these calculated levels and then act on what you see.
-
Pivot Point Bounces: This is when the price tests a pivot level but fails to push through, reversing course instead. A bounce off an S1 or S2 level can be a great long entry, while a rejection at an R1 or R2 level might signal a shorting opportunity. The trick is to wait for confirmation, like a clear candlestick pattern, before jumping in.
-
Pivot Point Breakouts: This happens when the price slices through a pivot level with real conviction, often backed by a spike in volume. A decisive break above R1 suggests the bulls are gaining steam, making R2 the next logical target. A breakdown below S1 means bearish momentum is building, pointing the way toward S2.
For day traders, these levels provide crystal-clear entry triggers and profit targets. For example, if you go long on a bounce off S1, you might set your profit target just below the main PP or even R1. If you short a breakout below the PP, your first target for taking profits would naturally be S1.
Building A Rules-Based Approach
The real power of pivot points is that they're completely objective. They take the guesswork out of trading and let you build a concrete game plan before the market even opens. This plan should define exactly how you'll react at each key level.
By linking the math directly to market action, you can build a trading system around statistically significant price levels. This isn't about predicting the future; it's about reacting to probable outcomes based on a shared market reference point.
This is where statistical analysis can give you a serious edge. In futures trading, for instance, data shows that when an asset opens between the PP and S1—which happens about 22% of the time—the price is highly likely to touch the PP (85.2% of the time) but has almost no chance of hitting R3. That kind of data strongly favors looking for long entries with tight stops. You can find more insights like this by exploring trading futures with pivot point probabilities on edgeful.com.
Strategic Placement Of Stops And Targets
These calculated pivot levels are also invaluable for managing risk. They give you logical places to set your stop-loss orders and define your profit targets, helping you set up trades with a favorable risk-to-reward ratio.
Managing Risk and Reward:
- Entry at S1 (Long): A classic strategy is to place a stop-loss just below the S1 level. Your first profit target could be the main PP, with a secondary target at R1.
- Entry at R1 (Short): If you short the market at R1, your stop-loss would go just above it. You'd then target the PP and S1 for taking profits.
- Breakout Above R1 (Long): When entering a breakout trade above R1, you can place your stop just below R1, which should now act as a new support level. The next target becomes R2.
Using this calculated framework ensures that every single trade has a predefined exit plan, whether it's a winner or a loser. This disciplined approach, born from a simple set of formulas, is a hallmark of professional trading. It transforms abstract lines on a chart into a practical roadmap for navigating the day's volatility.
Choosing The Right Pivot Calculation Method For You
Picking a pivot point formula isn’t about nailing down a single “best” option. Instead, it’s finding the one that fits your trading style, the market you’re in, and how that market behaves right now.
Imagine pivot methods as camera lenses. A wide-angle lens (Standard Pivots) shows the entire scene. A telephoto lens (Camarilla Pivots) zeroes in on the action. Neither is better by itself—it all depends on what you’re trying to capture.
Matching The Method To Your Market
First, size up your market’s personality. Is it meandering in a narrow range, or roaring ahead with strong momentum?
-
For Ranging Markets
Sideways moves call for levels that stay close to the price.
• Camarilla Pivots cluster tightly around yesterday’s close, perfect for spotting minor swings. -
For Trending Markets
Trends need breathing room—targets that extend beyond the recent range.
• Fibonacci Pivots use percentage-based expansions of the prior day’s high-low range to project logical targets.
Getting this match right is crucial. A range tool in a trending market produces levels that break too easily. A trend tool in a choppy market gives you zones that never get tested.
Aligning With Your Trading Style
Next, think about your time frame. Do you hunt for quick profits over minutes, or ride moves for days?
Pivot points have branched into at least five major variants. Camarilla pivots, with their tighter inner levels, have historically captured 55% more reversals in Nasdaq futures than standard pivots. Learn more about the effectiveness of different pivot methods.
That difference can translate into real opportunity.
If You’re A Scalper
You need rapid signals and precise stops.
- Top Pick: Camarilla Pivots for frequent entry/exit cues.
- Also Consider: Woodie’s Pivots, which put extra weight on the closing price for quick responsiveness.
If You’re A Swing Or Position Trader
You’re after multi-day swings and bigger moves.
- Top Picks: Fibonacci or Standard Pivots. Their wider levels map out the larger ebb and flow—ideal for key support and resistance zones.
By customizing pivot formulas in your charting platform, you align your tools with your unique strategy. The result is a clearer, personalized roadmap of the market’s most meaningful levels.
Putting Your Pivot Point Strategy on Autopilot
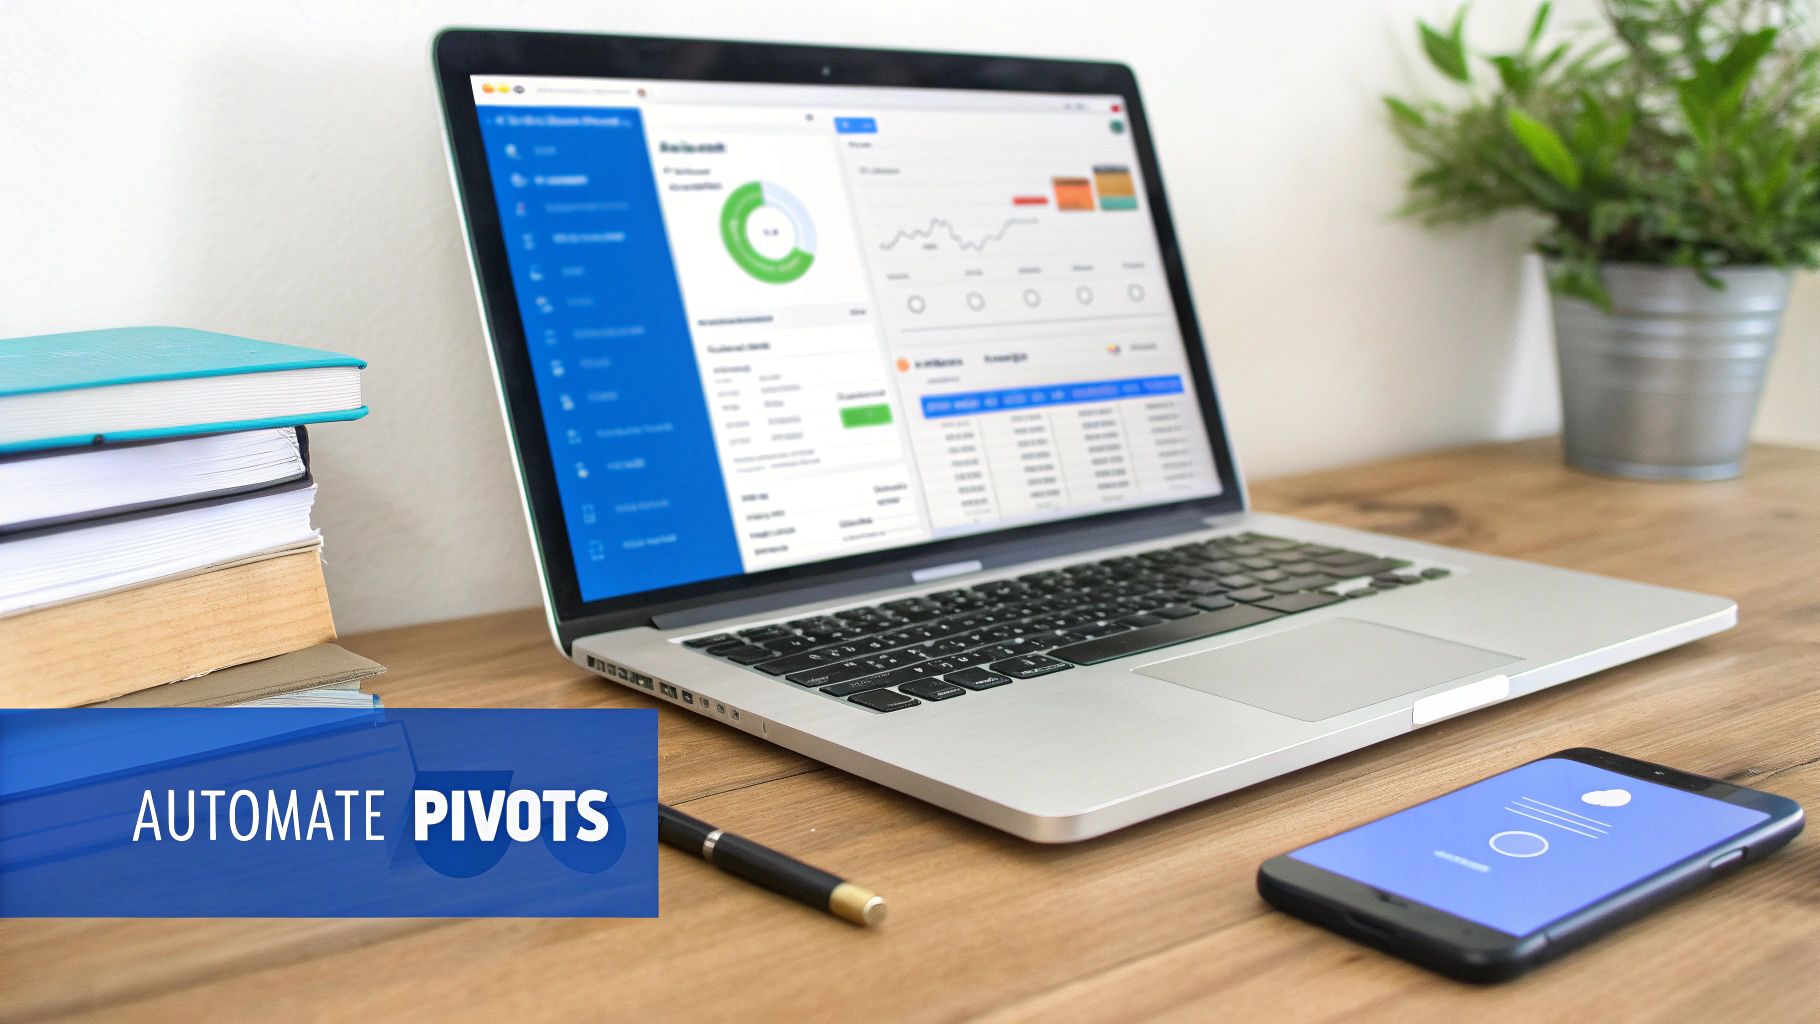
Knowing how to calculate pivot points is one thing, but crunching the numbers by hand before every session is slow, tedious, and a recipe for mistakes. To trade like a pro, you have to move from theory to execution. This is where automation comes in, turning your knowledge into a real market edge by letting you focus on strategy, not arithmetic.
Modern trading platforms like ChartsWatcher are built specifically for this. With a single click, you can overlay any pivot type—Standard, Fibonacci, Camarilla—directly onto your charts. No more calculators or spreadsheets. The software does all the heavy lifting, making sure your levels are always accurate and based on the latest session data.
Building Custom Scans and Alerts
But the true power of automation isn't just plotting lines on a chart; it's building custom scans and alerts. Instead of staring at dozens of charts waiting for the perfect setup, you can teach the system to find those opportunities for you. This frees up your mental energy and ensures you never miss a trade that meets your exact rules.
Let’s say you’re looking for stocks with strong bullish momentum. You could build a scan that instantly finds every asset that meets these conditions:
- Price Action: The current price has just broken above the daily R1 level.
- Volume Confirmation: The breakout is happening on volume that's at least 150% of the 20-day average.
- Market Context: The stock is also trading above its 50-period moving average.
A scan like this runs in real-time across thousands of stocks, feeding you a curated list of high-probability setups. This kind of systematic approach is what separates a hobbyist from a serious trading operation.
From Reactive to Proactive Trading
Automation also lets you set hyper-specific alerts on your personal watchlist. You can create a rule that pings you the moment a stock you’re following tests its S2 support level. That notification gives you plenty of time to pull up the chart, analyze the price action, and decide if you want to pull the trigger.
This simple shift changes your entire approach. You're no longer reacting to what's already happened; you're proactively waiting for your A+ setups to come to you.
For traders looking to go even further, AI-powered automation solutions can take this a step further, helping to build, test, and deploy strategies based on these key levels. When you combine a solid understanding of pivot points with today's powerful trading tools, you can build a data-driven strategy with professional-grade efficiency.
If you're ready to make the leap, check out our guide on how to automate a trading strategy for a deeper dive.
Common Questions About Pivot Point Calculations
Once you’ve got the formulas down, you'll find that real-world trading always throws a few curveballs. Getting these practical details right is what separates a confident pivot point trader from one who's just guessing.
Let's tackle some of the most common questions that pop up when traders start putting these levels to work.
Which Timeframe Data Should I Use For My Calculations?
This is probably the number one question I get. The answer is simple: the data you use has to match the timeframe you trade. Think of it like using the right map for your journey—a city map won't help you on a cross-country road trip.
The inputs you choose completely dictate how relevant the resulting pivot levels will be.
- Day Trading? You'll want to use the High, Low, and Close from the previous full trading day. This gives you a set of levels that are respected by other day traders watching the current session unfold.
- Swing Trading? If you're holding positions for a few days or weeks, daily pivots are just noise. You need to zoom out. Use the High, Low, and Close from the prior week to generate your levels.
Using the wrong timeframe is a surefire way to get chopped up. You'll be watching levels that the rest of the market is completely ignoring.
Why Are My Calculated Pivots Different From My Charting Software's?
Ever run the numbers yourself and see something slightly different on your screen? Don't worry, your math is probably fine. This tiny discrepancy almost always comes down to one thing: the definition of the "session close."
This is a huge deal in 24-hour markets like Forex or crypto. One platform might define the end of the day at 5:00 PM EST to align with the New York close. Another might use midnight GMT. That small difference in the "Close" price will ripple through all the other pivot calculations, shifting every level slightly.
The fix is easy. Just check the session time settings in your charting platform. Make sure your manual calculations use the exact same closing bell so everything lines up perfectly.
Think of pivot points as powerful confirmation tools, not a standalone trading system. The highest-probability trades happen when multiple signals converge right at a key pivot level.
For example, imagine the price pulls back to the S1 support level. At the same time, you spot a bullish hammer candlestick forming, and your RSI is climbing out of oversold territory. That's a three-star setup. The pivot acts as the "X marks the spot" for your other signals. They pair exceptionally well with tools like volume analysis and moving averages to confirm true market conviction.
Ready to stop crunching numbers and start finding trades? With ChartsWatcher, you can instantly plot any pivot type, build custom scans for breakouts or pullbacks to pivot levels, and get real-time alerts sent straight to your device. Start your free trial and automate your edge at ChartsWatcher today.
