Ultimate Trading Journal Template Excel Guide: Track Your Success Like a Pro
Why Every Trader Needs an Excel Trading Journal

Many new traders rush into the markets hoping for quick profits, but real success comes from careful analysis and refined strategies. A trading journal is essential for this process - it acts like a personal coach, helping you understand what works and what doesn't. By tracking your trades systematically, you can turn random trades into calculated decisions that lead to better results.
The Power of Systematic Tracking
Just as athletes review game footage to spot areas for improvement, traders need to examine their performance carefully. A trading journal helps you identify patterns in both winning and losing trades. Instead of getting caught up in market swings, you can focus on your own decisions - the one thing you can actually control. You'll start to see how different market conditions affect your choices and how your emotions influence your trading.
Excel: Your Trading Journal Ally
While there are many ways to keep a journal, using Excel gives you unique advantages. Excel makes it simple to crunch numbers and create visual charts of your performance. You can easily track important metrics like your win rate, average gains and losses, and risk-adjusted returns. The best part? You can customize your Excel template to match exactly how you trade, whether you're making quick day trades or holding positions for weeks.
Key Components of an Effective Trading Journal
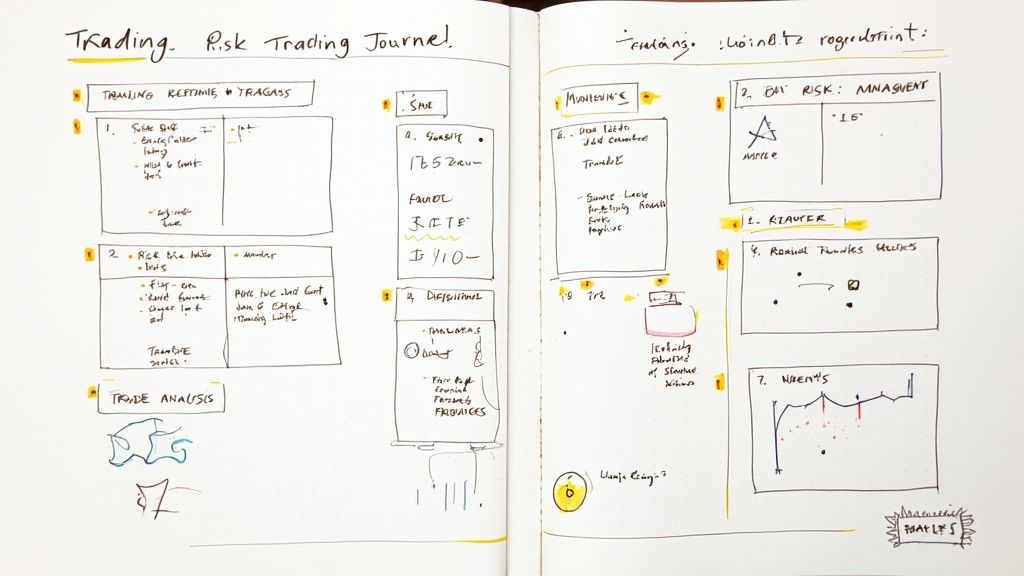
A good trading journal helps you develop consistency and learn from every trade. According to Stockbrokers.com, your journal should include basic details like trade dates, what you bought or sold, position size, exit points, profits/losses, and notes about why you made each trade. The trading metrics dashboard shows key stats about your performance and habits. As you log more trades, these numbers become more meaningful and help you spot what strategies actually work. Adding notes about market conditions and your emotional state during trades gives you valuable psychological insights.
From Data to Decisions
A trading journal in Excel is more than just a record - it's a tool for making better trades. By studying your historical data, you can find specific trade setups that consistently make money. This removes guesswork from your trading as you base decisions on real results rather than hunches. Tracking your emotional responses also helps you manage risk better and avoid making impulsive moves driven by fear or greed. This constant process of reviewing and improving is what sets successful traders apart.
Building Your Perfect Excel Trading Template
If you want to improve your trading, having a clear trading journal is essential. Far beyond just tracking your trades, it helps reveal patterns in your strategy and decision-making. Let's walk through setting up your own trading journal in Excel that will help you learn from your trades and make better decisions.
Essential Components of a Winning Template
Your trading journal needs to answer key questions about your performance: What trades work best? How do emotions affect your trades? Are you managing risk properly? Start with these core data points:
- Date and Time: Record exact entry and exit timing to understand market context
- Symbol: Stock ticker or asset name
- Trade Type: Long (buy) or short (sell)
- Entry and Exit Prices: Core data for calculating profits/losses
- Position Size: Number of shares/contracts traded
- Profit/Loss: Both dollar amount and percentage
- Win/Loss: Simple yes/no to track win rate
Adding Depth to Your Data
To get deeper insights, include these additional fields:
- Fees/Commissions: Track all trading costs
- Strategy Used: Tag each trade with your approach (breakout, reversal, etc.)
- Market Context: Note any major news or events
- Emotional State: Be honest about your mindset during trades
- Key Lessons: Write down what worked and what you'd do differently
Want to learn more about setting up a detailed journal? Check out 10 Best Day Trading Indicators: A Complete Guide to Profitable Trading.
A solid journal template includes entries for dates, prices, trade type, and results. Consider adding timestamps, share counts, fees and strategy notes. Charts and dashboards can help visualize your performance. Learn more about creating a comprehensive Excel template.
Automating Your Analysis
Excel's power comes from automating calculations. Set up formulas to instantly show your P/L, win rate and other key stats. This saves time and prevents math errors.
Adapting to Your Evolving Strategy
Your journal should grow with your trading approach. As you refine your strategy, adjust your template to track what matters most. Add columns for new indicators or metrics that help improve your results. Regular updates ensure your journal remains relevant and useful for learning from each trade.
Mastering Advanced Performance Analytics

A trading journal template in Excel does more than just record your trades - it helps you analyze your performance and find ways to improve. By studying your trading data carefully, you can turn basic trade information into useful insights that help you make better trading decisions.
Key Performance Indicators (KPIs) for Success
Smart traders track specific metrics to evaluate how well their strategies work. Going beyond simple profit and loss figures, these KPIs give a deeper view of trading performance:
- Risk-Adjusted Returns: Shows profits compared to risk taken. Between two strategies with equal profits, the one with less risk is usually better.
- Maximum Drawdown: Tracks your biggest account decline from peak to bottom. This helps you understand your risk limits and size positions appropriately.
- Strategy Correlation: Shows how different trading approaches perform in relation to each other - especially useful when running multiple strategies.
Automating Calculations in Excel
Excel shines when it comes to running complex calculations automatically. You can instantly see your trade results and track KPIs without manual data entry. Built-in formulas calculate risk-adjusted returns, maximum drawdown, and other key metrics automatically. This quick feedback helps you adapt to market changes faster.
Real-World Examples of Advanced Analytics in Action
Take a day trader who uses an Excel trading journal. They can spot their most profitable setups and best trading times of day. By analyzing average wins and losses, they improve their risk management. Looking at maximum drawdown helps prevent overtrading and protects their account.
TrendSpider's Excel template offers detailed statistics for performance review. It tracks total trades, shares traded, and breaks down trades by type and direction. The template calculates important numbers like average return, win ratio, and risk/reward ratios. This deep analysis helps traders spot trends and areas to improve.
Practical Guidance on Setting Up Automated Calculations
Setting up automatic calculations in your Excel trading journal is straightforward. While many pre-made templates exist online, understanding the basic formulas helps you customize your journal. For example, use Excel's MAX function for drawdown calculations and AVERAGE for win/loss ratios.
From Analysis to Actionable Insights
A well-designed trading journal turns data into useful insights. This helps you make fact-based decisions, refine your approach, and trade better over time. The best traders use this feedback loop to adapt and grow. By understanding your strengths and weaknesses through data, you can make smarter choices that lead to consistent results in the markets.
Creating Dynamic Performance Dashboards
A basic trading journal Excel sheet can be powerful on its own. But to really make it work for you, you need to build dynamic performance dashboards. These dashboards turn raw data into clear insights by showing your trading strengths, weaknesses, and where you can improve. You'll get a quick read on how you're doing and make smarter decisions based on actual data.
Visualizing Key Metrics for Instant Insights
Good traders make their data visual. Picture seeing your win rate, average profit/loss, and maximum drawdown on charts that update as you enter trades. This immediate feedback helps you spot patterns fast and fix problems in your approach. For example, if your win rate suddenly drops, you know something needs attention. Or if you keep doing well in certain market conditions, you've found an edge to focus on.
Tracking Progress Towards Your Goals
Setting clear, measurable goals is essential for trading success. Your dashboard should show both current performance and progress toward your targets. You might track monthly profits against your goal or compare your risk-adjusted returns to benchmarks. Regular progress checks help maintain focus and motivation.
Identifying Hidden Patterns for Breakthroughs
The best insights often hide beneath surface-level trading data. Dynamic dashboards help uncover these patterns by letting you slice data different ways. You might discover that one strategy works great in volatile markets, or that you make more mistakes during certain hours. These findings can lead to major improvements in your results.
Designing User-Friendly Dashboards
A dashboard is only helpful if it's clear and easy to use. Too much information creates confusion. Here's how to design effectively:
- Prioritize Key Metrics: Focus on the numbers that directly impact your trading
- Use Clear Visualizations: Pick the right chart type - bars for comparisons, lines for trends, pies for percentages
- Maintain a Consistent Layout: Organize information logically so it's easy to find
- Regularly Review and Refine: Update your dashboard as your trading evolves
For example, the trading journal template from Epicc Trader provides detailed analytics including profit/loss calculations, reward-to-risk ratios, and position efficiency metrics. It tracks key stats like win rates, average trade duration, and maximum favorable/adverse excursion. This depth of analysis helps traders spot areas for improvement and refine their strategies over time.
By using these techniques, you can turn a basic Excel trading journal into a powerful tool for steady improvement. You'll gain clearer insights into your current performance and make smarter trading decisions based on real data.
Maintaining Your Journal Like a Professional

A trading journal requires consistent effort and attention to detail. The most successful traders stand out through their disciplined approach to documenting trades, checking data, and monitoring results. Your journal becomes a powerful decision-making tool when you maintain it properly.
Building Efficient Systems for Trade Logging
Make trade logging a natural part of your daily workflow:
- Create a Routine: Block off specific times each day for updates. Many traders prefer logging right after market close, recording entry/exit points and emotional factors behind trades.
- Template Utilization: Use ready-made templates like the one from TradeZella that automatically calculate profit/loss and R-multiple.
A structured system helps keep your data complete and ready for later review. Get more tips about effective logging in this trade documentation guide.
Techniques for Enhancing Data Accuracy
Keep your data reliable by:
- Regular Validation: Check past entries weekly to spot and fix any mistakes in asset symbols or trade categories.
When your data is accurate, you can trust the insights and decisions that come from analyzing your journal entries.
Establishing a Routine for Performance Reviews
Set up regular check-ins to evaluate your trading:
- Weekly Snapshots: Review your progress each week to fine-tune your approach.
- Monthly Deep Dives: Take time each month to spot patterns and gather key insights.
Maintaining a Focus on Continuous Improvement
Your trading journal should drive ongoing growth in your trading skills:
- Actionable Insights: Use your journal data to pinpoint specific areas to work on, from entry rules to emotional control during trades.
By following these professional practices, your trading journal template excel becomes more than just a record book. It turns into a powerful tool for improving your trading strategy, similar to how sports coaches use game footage to help athletes get better.
Using Data to Improve Your Trading Strategy

Your Excel trading journal is more than just a record - it's a tool to help you make better trading decisions and boost your profits. Smart traders regularly review their past trades to spot what works, improve their timing, and manage risk effectively. Let's explore how to turn your trading data into practical insights.
Finding What Works: Entry and Exit Points
A detailed journal helps you identify which trade setups consistently make money. For example, you might notice you win more often when trading breakouts with high volume. This could lead you to focus more on these specific setups. Looking at your losing trades is just as important - if you see you're holding onto losses too long, you can set stricter rules about cutting bad trades quickly.
Getting Position Size Right
How much money you put into each trade matters a lot for managing risk and growing your account. Your journal data shows you what position sizes work best. By looking at your win rate and average gains versus losses, you can figure out the right amount to risk. If you win often but with small gains, you might want to trade bigger on your winning setups. If you win less often but with bigger gains, smaller positions could help protect your account.
Smart Ways to Review Your Trades
To make your data useful, start by grouping trades by type - like the strategy used, market conditions, or what you're trading. Then calculate important numbers like win rate, average profit/loss, biggest drawdown, and risk-adjusted returns. Comparing these numbers across different groups shows you which approaches work best. Check out: How to Backtest a Trading Strategy: The Complete Playbook for Modern Traders.
Making Real Improvements
Once you spot ways to improve, try them out and track the results. This creates a cycle of constant improvement based on real trading results. For example, if you change how you enter trades based on your analysis, watch how it affects your win rate and profits. If things get better, keep doing it. If not, look for other adjustments. This process of testing and adjusting helps you get better over time.
Testing Your Trading Ideas
Experienced traders use their journals to test specific ideas about their trading. They might think "Trading in the first hour of the day makes more money" and then check their data to see if it's true. This removes guesswork and lets you make choices based on facts. You can also use backtesting to see how your improved strategy would have worked in the past before trying it with real money.
Ready to take your trading to the next level with tools designed for serious analysis? Visit ChartsWatcher to see how our features can help you trade more consistently.

