Ultimate Stock Screener for Day Trading: Find Winning Trades
Why Smart Traders Never Trade Without Stock Screeners
Finding a winning day trade can feel like searching for a needle in a massive, constantly shifting haystack. Without a good stock screener for day trading, you're essentially trying to track thousands of moving stocks manually. Let's be honest, that's just not feasible.
Experienced day traders know this, and they wouldn't dream of trading without a reliable screener. I've personally talked to traders who've completely transformed their approach by incorporating screeners. They've gone from feeling overwhelmed and chasing lagging indicators to having a laser-focused watchlist of potential plays delivered right to them. No more wasted time sifting through noise; just pure, real-time opportunities.
Stock screeners have become so indispensable that over 70% of active day traders use them daily. They're leveraging these tools to filter through thousands of equities, searching for those high-probability setups. Trade Ideas is a great example of a platform known for its real-time, AI-powered filtering, letting traders zero in on stocks exhibiting very specific behaviors. Want to learn more about choosing the right stock screener? Investopedia has some helpful resources.
This boost in efficiency translates directly to improved win rates. Instead of throwing darts in the dark, traders can concentrate on stocks that align with their specific strategies, showing the precise technical indicators and price action they're looking for. Many traders incorporate tools like an options risk reward calculator to further evaluate potential trades. This targeted approach makes a world of difference in the fast-paced world of day trading. For some additional tips, check out this related article: Read also: How to Use a Stock Screener.
Finding Your Perfect Stock Screener Platform Match
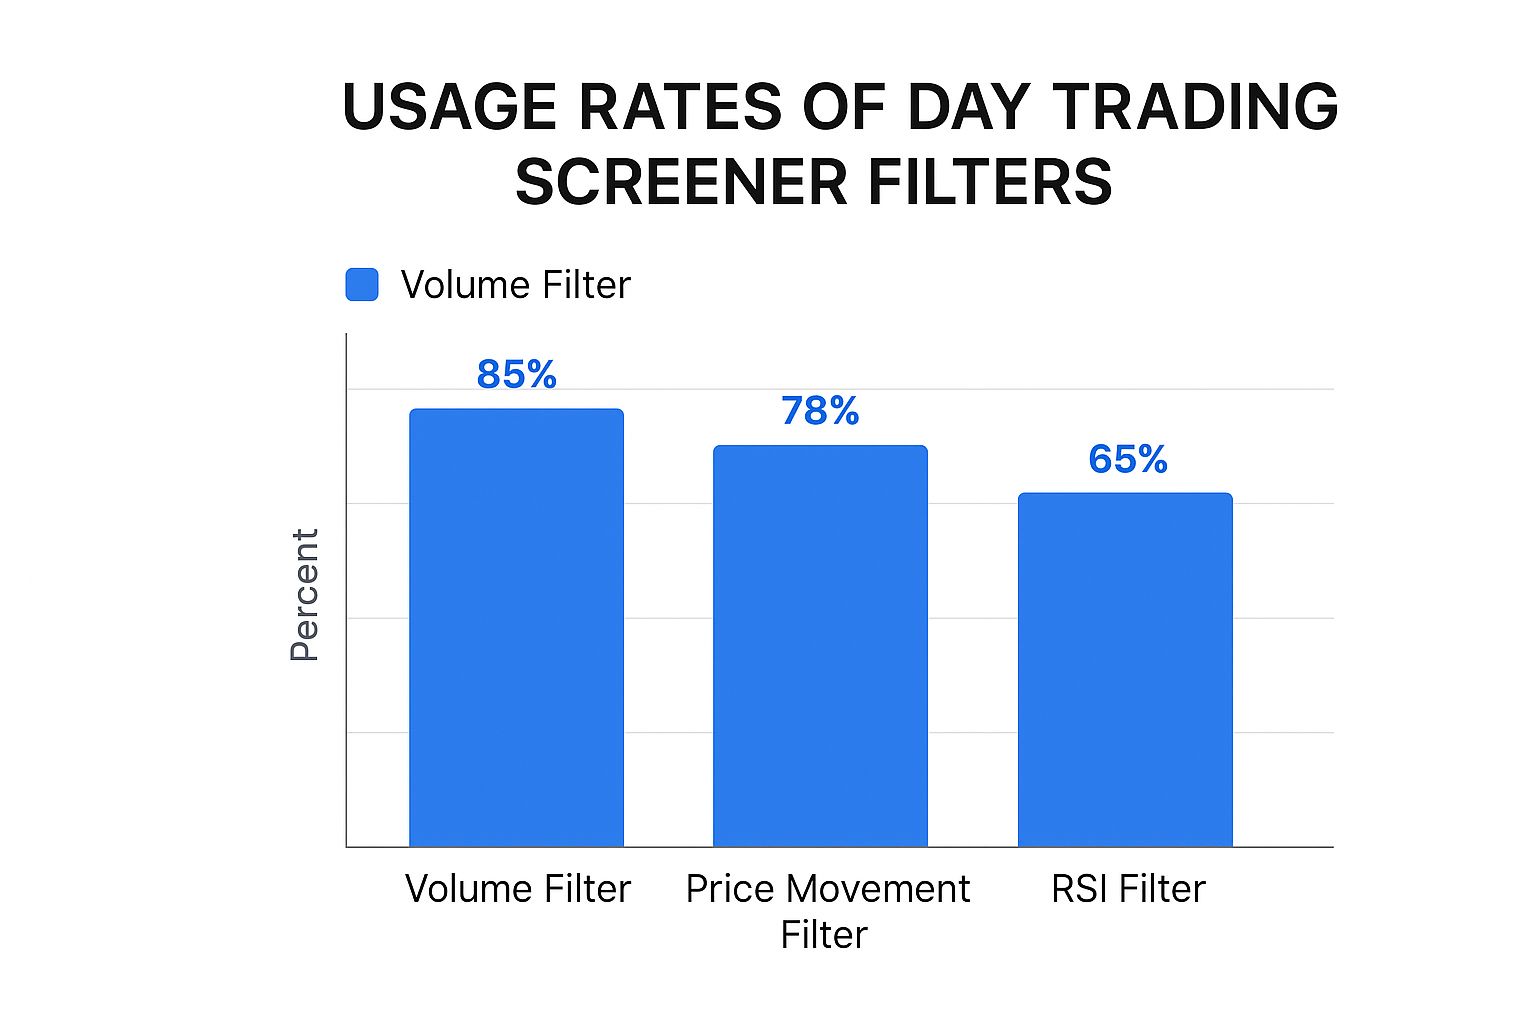
This infographic gives you a quick snapshot of how day traders use some common stock screener filters. A whopping 85% rely on volume filters – makes sense, right? You need to find stocks with enough action to actually make a move. Price movement filters come in next at 78%, and then the RSI (a momentum indicator) at 65%. These are the bread and butter of most day trading setups.
So, you're ready to jump into day trading. Great! But finding the right stock screener can feel like navigating a minefield. Everyone promises amazing features, but when you're in the thick of it, what really counts? From my experience, speed and reliability trump all the fancy bells and whistles. I've watched traders miss out on winning trades simply because their platform lagged or completely froze at the worst possible moment – during high volatility. That's why real-time data quality is king. You absolutely need a platform that's lightning-fast and accurate, especially when the market is moving like a rollercoaster.
Speed and Real-Time Data: The Non-Negotiables
When you're day trading, even a tiny delay in data can cost you. Imagine scalping a stock and relying on a delayed quote. You think you're getting a steal, only to realize the price has already jumped against you. Ouch. This is where real-time data comes in clutch. Look for a stock screener with Level 2 market data. This gives you a detailed view of the bid and ask prices, plus the order book depth. Basically, you get a much clearer picture of where the price is heading and can execute trades with surgical precision.
Another crucial element is the alert system. A solid screener will let you customize alerts based on your specific needs. That means instant notifications when a potential trade pops up, even if you're not glued to your screen 24/7. I personally find alerts for unusual volume spikes and price breakouts super helpful. Oh, and you might also find this article on the top day trading stock scanners useful as you're exploring different options.
Matching the Screener to Your Style
Your trading style plays a big role in which screener you should pick. Are you a scalper grabbing quick, small gains? Or a momentum trader riding bigger waves? Scalpers need a platform that's all about speed and execution, while momentum traders might want more advanced charting tools and technical indicators like those found in TradingView. Don’t just follow the crowd – pick the platform that best fits your strategy. And remember, there are some great budget-friendly options out there that don’t skimp on the essentials. Don't feel pressured to break the bank on a platform stuffed with features you'll never use.
To help you compare some of the top platforms, I've put together a table summarizing their key features for day trading.
To give you a clearer picture of some leading platforms, I’ve put together this comparison table:
Top Stock Screener Platforms Comparison for Day Trading Feature comparison of leading stock screener platforms focusing on day trading capabilities, pricing, and real-time data access
| Platform | Real-time Data | Custom Alerts | Technical Indicators | Monthly Cost | Best For |
|---|---|---|---|---|---|
| Benzinga Pro | Yes | Yes | Yes | $37-$197 | Overall, Real-time News |
| Trade Ideas | Yes | Yes | Yes | $89-$178 | Day Trading, AI |
| Finviz | Limited (Free) | Limited (Free) | Yes | $0-$24.96 | Beginners, Free Option |
| Stock Rover | Near Real-Time | Yes | Yes | $7.99-$27.99 | Fundamental Analysis |
| TradingView | Yes (Paid) | Yes | Yes | $0-$49.95 | Global Markets, Charting |
| TrendSpider | Yes | Yes | Yes | $54-$183 | Technical Analysis Automation |
| TC2000 | Yes (Paid) | Yes | Yes | $8.32-$49.99 | Advanced Charting |
| Simply Wall St | Delayed | Yes | Limited | $0-$20 | Beginners, Visual Analysis |
| Magnifi | Yes | N/A | Limited | $11 | AI Investing |
| Seeking Alpha | Yes | Yes | Yes | Varies | Research, Stock Ideas |
This table highlights the varying strengths of each platform. As you can see, some prioritize real-time data, which is essential for day trading, while others offer more comprehensive fundamental analysis tools or focus on AI-powered insights. Consider your specific needs and budget when making your decision.
Building Your Professional Screening Foundation
Having a top-tier stock screener for day trading is like having a sports car with no engine if you don't know how to configure it. Too few filters and you're drowning in noise; too many, and you’re missing the boat entirely. Believe me, I've learned this the hard way. I remember painstakingly crafting filters, only to discover I'd blocked the very stocks I should have been watching.
The Core Filters: Volume, Price, and Volatility
So, what filters actually matter for day trading? Volume is your first clue. It’s like following the crowd to find the party. It reveals the stocks with enough liquidity to get in and out quickly. I set my minimum volume high enough to avoid the dead-end streets but low enough to catch rising stars. The perfect balance depends on the market and your trading style.
For instance, I might set a minimum volume of 500,000 shares for small-cap stocks and 1 million shares for large-caps. The goal is to find real institutional interest, not just retail chatter. You want to swim with the whales, not the guppies.
Next, consider price. Your price filter reflects your account size and risk tolerance. With a smaller account, focusing on lower-priced stocks lets you take larger positions without risking too much. Larger accounts might prefer higher-priced stocks, typically more stable and less jumpy.
Volatility is the spice of life for day traders. This filter helps you find stocks with enough price movement to make a profit. But, too much volatility can burn you. Start by screening for stocks with an Average True Range (ATR) that fits your style. Scalpers thrive on higher ATRs, while swing traders might prefer a smoother ride with a lower ATR.
Manually checking all these factors used to be a nightmare. Imagine combing through thousands of stocks just to find a handful of potential trades! Thank goodness for modern stock screeners.
Layering Your Filters for Precision Targeting
The real magic happens when you combine filters. Start with a high-volume filter to narrow the field, then use a price filter to match your budget. Finally, add a volatility filter to identify stocks with enough movement to offer opportunities.
It's like using a metal detector: a broad sweep, then gradual refinement until you pinpoint the treasure. This gives you a curated list of potential day trades, saving you valuable time. The goal isn’t to find every trade, but to find the right trades.
With experience, you'll learn to fine-tune your filters to match market conditions and specific trading sessions. Pre-market screening, for example, might use different settings than midday. The key is to continually adjust and maintain a balance between finding opportunities and avoiding information overload. By mastering these core filters, you're building a powerful foundation for consistent and profitable trading.
Technical Indicators That Actually Work In Fast Markets
Let's be honest, technical indicators can be a bit of a minefield. Some day traders plaster their stock screener with every indicator under the sun, while others avoid them altogether. In my experience, both extremes are a recipe for disaster. Too many indicators lead to "analysis paralysis," and ignoring them is like driving with your eyes closed. So, how do you find the right balance?
The Power Trio: RSI, Moving Averages, and Volume
In the fast-paced world of day trading, I rely on a few core indicators that give me clear, actionable signals. First up is the Relative Strength Index (RSI). It's my secret weapon for spotting oversold bounces before the crowd piles in. I keep an eye out for RSI dips below 30. This tells me the stock might be temporarily oversold, presenting a quick profit opportunity. Once you’ve used your stock screener to gather data, you might want to organize and analyze it further using tools like data analysis in Excel.
Next, moving averages are my go-to for identifying trend continuation plays. The 50-day and 200-day simple moving averages (SMAs) are my bread and butter. When a stock trades above these key averages, it usually signals a bullish trend. I look for stocks crossing above these SMAs as potential entry points. Conversely, a cross below can indicate a potential reversal or a shorting opportunity.
Finally, volume is the ultimate truth-teller. Big price moves without accompanying volume are often just deceptive "head fakes." I need to see those volume spikes to confirm a genuine breakout and avoid falling for false signals. A stock breaking resistance on high volume carries much more weight than a low-volume breakout.
Combining Indicators: The Art of Synergy
The real magic happens when you combine these indicators. Picture this: a stock with a low RSI dipping below 30, recently crossing above its 50-day SMA, and showing increasing volume. That's a powerful buy signal. It suggests strong buying pressure and the potential for a substantial upward move.
But be warned, not all indicators play nicely together. Too many conflicting indicators can create a confusing mess. For example, pairing RSI with another momentum indicator like the Moving Average Convergence Divergence (MACD) might give you redundant signals. Understanding the relationships between indicators is crucial for choosing combinations that work synergistically.
Timing is Everything: Adjusting to Market Conditions
Even the best indicators need tweaking based on market conditions and the time of day. Some indicators shine brighter during specific trading sessions. For instance, momentum indicators like RSI can be more reliable during the opening and closing hours when volatility tends to be higher.
You also need to adjust your screener parameters based on overall market volatility. In a wild market, you might need to widen your RSI and volume filters to avoid missing potentially explosive moves. In calmer markets, tighten those filters for more precise entries.
Let's take a look at some of the essential technical indicators and how they can be used most effectively:
| Indicator | Optimal Range | Best Time Frame | Signal Type | Combining With |
|---|---|---|---|---|
| RSI | Below 30 (oversold), Above 70 (overbought) | 5-15 minutes, 1 hour | Momentum | Moving Averages, Volume |
| 50-Day SMA | Price crossing above (bullish), Price crossing below (bearish) | 1 hour, Daily | Trend | 200-Day SMA, Volume, Price Action |
| 200-Day SMA | Price crossing above (bullish), Price crossing below (bearish) | Daily, Weekly | Trend | 50-Day SMA, Volume, Price Action |
| Volume | Spikes on breakouts or reversals | 5-15 minutes, 1 hour | Confirmation | RSI, Moving Averages, Price Action |
This table provides a starting point for incorporating technical indicators into your day trading screener. Remember, these are just guidelines; the best settings will depend on your individual trading style and the specific stock you’re analyzing. The key is to experiment and find what works best for you. By using a combination of indicators and adapting to market conditions, you can significantly improve your odds of success.
Creating Alert Systems That Don't Drive You Crazy
Let's talk alert fatigue. It's a real thing, and it's a killer in the trading world. Think of it like the boy who cried wolf, but instead of a wolf, it's a potential breakout, and instead of a bored kid, it's your screaming stock screener. Eventually, you just tune it out, and that's when you miss the real deal. A smart alert system is essential, particularly when using a stock screener for day trading.
This screenshot from TradeIdeas shows a standard alert setup. See how you can customize alerts based on things like price breakouts or unusual volume?
The real power here is the customization. You're not stuck with pre-set, generic alerts; you're building your own, tailored to your specific strategy.
So, how do you build an alert system that actually helps your trading instead of hindering it? Think progressive alerts.
Imagine casting a wide net initially, with broader filters. Then, as a stock moves through your criteria, the alerts become more targeted, more urgent. For example, an early alert might flag unusual pre-market volume. If that stock then breaks through a key resistance level, bam – a second, more urgent alert goes off. This keeps you in the loop without the constant noise. And remember, solid chart reading skills are fundamental for day traders. If you need a refresher, check out this guide on how to read stock charts.
Managing Alerts Like a Pro
Trading across different time zones? Managing alerts can get tricky. Make sure your platform lets you adjust alert times to your local time. You don't want to be jolted awake at 3:00 a.m. by an alert for the Asian market open!
Consider also how you structure alerts for different market conditions. During high volatility, wider filters might be your friend so you don't miss those big swings. In a quieter market, tighten them up to avoid distractions.
Weekend prep is your secret weapon. Set up your scans and alerts before the market opens. Trust me, it makes a world of difference.
Knowing When to Adjust
Your alert system isn't a "set it and forget it" deal. Regularly review your alerts, and tweak them based on your performance. Are you missing opportunities? Are your alerts firing off too often? Those are your cues to adjust.
The goal is a dynamic system that adapts to the ever-changing market and your evolving strategy. Find the sweet spot between staying informed and avoiding overload. Turn those alerts from a source of frustration into a powerful tool for profitable day trading.
Testing Your Screens Before Risking Real Money
Building a killer stock screener for day trading that looks fantastic is one thing. Building one that consistently delivers winning trades? That's a completely different ballgame. The secret sauce? Backtesting. It’s the critical step so many traders skip, and honestly, it’s where the magic happens. It's your practice run before the real game.
You wouldn’t step onto the court without warming up, right? Same goes for your trading strategy.
Backtesting Without the Headaches
Now, I know the word "backtesting" can sound intimidating, conjuring images of complex coding and expensive software. Let me assure you, that’s not the reality! There are straightforward, practical ways to backtest that anyone can handle. It's simply applying your screening criteria to historical data to see how they would have performed.
Think of it like this: you’re testing a screener for gap-up stocks. Look back at the past six months of data and check how often your screener would have identified a winning gap-up versus a loser. This gives you incredibly valuable information. Are your filters actually working, or are they just window dressing?
Real-World Backtesting Examples
Let’s say you're using a volume filter. Test different volume levels – 500,000 shares, 1 million shares, etc. – and see which historically generated more profitable trades. This data-driven approach takes out the guesswork. It's not about gut feelings; it's about letting the numbers speak for themselves.
I remember backtesting a moving average crossover strategy myself. I tested various combinations – 50-day and 200-day, 20-day and 50-day – and discovered, to my surprise, that the shorter-term moving average crossover performed significantly better under certain market conditions. It was a real eye-opener about the importance of adapting to different market environments.
Spotting Shifting Market Conditions
Backtesting isn't a one-and-done deal. Markets change, and so should your screens. Regular backtesting helps you spot those shifts. A filter that worked wonders during high volatility might underperform in a calmer market. Backtesting reveals these changes, so you can adjust and stay ahead of the game.
Tracking and Improving Your Screens
Think of tracking your screen’s performance over time like keeping a trading journal. It reveals hidden patterns and insights. Which filters consistently deliver winners? Are there specific market conditions where your screens shine or struggle? This data helps you refine your filters and constantly improve.
It’s a constant feedback loop, refining your screens based on real-world results. By embracing backtesting, you build the confidence to trust your screens when real money's on the line, turning your stock screener from a hopeful tool into a powerful, validated trading weapon.
Your Blueprint For Stock Screener Mastery
We’ve talked about the what and why of stock screeners for day trading. Now, let's dive into the nitty-gritty: the how. Consider this your practical guide to actually using a stock screener to up your trading game.
Setting Realistic Expectations and Tracking Progress
Let’s be honest, mastering a stock screener isn't going to happen overnight. There's a learning curve involved, and that's perfectly normal. Don't aim for the "perfect" screen right off the bat. Instead, start with a few core criteria and build from there. Think of it as building a house – you start with the foundation, not the fancy chandeliers.
Focus on making small, steady improvements. Track the quality of your alerts, not just the sheer number of them. A trading journal (TradingView has a great built-in journal feature) can be invaluable here. It helps you see which alerts actually led to profitable trades and which ones were duds. This is how you uncover those hidden patterns and refine your approach.
Troubleshooting Common Screener Problems
Even seasoned traders run into issues with their screeners. One common trap is over-filtering. If you cram in too many criteria, you might miss real opportunities. It's like trying to find a needle in a haystack by removing all the hay – you might end up with no needle at all!
Another issue is alert overload. Too many alerts turn into noise, making it hard to focus on what’s important. Finding the right balance is crucial. You want to stay informed without being constantly bombarded. Experiment with different notification settings; maybe start with email alerts and then gradually incorporate real-time pop-ups as you get more comfortable.
Recognizing Success and Knowing When to Adjust
So, how do you know if your stock screener is actually working? Simple: look for consistent improvement in your win rate. Are you spotting trades you wouldn't have seen otherwise? These are good signs that you’re on the right track.
But remember, even the best screeners need tweaking. Market conditions change, and a screener that worked wonders last month might be less effective now. Regular backtesting and performance analysis are essential. ChartsWatcher offers robust backtesting features. Don’t hesitate to adjust your filters or even completely revamp your screening strategy if needed. Staying adaptable is key.
The road to stock screener mastery is a journey, not a destination. It's all about continuous learning, adaptation, and refinement. By setting realistic goals, tracking your progress, and remaining flexible, you can transform your stock screener from a simple tool into a powerful engine for trading success.
