Trading the Triple Top Chart Pattern
The triple top chart pattern is one of the most reliable bearish reversal signals you can find. When you see it forming after a solid uptrend, it’s a major red flag that the market might be heading for a downturn. It’s made up of three distinct peaks that all hit roughly the same price level, telling you that the buyers are running out of steam.
Think of it as an asset trying to break through a tough ceiling three separate times. That repeated failure to push higher is often the prelude to a significant drop.
Understanding the Triple Top Pattern
Picture a weightlifter trying to press a new personal record but failing at the exact same point on three consecutive attempts. That’s the triple top in a nutshell. It’s a visual story of buying pressure that was once strong enough to drive prices up, but has now hit a wall and is completely exhausted. Each time the price gets rejected from that peak level, the sellers get a little more confident.
This pattern is a classic formation in the world of technical analysis in trading, which is all about using historical price action to get a read on where the market might go next. Learning to spot this particular setup can give you a heads-up on major trend changes before they really get going.
Why This Pattern Matters to Traders
The triple top gives you a clear, visual warning that an uptrend is probably over. For a trader, that’s incredibly valuable information you can act on.
- Protect Your Profits: If you're long a stock and see a triple top forming, it’s a powerful signal to consider taking your profits before a reversal wipes out your gains.
- Spot Shorting Opportunities: For traders looking to profit from a falling market, this pattern offers a high-probability setup to open a short position.
- Sharpen Your Risk Management: The pattern’s structure is clean and well-defined, giving you obvious levels to set your stop-loss orders and profit targets. This is key for disciplined trading.
The triple top isn’t just some random shape on a chart; it’s the story of a battle between buyers and sellers. Those three peaks represent the buyers' final, desperate attempts to stay in control before the sellers take over for good.
The stats back up its importance, too. Research suggests the triple top has a success rate between 65% and 75% in predicting reversals, especially when it's confirmed with other signals like trading volume. A famous example? The S&P 500 Index carved out a classic triple top back in 2000 right before the dot-com bubble burst, leading to a massive decline of over 40%.
Now, let's dive into exactly how to spot, confirm, and trade this powerful signal.
How to Identify the Triple Top Pattern
Spotting a triple top isn't just about finding three random bumps on a chart. It’s about recognizing the pattern's specific anatomy, where each part tells a piece of a story about a dying uptrend. Think of it like a detective checking off clues; the more you find, the more confidence you can have in your case.
First up are the three peaks. These are three clear attempts by buyers to push the price higher, but each time they get smacked down at roughly the same resistance level. They don't have to be perfect, but they should all stall out in a similar price zone. This area becomes a stubborn ceiling the price just can't seem to break.
Between those peaks, you’ll see a couple of pullbacks. These dips are just as important as the peaks themselves, because they form the foundation for the most critical part of the pattern.
The All-Important Neckline
The neckline is simply a straight line connecting the lows of the two troughs that form between the three peaks. This line is the buyers' last line of defense. As long as the price stays above it, the uptrend is still technically alive, even if it's on life support.
But the neckline is also the trigger. A clean, decisive break and close below this support level is your confirmation signal. It's the market's way of saying the sellers have officially taken control and the bearish reversal is on. Understanding how to draw these levels is a core trading skill, and you can dive deeper in our complete guide to stock support and resistance.
The Role of Volume
Volume is the secret ingredient that validates everything the price action is telling you. In a classic, textbook triple top, you'll see trading volume fade with each new peak.
A valid triple top doesn't just show price weakness; it reveals fading enthusiasm. Declining volume on the second and third peaks indicates that fewer and fewer buyers are participating in the rally, making the reversal more likely.
This drop-off in volume is a huge red flag—it shows that the bullish momentum is completely running out of gas. Then, when the price finally cracks below the neckline, you want to see a surge in volume. This spike in selling pressure is the final confirmation that adds a massive degree of confidence to the bearish signal.
This diagram helps visualize how the peaks, neckline, and overall strategy all lock together.
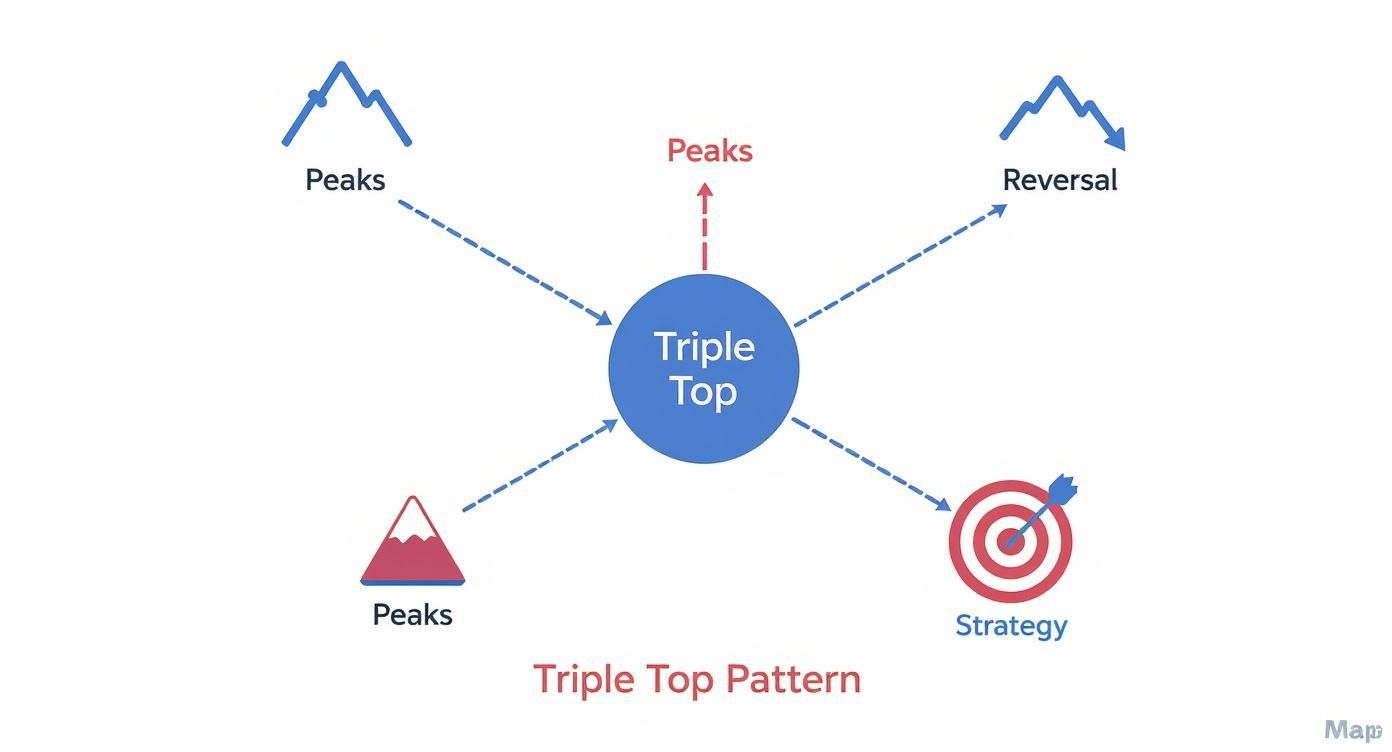
As you can see, the pattern’s power comes from all these elements working in concert, not just from the price action alone.
Putting It All Together: A Quick Checklist
Before we dive into trading tactics, let's create a table that summarizes the key components you need to look for. This isn't just about spotting three peaks; it's about verifying the entire context of the pattern to ensure you're looking at a high-probability setup.
Key Components of a Valid Triple Top Pattern
| Component | Description | What It Signifies |
|---|---|---|
| Preceding Uptrend | The pattern must form after a significant and sustained move higher. | It's a reversal pattern; there must be an existing trend to reverse. |
| Three Peaks | Three distinct highs that form at a similar price level, creating resistance. | Buyers are repeatedly failing to push the price past a specific ceiling. |
| Two Troughs | The pullbacks between the peaks, which form a horizontal support level. | This forms the "neckline" or the critical breakdown point. |
| Declining Volume | Trading volume should ideally decrease on the second and third peaks. | Bullish momentum and buyer participation are weakening. |
| Neckline Break | A decisive close below the support line connecting the two troughs. | Sellers have officially taken control; the reversal is confirmed. |
| Volume on Break | A noticeable increase in volume as the price breaks the neckline. | Strong conviction from sellers, adding validity to the breakdown. |
This table serves as your go-to reference for validating the pattern. If you can confidently check off each of these components, you've moved beyond just identifying a pattern and are on your way to trading a high-quality setup. Knowing how to read cryptocurrency charts and other financial instruments is the foundation for spotting these details effectively.
A Step-By-Step Guide to Trading the Pattern
Spotting the triple top is one thing, but actually trading it profitably? That's a different ballgame. This is where precision and a solid plan come into play, pushing emotion and guesswork to the sidelines.
Here’s a complete framework for trading this pattern, covering everything from the entry trigger to your exit strategy.

The entire trade hinges on one critical moment: a confirmed breakdown below the neckline. Think of this as your green light. It’s the market telling you that sellers have finally wrestled control from the buyers, and the bearish reversal is on.
Let's walk through how to manage this trade from start to finish.
Pinpointing Your Entry Trigger
Once the price slices through the neckline, you have two main ways to jump into a short position. Each one has its own risk profile, so you can pick the one that fits your style.
-
The Aggressive Entry: This is for traders who want to get in on the action fast. You enter the trade as soon as a candle closes decisively below the neckline. The upside? You could catch the entire initial drop. The downside is the higher risk of a "false breakdown," where the price whipsaws right back above support, stopping you out.
-
The Conservative Entry: Patience is the name of the game here. You wait for the initial breakdown, then look for a retest. This happens when the price bounces back up to touch the old support level, which has now flipped into new resistance. Entering your short as the price gets rejected from this level gives you much stronger confirmation and often a better risk-to-reward ratio.
So, which one to choose? An aggressive entry can work well during a high-volume breakdown where the market is moving fast. But in choppier, less certain conditions, the conservative entry is usually the smarter play. Volume is a huge tell here; you can learn more about it in our modern guide to market analysis.
Setting Your Stop Loss for Protection
Let's be clear: solid risk management is non-negotiable. Your stop-loss is your safety net. It defines exactly how much you're willing to lose if the market turns against you, and with the triple top, placing it is pretty logical.
The most common and effective spot for your stop-loss is just above the third peak. This level is the line in the sand. If the price manages to rally all the way back up and break past this peak, the entire bearish setup is invalid. It’s time to get out, protect your capital, and move on.
A well-placed stop-loss isn't an admission of failure; it is a declaration of discipline. It ensures that one bad trade can never wipe out your account, allowing you to trade another day.
Calculating Your Price Target
Okay, you’re in the trade and your stop is set. The final piece is knowing where to take your profits. The triple top gives us a classic, reliable method for this called the "measured move."
It's a simple, two-step calculation:
- Measure the Height: Calculate the distance (in price) from the highest peak of the pattern down to the neckline support.
- Project Downward: Take that same height and subtract it from the point where the price broke the neckline. The resulting price is your minimum price target.
This technique gives you a data-driven goal for the trade, which helps prevent you from either bailing out too early or getting greedy and holding on for unrealistic gains.
The triple top provides a complete trading plan because its structure is so clear. It’s also statistically sound—historical data shows these patterns have a success rate around 70% for signaling reversals. The measured move is a widely accepted practice, too. For instance, if a stock hits a peak at $100 and its neckline is at $80, the pattern's height is $20. Projecting that down from the $80 breakout gives you a price target of $60. This combo of statistical reliability and clear trade rules makes the triple top a true cornerstone strategy for technical traders.
Common Mistakes to Avoid When Trading Triple Tops
Knowing what a triple top chart pattern looks like is a great start. But knowing the common traps that snag even experienced traders is what separates consistent profits from frustrating losses. Too many traders see three peaks forming and jump the gun, only to get steamrolled when the market whips back against them.
Think of the pattern as a story playing out on your chart. The three peaks are just the rising action; the real climax is the confirmed break of the neckline. This section is all about the most common blunders traders make so you can sidestep them and trade this powerful setup with discipline.
Mistake 1: Entering the Trade Too Early
This is, by far, the most frequent and costly error. A trader sees the third peak getting rejected at resistance and immediately hammers the sell button, assuming the reversal is a done deal. That's not a strategy—it's a gamble.
Until that neckline breaks, the uptrend is still technically alive and kicking. The price could easily chop around or even make one last push higher. Jumping in too soon often means getting stopped out by random market noise before the real move even begins. The neckline break is the market's way of officially telling you that the sellers are now in control.
"Patience is a trader's greatest virtue. The triple top tempts you to act on the third peak, but true confirmation only comes with a decisive break of support. Waiting for this signal filters out a significant amount of market noise and false setups."
To fix this, follow one simple, strict rule: wait for a candle to close below the neckline. I'm not talking about a quick wick that dips below and snaps back. You need a confirmed, solid close below that support level. This single act of patience can dramatically improve your hit rate with this pattern.
Mistake 2: Ignoring the Power of Volume
Price action tells you what is happening, but volume tells you how much conviction is behind the move. A triple top that forms on weak or wishy-washy volume is far less reliable. Trading without looking at volume is like trying to read a book with half the pages ripped out—you just don't get the full story.
Specifically, there are two key volume signals that traders often miss:
- Declining Volume on Peaks: In a textbook setup, the trading volume should fade with each new peak. This is a huge clue that buying enthusiasm is drying up, which adds a ton of weight to the bearish argument.
- Surging Volume on Breakout: When the price finally cracks the neckline, you want to see a big spike in selling volume. This is your confirmation that sellers are piling in with force, validating the reversal.
A breakdown on weak volume is a massive red flag. It suggests there's no real muscle behind the sellers, making a "false breakout"—where the price quickly snaps back above the neckline—much more likely. Always make volume analysis part of your trading checklist.
Mistake 3: Confusing a Triple Top with a Consolidation Range
Listen, not every set of three peaks is a true triple top. Sometimes, the market is just moving sideways in a boring consolidation range, gathering energy for its next move—which could be up or down. The key difference is the context.
- A true triple top is a reversal pattern. That means it must form after a clear, established uptrend. If there’s no prior trend to reverse, you're just looking at a directionless range.
- A consolidation range can pop up anywhere. It often lacks the classic declining volume signature and might have a much choppier, less-defined structure.
Before you even think about trading a potential triple top, zoom out on your chart. Was there a solid uptrend leading into it? If the answer is no, you're probably looking at a sideways market, which demands a completely different strategy. Misreading this context is a fundamental mistake that leads traders to take low-probability setups. Stick to patterns with a clear preceding trend, and you’ll automatically filter for higher-quality opportunities.
Real-World Examples of the Triple Top Pattern
Theory and checklists are great, but nothing cements a concept like seeing it play out on a real chart. Watching historical examples is where the abstract idea of a triple top chart pattern becomes a concrete, recognizable signal. This is how you build the muscle memory needed to act decisively when real money is on the line.
We're going to dissect a few examples across different markets—stocks, forex, and crypto. Each one tells the same story: a fierce battle between buyers and sellers where the bears ultimately win, and we can see exactly how it unfolded.
Stock Market Example: A Classic Reversal
Let's start with a textbook stock chart scenario. Picture a hot tech stock that’s been on a tear for months, hitting new highs. Then, it slams into a wall at $150 per share. It pulls back, buyers try again, and it gets rejected at $150. One last push, and it fails at that same level for a third and final time.
There are your three signature peaks. The pullbacks between them create a clean support level—the neckline—around $142. A sharp trader would also notice the volume on the second and third peaks was weaker than the first. That's a huge clue that the buying pressure was drying up.
- The Signal: The stock finally gives up the ghost and prints a big, ugly red candle that closes well below the $142 neckline.
- The Trade: That breakdown is the trigger to go short. The stop-loss goes just above the third peak, maybe around $151, to protect against a snap-back rally.
- The Target: The pattern’s height is $8 (from the $150 peak down to the $142 neckline). Projecting that $8 down from the breakdown point gives a target of $134.
See how every piece of the pattern gives you a clear element of the trading plan? It’s all right there on the chart.
Forex Market Example: Major Currency Pair Breakdown
The forex market is famous for its long, grinding trends, so it serves up some beautiful examples of the triple top. Imagine a major pair like EUR/USD on a daily chart. After a powerful rally, it spends weeks trying to break through a major resistance level, failing three separate times.
The chart below shows a similar setup, where the repeated failures at that price ceiling led to a significant move down.

This kind of visual makes it easy to see the clear resistance level and the critical neckline support. Once that support broke, it was game over for the bulls.
In a real forex trade, you’d want to see that neckline break confirmed by a long bearish candle and a spike in selling volume. A trader could enter a short position on the close of that candle, aiming for a move equal to the pattern's height. When a forex trend turns, it can run for weeks or even months, and this pattern is often the first major warning shot.
The beauty of the triple top is its universality. The principles of supply, demand, and momentum exhaustion are fundamental to all traded markets, from individual stocks to global currencies.
Cryptocurrency Market Example: Volatility and Confirmation
Crypto markets are notoriously volatile, which can make chart patterns look messy and chaotic. But even in the Wild West of crypto, the core structure of a triple top is a powerful signal. Think about Bitcoin (BTC) rallying to a new all-time high. It smacks into $65,000, pulls back, and then makes two more half-hearted attempts to break through.
In a market this wild, confirmation is everything. You have to be strict.
- Wait for a decisive close: Don't get suckered in by long wicks that poke below support. Demand a full candle body to close below the neckline. No exceptions.
- Demand volume confirmation: The breakdown should happen on a massive surge in selling pressure. If the volume is weak, the move is probably fake.
In this scenario, a confirmed break below neckline support could spark a brutally fast decline, which is typical for crypto. The "measured move" price target still works just as well here, giving you a logical place to take profits in a market that can turn on a dime. By sticking to these strict rules, you can filter out the noise and find high-probability setups even in the most volatile environments.
When it comes to trading the triple top pattern, it really all comes down to a few core ideas that mix patient observation with disciplined action. While this powerful signal can be a total game-changer for spotting bearish reversals, its reliability hinges on confirming every single piece of the puzzle before you jump in.
The pattern isn't just three random peaks on a chart; it's a complete story about a trend running out of steam.
Think of the following points as your final pre-flight checklist before entering a short trade. Each one helps validate the story the chart is telling you, turning a potential setup into a high-probability opportunity.
Your Triple Top Trading Checklist
Before you risk a single dollar, make sure the setup you're eyeing checks all these boxes:
-
A Clear Preceding Uptrend: Remember, this is a reversal pattern. For it to mean anything, it has to show up after a solid, sustained move higher. If there's no uptrend, it's not a valid triple top. Simple as that.
-
Three Failed Peaks with Fading Volume: The three highs should stall out at a similar price level, carving out a clear resistance zone. The real tell, though, is seeing volume dry up on the second and third peaks. That’s your sign that the buyers are getting tired.
-
A Confirmed Neckline Break: This is your non-negotiable trigger. You have to wait for a candle to decisively close below the support level that connects the lows between the peaks. A wick poking through doesn't count.
-
Disciplined Risk Management: Always know your exit plan before you enter. Set a firm stop-loss just above that third peak and figure out your price target by using the measured move technique.
The triple top isn't just a signal to sell; it’s a framework for a complete trade. It gives you a logical entry, a clear invalidation point for your stop-loss, and a data-driven target for taking profits.
Work this checklist into your trading routine. Go back and practice spotting these patterns on historical charts until it becomes second nature. A disciplined approach like this is what will give you the confidence to act when a real opportunity appears.
Still Have Questions About the Triple Top?
Even after getting a good handle on the triple top pattern, a few common questions always seem to pop up. Nailing down these finer details is what separates traders who get burned from those who can confidently pull the trigger.
Let's clear the air on the most frequent sticking points.
What’s the Real Difference Between a Triple Top and a Double Top?
On the surface, it’s simple: three peaks instead of two. But the story runs deeper. While both are classic bearish reversal patterns, the triple top is generally considered the more muscular, more reliable signal of the two. Think of it as the market trying to break a key level, failing, trying again, failing, and then giving it one last exhausted shot before giving up.
A double top shows two failed attempts to push higher—a solid sign of weakness. But a triple top shows three. That third failure tells you the overhead resistance is a seriously tough nut to crack and that the buyers have likely thrown in the towel. This often leads to a more dramatic and decisive reversal.
Just How Reliable Is This Pattern, Anyway?
Let's be clear: no chart pattern is a crystal ball. But the triple top is one of the more dependable reversal signals out there, especially when you see other clues lining up with it.
To really stack the odds in your favor, you absolutely must look for confirmation.
- Waning Volume: Ideally, the volume should shrink on each new peak. This is a huge tell, showing that the buying enthusiasm is fizzling out.
- Volume Spike on the Breakdown: When the price finally cracks the neckline, you want to see a big surge in selling volume. This is the market giving a big thumbs-down to the old uptrend.
- A Clear Trend Came First: The pattern means nothing in a sideways, choppy market. It's only a reversal pattern if it forms after a sustained climb.
When these ingredients are present, the success rate climbs dramatically. Trading without them is just gambling on a shape.
Can I Trade This on a 5-Minute Chart? What About a Weekly?
Absolutely. The triple top is fractal, meaning it shows up on all timeframes, from a quick 5-minute chart for day traders to a long-term weekly chart for position investors.
That said, the context is everything. A triple top forming on a weekly or daily chart is a major red flag, often signaling a massive, long-term shift in the market's direction. On a 15-minute chart, it's still a valid setup, but it’s more likely to be a smaller move and is more vulnerable to random market "noise."
No matter the timeframe, the rules of the game are the same: find your three peaks, draw your neckline, and watch the volume.
A triple top on a higher timeframe is a fire alarm screaming about a major market shift. On a lower timeframe, it's more like a quiet tap on the shoulder about a smaller, short-term move.
What Happens When the Pattern Goes Wrong?
When a pattern fails, it can be just as powerful as when it succeeds—just in the opposite direction. A failed triple top happens when the price breaks the neckline, luring in short-sellers, only to snap back violently and rally above it. This is a classic "bear trap."
When you see this, it’s actually a potent bullish signal. The failure to break down shows that buyers stepped in with overwhelming force, absorbed all the selling pressure, and are now in complete control. All those traders who shorted the breakdown are now scrambling to buy back their positions to cut their losses, which just adds more fuel to the upward rocket.
This is precisely why a strict stop-loss, usually placed just above the third peak, isn't just a suggestion—it's essential for survival.
Ready to stop searching for patterns and start trading them? ChartsWatcher provides powerful scanning and backtesting tools to help you find, validate, and act on high-probability setups like the triple top chart pattern across the entire market. Automate your analysis with ChartsWatcher today.
