Trading the Inverted Cup and Handle Pattern
The inverted cup and handle pattern is one of the most reliable bearish signals out there. On a price chart, it looks exactly like its name suggests: an upside-down teacup. When traders spot this pattern, it’s often a sign that a temporary pause in a downtrend is over, and sellers are getting ready to push prices much lower. It's a favorite among short-sellers for good reason—it’s clear, logical, and has a strong track record.
Decoding the Inverted Cup and Handle Pattern
At first glance, a price chart can look like pure chaos. But to a trained eye, patterns start to emerge, telling a story about the battle between buyers and sellers. The inverted cup and handle is a classic tale of sellers dominating, buyers making one last stand, and sellers ultimately winning the war.
Think of it this way: a stock has been falling for a while. Sellers are firmly in control, but eventually, they get a little tired and take a break. This pause doesn't signal a reversal; it's more of a consolidation phase where the price action slowly rounds off, forming a big, upside-down "U" shape. That's your inverted cup.
After the cup is formed, buyers see what they think is an opportunity and try to push the price back up. This effort is usually pretty weak, creating a small, brief upward or sideways drift on the chart—the handle. This handle is critical; it represents the last gasp of bullish hope before the sellers come roaring back.
Why This Pattern Matters to Traders
The inverted cup and handle is much more than just a shape; it’s a visual map of market psychology. It tells you that a period of consolidation is wrapping up and the original bearish trend is about to kick back into gear, often with a vengeance. Traders keep a close eye on it because it provides high-probability short-selling setups.
Here’s why it’s so significant:
- Continuation Signal: It confirms that the underlying bearish sentiment is still the dominant force, despite the brief pause.
- Clear Entry Point: The moment the price breaks below the handle's support level, you have a well-defined trigger to enter a short position.
- Defined Risk: The pattern’s structure gives you a logical place to set a stop-loss order, usually just above the handle, to keep any potential losses in check.
The real magic of the inverted cup and handle is how it cuts through the market noise. It gives you a structured way to identify a point of maximum bearish potential, right when sellers are poised to crush the last of the buying pressure.
For a quick reference, here’s a breakdown of the pattern’s key parts and what they signal.
Inverted Cup and Handle Pattern at a Glance
| Component | Description | What It Signals |
|---|---|---|
| Prior Downtrend | The stock or asset has been in a clear downtrend leading up to the pattern. | Establishes the overall bearish market context. |
| The Inverted Cup | A rounded, "U"-shaped peak forms as sellers take a break and the price consolidates. | A temporary pause in selling pressure; consolidation, not reversal. |
| The Handle | A brief, weak rally or sideways channel forms after the cup. | The final, failed attempt by buyers to regain control. |
| Breakdown | The price falls decisively below the support level formed at the base of the handle. | Confirmation that sellers have retaken control and the downtrend is resuming. |
This table neatly summarizes the story the pattern tells, from the initial bearish mood to the final confirmation signal.
Statistical Reliability and Market Impact
This isn't just chart folklore; there's solid data behind this pattern. Extensive research covering over 556 trades in major markets over two decades found that the inverted cup and handle has an 82% success rate in predicting further price declines during a downtrend. On average, trades based on this pattern saw a 17% drop in price after the handle broke down. You can discover more insights about these findings and how they apply to modern trading.
Understanding this pattern gives you a powerful tool for anticipating market drops. But before you can trade it, you have to get good at spotting its components as they form on a live chart.
Breaking Down the Pattern Stage-by-Stage
Successfully trading the inverted cup and handle means you have to become a bit of a chart detective. Each piece of the pattern tells a part of the story, and you need to spot them in the right order to know if you're looking at a genuine setup or just random market noise. When you learn to dissect its anatomy, you're really learning to read the narrative of seller dominance as it plays out on the screen.
This infographic gives you a bird's-eye view of the pattern's structure, visualizing each critical stage from the initial drop to the final breakdown.
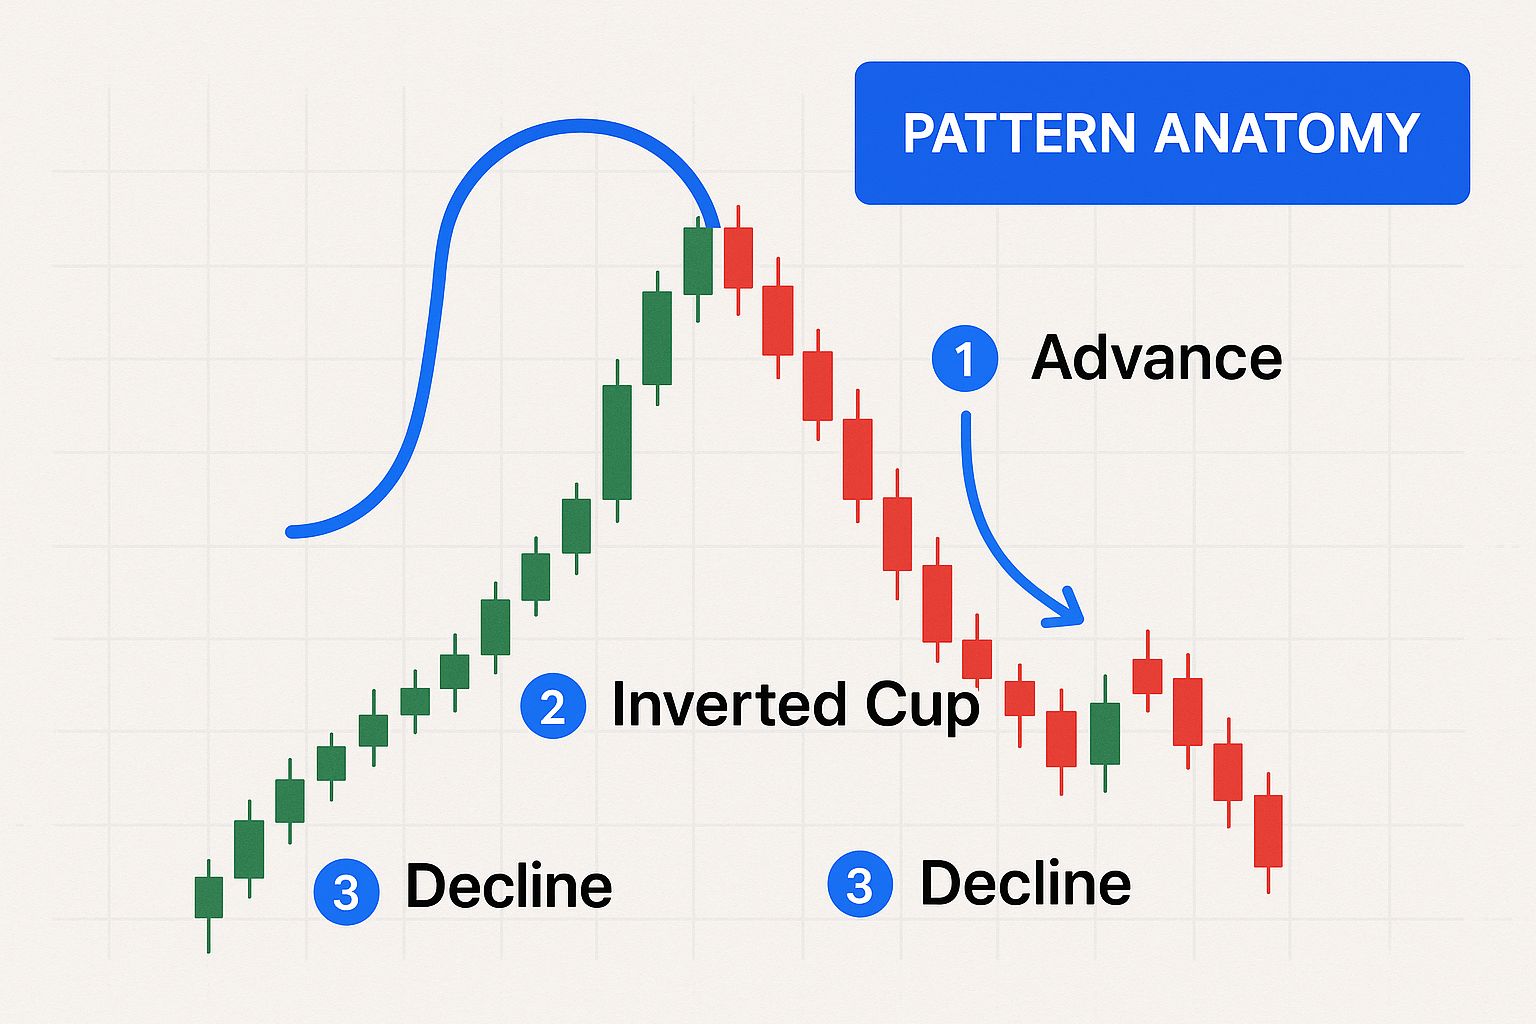
As you can see, the rounded top and the slight upward drift of the handle are the two key visual cues that warn of a coming bearish move.
The Prior Downtrend: Setting the Scene
First things first: the inverted cup and handle needs a backstory. That story is always a pre-existing downtrend. This part is non-negotiable. The pattern is a bearish continuation signal, which means its job is to tell you that an existing downtrend is about to kick off again after a brief pause.
Without that initial downward move, the whole formation is meaningless. Think of it as the opening act of a play—it establishes the main characters (the sellers) and confirms they're already in control of the market.
The Inverted Cup: The Plot Thickens
Next up is the star of the show: the inverted cup. This isn't some sharp, V-shaped spike. You're looking for a distinct, rounded top that resembles an upside-down "U." The curve is everything. It shows a gradual, drawn-out shift in sentiment where sellers are taking a breather.
This rounding-off phase is a period of consolidation. The market is catching its breath, and this part of the formation can take a while to develop, giving you plenty of time to spot it taking shape.
The gentle curve of the inverted cup is a visual sign of seller fatigue followed by pure indecision. It’s the market showing you that while the downward pressure has let up, buyers just don't have the muscle to stage a real reversal.
The Handle: A Glimmer of False Hope
Once the cup is formed, you’ll see a short, weak rally or a bit of sideways action. This is the handle. It represents one last, feeble attempt from buyers to push the price higher before they throw in the towel. The handle usually drifts slightly upward, but look closely—it almost always lacks any real volume or conviction.
This part is a crucial piece of the puzzle. The handle should be noticeably smaller and shorter than the cup. That imbalance is your proof that the buying pressure is too weak to fight the broader bearish trend.
To be considered a reliable signal, the inverted cup usually forms over at least 35 trading days. The handle that follows is a much smaller upward retracement, typically spanning 5-20% above the cup’s low before the price breaks down again. Learn more about these specific criteria to help confirm the pattern's validity.
The Neckline: The Point of No Return
Finally, we have the neckline. This is the trigger point, the line in the sand for your trade. It’s a horizontal support line drawn by connecting the low points on both sides of the cup. For the entire time the pattern forms, this level acts as a floor, holding the price up.
When the price breaks decisively below this neckline, that's your confirmation. It’s the signal that sellers have completely overwhelmed the buyers and are ready to drive the price down with force.
Here’s how it all comes together:
- Prior Downtrend: Establishes the bearish context for the trade.
- Inverted Cup: Shows a consolidation phase where sellers are pausing.
- Handle: Represents a failed rally attempt by exhausted buyers.
- Neckline: Marks the critical support level. A break below it confirms the downtrend is back on.
Once you understand this sequence, you can start to anticipate the market’s next move with much more confidence.
Using Volume to Confirm Your Analysis
Spotting the shape of an inverted cup and handle is a great start, but the real art of trading lies in confirmation. Price action tells you part of the story; volume tells you the conviction behind that story. Without proper validation, a promising setup can quickly turn into a costly mistake. That’s why pros always look for multiple signals before jumping into a trade.
The most critical signal is a decisive breakdown below the neckline—the support level at the base of the handle. When the price slices through this floor, it's a clear sign that sellers have officially won the battle and are taking control. However, a price break alone can sometimes be a false alarm, a "fakeout" designed to trap unsuspecting traders.
This is where trading volume becomes your most trusted ally.
Reading the Volume Story
Think of volume as the fuel powering a market move. A price drop on low volume is like a car rolling downhill with no engine—it might not go very far. But a price drop accompanied by a massive surge in volume? That’s a freight train at full speed. It has momentum, conviction, and a high probability of continuing in that direction.
For the inverted cup and handle pattern, volume should follow a specific narrative:
- During the Inverted Cup: As the rounded top forms, trading volume should ideally be drying up. This shows the initial selling pressure is fading into a period of indecision, not a powerful reversal.
- During the Handle: As the handle forms its slight upward drift, volume should be noticeably low. This is a crucial clue that the buying attempt is weak and lacks any real institutional support.
- During the Breakdown: This is the moment of truth. As the price breaks below the neckline, you must see a significant spike in trading volume. This surge confirms that sellers have returned with force.
The Breakdown and Its Confirmation
The breakdown is the climax of the pattern. The real confirmation happens when the price breaks decisively below the handle’s low—the neckline—with a corresponding surge in trading volume. This volume spike validates the breakdown and signals the downtrend is likely to continue, helping you avoid those nasty fakeouts.
A breakdown without a volume spike is a red flag. It suggests a lack of conviction from sellers and increases the odds that the price will snap back above the neckline, stopping you out. Always wait for both price and volume to agree.
This combination of price action and volume analysis is a cornerstone of technical trading. For a complete overview of this crucial skill, check out our guide on trading with volume and modern market analysis.
What High and Low Volume Truly Mean
Understanding what volume represents in terms of market psychology can seriously sharpen your analysis. Let's break down the signals into clear takeaways.
| Volume Scenario | What It Signals | Trader's Interpretation |
|---|---|---|
| Low Volume on the Handle | Lack of buyer interest; the rally is weak. | The upward move is likely a trap; bears are still in control. |
| High Volume on the Breakdown | Strong seller conviction; institutional participation. | The bearish trend continuation is confirmed; high-probability short entry. |
| Low Volume on the Breakdown | Lack of seller conviction; a potential fakeout. | The move lacks strength; it's wise to wait for more confirmation. |
Ultimately, using volume to confirm the inverted cup and handle pattern transforms your analysis from simple shape recognition into a robust, evidence-based trading strategy. It helps you filter out low-probability setups and trade with greater confidence, knowing that the market's momentum is on your side. Never underestimate the power of volume—it’s the market’s way of showing its hand.
How to Trade the Pattern with Confidence
Spotting the inverted cup and handle is a great first step, but turning that chart pattern into a profitable trade takes a clear, rules-based strategy. Without a solid plan, even the most perfect-looking setup can lead to hesitation and costly mistakes. This is where you shift from just watching the market to actively trading it, armed with a framework for your entry, risk management, and exit.
A disciplined approach is what separates the pros from the amateurs. It helps take the emotion out of your trading, allowing you to act decisively when the pattern gives you the green light. We'll walk through the three non-negotiable decisions every trader must make: finding the right entry point, placing a smart stop-loss to protect your capital, and setting a logical profit target based on the pattern's own geometry.
Pinpointing Your Entry Point
The biggest mistake traders make is jumping the gun. The best place to enter an inverted cup and handle pattern isn't while the handle is still forming. You have to wait for a confirmed breakdown. That means waiting for the price to close decisively below the neckline—the support level that forms the bottom of the handle.
This breakdown is your signal to act. It tells you that the sellers have finally overpowered the last bit of buying pressure from the handle and are now firmly in control. Entering at this point puts the immediate momentum on your side.
To really stack the odds in your favor, look for a significant spike in trading volume as the price breaks down. High volume is a powerful confirmation signal; it shows strong conviction from sellers and lowers the risk of a "fakeout" that could quickly reverse and stop you out of your trade.
Setting a Strategic Stop-Loss
No trading strategy is perfect, and managing your risk is the absolute key to staying in the game long-term. Your stop-loss is your safety net. It defines the maximum amount you're willing to lose on a trade if the market suddenly turns against you.
For the inverted cup and handle, the most logical place to set your stop-loss is just above the highest point of the handle.
Here’s why this spot works so well:
- It follows the pattern's logic: The handle represents the last failed attempt by buyers to push the price up. If the price manages to climb back and break above the handle's peak, the whole bearish idea is wrong.
- It gives you a clear exit signal: A move above the handle shows that buyers have found unexpected strength. That's your cue to get out of the short position before your losses get any bigger.
- It balances risk and reward: Placing it too close risks getting stopped out by random market noise. Placing it too far away exposes you to a massive loss. The area just above the handle is the sweet spot.
Your stop-loss isn't an admission of failure; it is a tool of professional risk management. It protects your capital so you can live to trade another day, which is the ultimate goal.
By setting your stop-loss here, you create a defined, measurable risk for the trade. This lets you calculate your position size correctly, making sure that one bad trade doesn't blow a huge hole in your account.
Calculating Your Profit Target
Okay, so your trade is live and your risk is managed. The final piece of the puzzle is knowing when to take your profits. The inverted cup and handle pattern gives you a classic, built-in method for setting a price target. This isn't guesswork; it's based on the structure of the pattern itself.
The process is simple:
- Measure the Depth: Calculate the vertical distance from the very peak of the inverted cup down to the neckline. This distance shows you the power of the initial sell-off.
- Project Downward: Take that same measured distance and project it downward from the point where the price broke below the neckline.
- Set Your Target: The price level you land on is your minimum profit target for the trade.
Let's say the cup's peak is at $110 and the neckline is at $100. The depth is $10. You would then project a $10 move down from the breakout point at $100, which gives you a profit target of $90. This method provides an objective target based on the pattern's measured move potential. While the price might drop even further, this gives you a high-probability level to lock in your gains.
Of course. Here is the rewritten section, crafted to sound like it was written by an experienced human expert, following all your specified requirements.
Real Chart Examples and Common Mistakes
Theory is one thing, but seeing the inverted cup and handle pattern play out on a real chart is where the rubber meets the road. Let's move beyond clean diagrams and dive into the messy reality of live markets to see how this powerful bearish signal actually unfolds. By looking at real scenarios and picking apart common mistakes, you'll learn to sharpen your eye and separate the high-probability setups from the fakes.
Each example you encounter will have the same core components: the preceding downtrend, that big rounded cup, the flimsy little handle, the neckline, and the all-important spike in volume that screams "breakdown!"
Case Study: A Stock Chart Example
Picture a popular tech stock that's been sliding for weeks. The price finally finds a temporary floor before starting a slow, grinding climb that eventually rolls over, forming a wide, rounded peak over the course of a month. That's our inverted cup. Right after, the stock musters a weak, low-volume rally that lasts maybe five days before fizzling out—there's the handle.
The neckline gets drawn across the low points of the cup, let's say around $150. After the feeble handle forms, the price suddenly cracks below $150 on a massive surge of trading volume. That's the confirmation. Sellers are back in charge, and they mean business. A trader who went short on that break would be in a great position to ride the next leg down.
Avoiding Common Trading Pitfalls
Even traders with years of experience can get faked out by chart patterns. Knowing the common mistakes tied to the inverted cup and handle is just as crucial as knowing what a perfect setup looks like. Getting this right can save you from some seriously costly errors.
Here are the most frequent blunders to watch out for:
- Mistaking a V-Top for a Cup: A sharp, pointy peak isn't a cup. A true inverted cup needs a distinctly rounded top. This shape tells a story of momentum gradually dying out, not a sudden, violent price rejection.
- Ignoring the Prior Downtrend: Context is everything. This is a bearish continuation pattern, which means it needs a downtrend to continue. If the pattern shows up in the middle of an uptrend or a sideways chop, it's not a valid signal.
- Trading Before the Breakdown: This is probably the biggest rookie mistake. Jumping the gun and shorting while the handle is still forming is a recipe for disaster. You have to wait for a clean, decisive close below the neckline—preferably with heavy volume—to confirm the bears are in control.
- Disregarding Volume Signals: A breakdown on light volume is a massive red flag. It shows a lack of conviction from sellers and makes a "fakeout" much more likely. Volume confirmation isn't optional; it's essential.
A valid handle should be a short, weak upward drift. It shouldn't retrace more than half the depth of the cup and should form in a fraction of the time it took the cup to build. You can explore more technical details on this pattern to really nail down the specifics.
Valid Pattern vs Deceptive Look-Alikes
To help you tell the real deal from a dud, here’s a quick guide to distinguishing a true inverted cup and handle from similar, but unreliable, formations. Use this as a mental checklist before you even think about putting capital at risk.
| Characteristic | Valid Pattern | Common Mistake |
|---|---|---|
| Cup Shape | A smooth, rounded top, like an upside-down "U." | A sharp, V-shaped peak that looks more like a sudden rejection. |
| Prior Trend | A clear, established downtrend leads into the pattern. | The pattern appears in an uptrend or a choppy, sideways market. |
| Handle Formation | A brief, weak upward drift on noticeably low volume. | A deep, strong rally that claws back more than half the cup's depth. |
| Breakdown Volume | A significant spike in volume as the price breaks the neckline. | Low or just average volume on the breakdown, signaling weak conviction. |
Once you master these distinctions, you'll stop just seeing shapes on a chart and start understanding the market psychology that creates them. That deeper level of analysis is what separates consistently profitable traders from the crowd.
Automating Pattern Recognition with ChartsWatcher
Let's be honest: manual chart analysis is a grind. As powerful as the skill is, staring at screens for hours trying to spot a developing inverted cup and handle pattern across dozens of markets just isn't an efficient way to find opportunities. You can easily miss the perfect setup simply because you weren't looking at the right chart at the right time.
This is exactly where technology gives traders a serious edge.
Platforms like ChartsWatcher are built to do the heavy lifting for you. Their algorithms automatically scan hundreds of stocks and forex pairs in real-time, flagging potential patterns the moment they start taking shape. This completely flips the script—instead of hunting for trades, you become a strategist, focusing your energy on analyzing the highest-probability setups the machine finds for you.

A dashboard like the one above brings it all together, consolidating alerts and charts so you can get a bird's-eye view of every pattern emerging across the market.
The Benefits of Automated Scanning
Automating pattern recognition isn’t about replacing your trading skills; it's about amplifying them. The advantages are immediate and impactful, saving you a ton of time while cutting down on common trading mistakes.
- Massive Time Savings: Scan the entire market in seconds instead of manually flipping through charts one by one.
- Reduced Human Error: Take fatigue, oversight, and emotional bias out of the equation when identifying patterns.
- Instant Alerts: Get real-time notifications on promising setups so you never miss a beat.
This isn’t just about convenience—it’s about focusing on patterns that work. Research shows that about 62% of inverse cup and handle setups eventually hit their average price target, making it a formation worth your attention. By automating the search, you can find more of these reliable setups across markets you might have otherwise ignored. Our guide on effective stock market pattern recognition for traders dives deeper into how to combine automation with your own analysis.
By automating pattern recognition, you're essentially turning raw market data into actionable signals. This is a core concept behind predictive analytics, where historical data is used to forecast future market movements.
A Few Lingering Questions
Even after you've got the basics down, a few questions always seem to pop up when traders start looking for the inverted cup and handle on live charts. Let's tackle the most common ones to clear up any confusion and get you trading with more confidence.
What Is the Difference Between This and a Regular Cup and Handle?
The simplest way to think about it is they're mirror images of each other. The big difference is in their shape and what they're telling you about the market.
A regular cup and handle pattern looks just like a teacup on the chart. It's a classic bullish continuation pattern, suggesting that after a brief pause, the bulls are getting ready to push the price higher again.
The inverted version is the complete opposite. It looks like an upside-down teacup and is a powerful bearish continuation pattern. When you see this shape, it’s a signal that sellers are just taking a breather before likely driving the price down further.
How Reliable Is This Trading Pattern?
No chart pattern is a crystal ball with a 100% success rate, but the inverted cup and handle is considered one of the more dependable bearish signals out there. Its strength comes from the clear story it tells about market psychology: sellers were in control, they paused, and now they're wrestling back control.
The reliability of this pattern gets a serious boost when you see a clean breakdown below the neckline confirmed by a big spike in trading volume. That surge in volume is your proof that sellers are back with conviction.
To really make it work, you should always combine this pattern with other technical tools and, most importantly, a solid risk management strategy. Never bet the farm on a single signal.
Can I Use This Pattern on Any Timeframe?
Absolutely. That’s one of the best things about the inverted cup and handle—its versatility. You'll spot this pattern forming on just about any chart, from a quick 5-minute timeframe all the way up to weekly or even monthly charts.
But the timeframe definitely matters. A pattern that takes weeks or months to form is generally a much bigger deal. It often leads to a more significant and longer-lasting price move once the breakdown happens. A pattern on a daily or weekly chart typically carries a lot more weight than one that forms and resolves in a few hours on an intraday chart.
Stop hunting for patterns manually and let technology do the heavy lifting. ChartsWatcher automatically scans the market to find high-probability setups like the inverted cup and handle, sending you real-time alerts so you never miss an opportunity. Start your free trial and gain your edge today.
