Effective Stock Market Pattern Recognition for Traders
The Psychology Behind Market Patterns That Repeat
Stock market pattern recognition isn't just about lines on a chart; it's about understanding human psychology. Market patterns often reflect predictable human behaviors, creating opportunities for traders who grasp these underlying dynamics. Fear and greed, two powerful emotions, heavily influence market decisions. Recognizing emotional patterns can be as vital as recognizing chart patterns.
How Human Behavior Drives Market Patterns
Human actions, often driven by emotion rather than logic, create recurring patterns in the stock market. Consider the herd mentality. When a stock rises, others rush in, fearing they'll miss out, driving the price even higher.
The tendency to chase recent performance can lead to inflated valuations and eventual corrections. Understanding these psychological biases can help traders anticipate market turns.
The Role of Institutional Investors
Institutional investors, with their substantial market power, also contribute to recognizable patterns. Their large orders can create noticeable trends and influence market sentiment.
For example, a large institutional sell-off can trigger a cascade of selling by smaller investors, reinforcing a downward trend. This interplay between institutional actions and individual reactions shapes many market patterns.
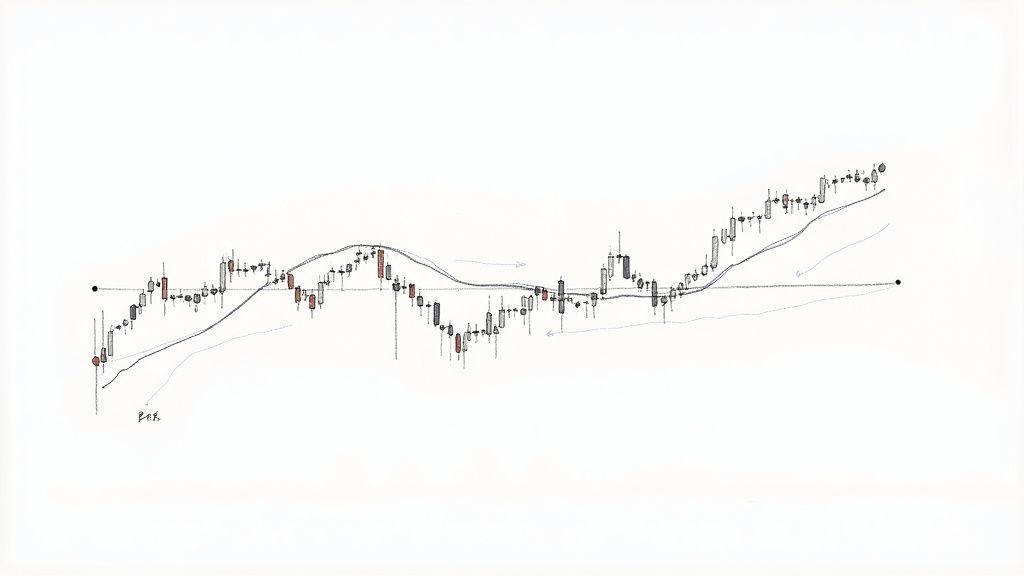
Chart Patterns and Technical Analysis
The use of chart patterns in stock market analysis is another significant element of pattern recognition. Chart patterns, such as the head and shoulders or double top, are frequently used by technical analysts to predict future price movements. A 2007 study indicated that technical trading rules, including chart patterns like the bull flag, could predict market changes and correlate with higher returns. You can explore this topic further at JPMorgan Chase & Co..
Cognitive Biases and Pattern Formation
Cognitive biases, inherent shortcuts in human thinking, further reinforce pattern formation. Confirmation bias, the tendency to favor information confirming existing beliefs, can cause traders to ignore warning signs.
Loss aversion, where the pain of a loss outweighs the pleasure of an equivalent gain, can lead to impulsive decisions. Understanding these biases is crucial for recognizing stock market patterns effectively.
Separating Signal From Noise
Distinguishing genuine signals from market noise is a critical skill for pattern-based trading. Not every fluctuation is a meaningful pattern. A disciplined approach is essential, including statistical analysis, backtesting, and risk management techniques.
By combining an understanding of market psychology with robust analytical tools, traders can improve their ability to identify and profit from repeating stock market patterns.
High-Probability Chart Patterns Worth Your Attention
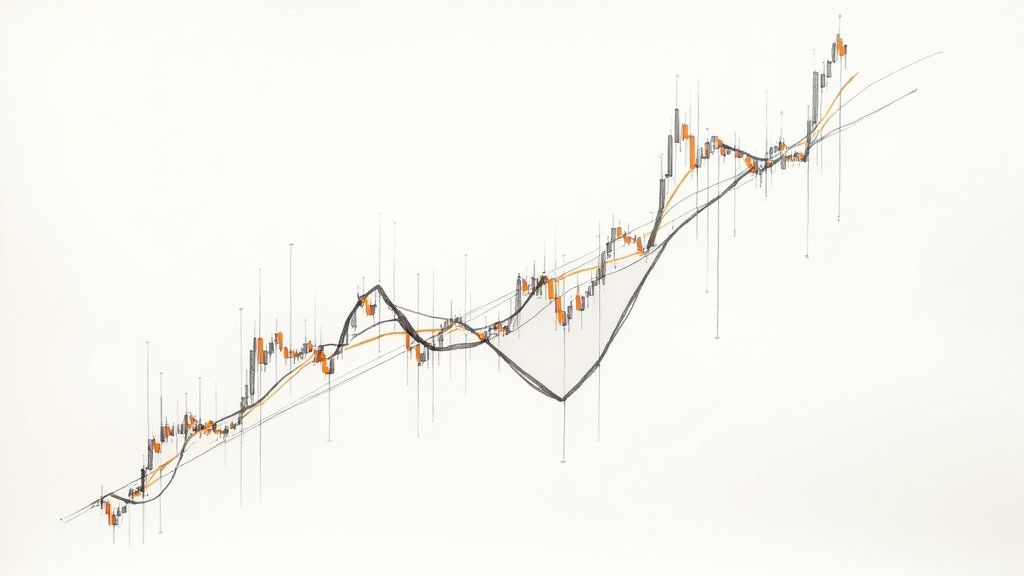
Not all stock market patterns offer the same potential. Some appear more frequently and have higher success rates. Focusing on these high-probability patterns can significantly improve your trading. Let's explore some of the most reliable chart formations, backed by market data.
Identifying True Pattern Completions
Experienced traders analyze charts with a discerning eye. They search for specific characteristics that confirm a pattern's validity. For instance, a head and shoulders pattern isn't just three peaks. It requires declining volume on the "head" (the middle peak) and a decisive break below the neckline. The neckline is a trendline connecting the lows of the two "shoulders".
Volume plays a key role in confirming breakouts. Strong breakouts often coincide with increased volume. Combining price action with volume analysis is crucial for accurate pattern recognition. For a deeper dive into day trading patterns, check out this helpful resource: How to master 8 day trading chart patterns.
Entry Triggers and Profit Targets
Identifying a pattern is only half the battle. Knowing when to enter a trade is equally important. Entry triggers, often linked to candlestick patterns or support/resistance levels, help pinpoint optimal entry points. This allows traders to enter positions strategically.
Profit targets are essential for managing risk and maximizing gains. These targets, derived from pattern dimensions or Fibonacci retracements, help traders exit profitably. A well-defined target allows you to secure profits while limiting potential losses.
Common Pattern Misinterpretations
Even experienced traders can misinterpret patterns. A common mistake is entering a trade prematurely, before a pattern fully develops. This can lead to losses if the anticipated move fails to materialize.
Another pitfall is ignoring the broader market context. A bullish pattern in a bear market may not be as effective. Considering the overall market environment is crucial for successful trading.
Patterns to Prioritize
While numerous patterns exist, some consistently demonstrate reliability. Here are a few examples:
- Head and Shoulders (and Inverse): This classic pattern signals a potential trend reversal.
- Double Tops and Bottoms: These formations indicate potential trend changes at key support and resistance levels.
- Triangles (Symmetrical, Ascending, Descending): Triangles often precede breakouts after periods of consolidation.
- Flags and Pennants: These patterns suggest a brief pause within a trending market.
These patterns are not foolproof. However, their frequent occurrence and relatively high success rates make them worth focusing on.
To further illustrate the effectiveness of various chart patterns, let's look at a comparison table:
Effectiveness of Common Chart Patterns
A comparison of success rates and potential returns for the most reliable stock market chart patterns based on historical data
| Pattern Type | Success Rate | Average Return | Optimal Timeframe | Risk Level |
|---|---|---|---|---|
| Head and Shoulders | 65% | 10-15% | Medium-Long Term | Medium |
| Double Tops and Bottoms | 70% | 5-10% | Short-Medium Term | Low |
| Triangles (Symmetrical) | 60% | 15-20% | Medium Term | Medium |
| Flags and Pennants | 75% | 5-8% | Short Term | Low |
This table provides a general overview. Actual results can vary based on market conditions and individual trading strategies. Focusing on patterns with higher success rates and managing risk effectively is key to profitable trading.
Distinguishing Real Patterns from Illusions
The stock market is full of noise. Not every swing high or low forms a pattern. Consider factors like volume, the prevailing trend, and support/resistance levels.
By incorporating these factors, you can filter out noise and identify high-probability setups. This selective approach is essential for consistent trading success.
How AI Is Transforming Pattern Recognition Trading
The intersection of artificial intelligence (AI) and stock market pattern recognition offers exciting new tools for traders. Leading funds and individual investors are increasingly using machine learning to find complex patterns, often invisible to the human eye. This data-driven approach allows for more informed trading decisions.
Uncovering Hidden Correlations with Neural Networks
A key application of AI is using neural networks to find subtle correlations within large datasets. Inspired by the human brain, neural networks can process massive amounts of data to identify non-linear relationships between market variables.
For example, a neural network might analyze historical price data, news sentiment, and social media activity to predict future price movements. This means AI can process information from a variety of sources for more comprehensive market insights. Read also: How to master technical analysis.
Algorithmic Advances in Pattern-Based Trading
Several algorithms show particular promise for pattern-based trading. Support Vector Machines (SVMs) excel at classifying data points. They can be used to identify specific chart patterns, like head and shoulders or double tops.
Random Forests, which combine multiple decision trees, effectively handle noisy data and identify non-linear patterns. These developments in AI and machine learning are changing the way traders approach pattern recognition. Stock market pattern recognition has grown more sophisticated with the use of machine learning (ML) techniques.
One key application of ML is analyzing historical price and volume data to identify patterns, trends, and seasonality in stock prices. Time series forecasting models like ARIMA and LSTM are commonly used to predict future price movements based on past trends. Find more detailed statistics here: Intrinio.
Practical Applications for Traders
Using AI in trading doesn't require a computer science degree. Many platforms offer user-friendly tools for implementing AI-driven strategies. Some platforms, for instance, provide pre-built algorithms that traders can customize and apply to their charts. This allows traders to access the power of AI without extensive coding.
AI can automate tasks like pattern scanning and backtesting. This frees up traders to focus on higher-level strategy development. This automation increases efficiency and allows for better strategy testing and refinement. It's important to remember, however, that AI is a tool, not a guaranteed solution. Human judgment is still vital.
The Limits of AI in Trading
While AI offers significant advantages, it’s important to acknowledge its limits. AI algorithms are trained on historical data, which may not always reflect future market behavior. AI can also be susceptible to overfitting. This means it learns the training data too well and may struggle with new data.
Unexpected market events, like “black swan” occurrences, can also disrupt AI models. These are low-probability, high-impact events that historical data can’t predict. Human oversight and critical thinking remain essential for interpreting AI’s output and making informed trading decisions. This combination of AI and human expertise is likely the future of pattern recognition trading.
Measuring What Actually Works in Pattern Trading

Identifying patterns is just the first step. The real challenge lies in measuring how effective those patterns truly are. This requires a deeper understanding of key metrics that distinguish genuine success from mere market noise. This is the dividing line between serious traders and those relying on luck.
Key Performance Metrics: Beyond Win Rates
While win rate provides a basic overview, it's not enough for serious stock market pattern recognition. Experienced traders understand the importance of metrics like maximum drawdown, which represents the largest peak-to-trough decline over a given period. This helps assess the inherent risk of a specific strategy.
The Sharpe ratio, another crucial metric, compares the return of an investment against its risk. A higher Sharpe ratio generally indicates a better risk-adjusted return. This balance of risk and reward is essential for long-term trading success.
Furthermore, the Calmar ratio measures the average annual return relative to the maximum drawdown. This provides an additional layer of risk assessment, highlighting the balance between profitability and potential losses.
Backtesting and Optimization Pitfalls
Backtesting—evaluating a strategy against historical data—is crucial for pattern recognition. However, over-optimization, where a strategy performs exceptionally well in backtests but fails in live trading, is a common pitfall. This happens when a strategy is too closely fitted to past data.
Walk-forward analysis is a technique used to mitigate this risk. It involves testing a strategy on one data segment and then validating it on a separate, unseen segment. This helps ensure the strategy's robustness and adaptability to real-world market conditions.
Progressive Testing Frameworks
Before committing significant capital, professional traders often utilize progressive testing. This involves gradually increasing capital allocation as a strategy demonstrates consistent profits. Starting with a small account and gradually increasing the investment helps manage risk during live market testing.
This measured approach allows for refinement and builds confidence in the long-term viability of a stock market pattern recognition system. It's a careful and systematic approach to developing a robust trading strategy.
A candlestick pattern recognition model, PRML, using four machine learning methods (logistic regression, k-nearest neighbors, random forest, and restricted Boltzmann machine), achieved an average annual return of 36.73% when tested on Chinese market stocks from 2000-2020. The model also achieved a Sharpe ratio of 0.81 and an information ratio of 2.37. You can explore the full research at the National Center for Biotechnology Information.
Adapting to Changing Market Dynamics
Market conditions are constantly in flux, which impacts pattern reliability. Robust evaluation systems account for these changes by incorporating adaptive parameters and continuous performance monitoring. This adaptability is particularly critical in volatile markets where patterns shift rapidly.
Key Performance Metrics for Pattern Trading Systems
Essential metrics for evaluating the effectiveness of pattern recognition trading strategies
The following table summarizes the key performance indicators for evaluating trading systems based on pattern recognition.
| Metric | Description | Target Range | Warning Signs |
|---|---|---|---|
| Win Rate | Percentage of winning trades | >50% | Consistently below 50% |
| Maximum Drawdown | Largest peak-to-trough decline in portfolio value | <20% | Frequent or large drawdowns |
| Sharpe Ratio | Risk-adjusted return, comparing return to volatility | >1.0 | Below 1.0 or negative |
| Calmar Ratio | Return relative to maximum drawdown, emphasizing risk-adjusted performance | >2.0 | Below 1.0 |
| Profit Factor | Gross profit divided by gross loss | >1.5 | Below 1.0 |
| Expectancy | Average profit per trade considering win rate and average win/loss amounts | Positive | Negative or close to zero |
This table provides a valuable framework for assessing the performance and reliability of pattern-based trading strategies. By focusing on these metrics and adapting to changing market conditions, traders can develop robust pattern recognition systems for sustained success. This requires a commitment to continuous evaluation and refinement.
Constructing Your Pattern Recognition Trading System
Let's move beyond the theoretical and delve into the practical steps of building a robust trading system based on stock market pattern recognition. This involves weaving together different elements into a comprehensive strategy. This section gives you the foundation for creating your own system.
Combining Pattern Signals With Complementary Indicators
Identifying chart patterns is a good start, but adding other technical indicators can substantially improve your trading system. For instance, using the Relative Strength Index (RSI) with a head and shoulders pattern can verify momentum changes and provide clearer entry and exit signals.
Additionally, using moving averages can help smooth out market fluctuations and confirm the trend direction. This increases the likelihood of a profitable trade. These supporting indicators add extra layers of validation to your pattern-based signals.
Volume Analysis: Confirming Pattern Validity
Volume plays a significant role in validating the authenticity of a pattern. A decisive breakout from a triangle pattern coupled with high volume lends credibility to the move, indicating increased trader confidence. In contrast, low volume during a breakout may point towards a false signal.
Therefore, analyzing volume in conjunction with patterns can help differentiate genuine breakouts from misleading price action. Including volume in your analysis is vital for accurate pattern recognition.
Adaptive Position Sizing Based on Pattern Confidence Levels
It's important to remember that not all patterns are equal. Some setups have higher probability and potential profit compared to others. Using adaptive position sizing, where you allocate more capital to higher-conviction setups, optimizes resource allocation and improves risk-adjusted returns.
This involves evaluating a pattern's strength based on factors like volume, breakout confirmation, and general market conditions. Adjusting position size according to your confidence level effectively manages risk and boosts your profit potential.
Rules-Based Entry and Exit Protocols
Emotional decision-making often disrupts consistent trading. Establishing clear, rules-based entry and exit protocols eliminates emotional bias and maintains objectivity. This means defining your entry triggers, profit targets, and stop-loss levels beforehand, based on your pattern recognition strategy.
This approach enables decisive action without hesitation or doubt. It fosters discipline and consistency, two cornerstones of trading success.
Automating Pattern Scanning and Maintaining Quality Control
ChartsWatcher enables automated pattern scanning while maintaining quality control. The platform’s filtering options let you search for specific patterns and set alerts based on your criteria. This saves valuable time and ensures that you don't miss any promising opportunities.
Although automation is helpful, regular review is important. Verify the quality of the identified patterns and adapt your scanning criteria as market conditions evolve.
Systematically Tracking Performance and Continuous Refinement
Tracking performance goes beyond simply counting wins and losses. It's about understanding the reasons behind your trade outcomes. Meticulously document your trades, analyze the results, and pinpoint areas for improvement.
Regularly refining your stock market pattern recognition system based on performance data and market feedback is key for long-term success. This iterative process allows you to adjust to changing market dynamics and enhance your approach, ensuring your system remains effective and profitable.
Pattern Recognition Pitfalls That Drain Trading Accounts
Recognizing patterns in the stock market can be incredibly profitable. However, it's also a risky endeavor. Even experienced traders can fall into common traps that can severely damage their trading accounts. This section explores some of these pitfalls and offers strategies to avoid them.
The Danger of Seeing What Isn't There: Psychological Biases
One of the biggest challenges in stock market pattern recognition is our natural tendency to see patterns where none exist. Our brains are wired to find order and connections, even in random data. This can lead to confirmation bias, where we focus only on information that confirms our existing beliefs about a pattern and ignore conflicting evidence. For example, a trader convinced of an upcoming uptrend might dismiss bearish signals as insignificant.
Emotional biases, such as the fear of missing out (FOMO) or the desire to recover losses, can also cloud our judgment. These emotional influences can lead to impulsive trading choices based on imagined patterns.
Overfitting: The Trap of Historical Data
Overfitting historical data is another frequent pitfall. This happens when a trader designs a trading system based on past market behavior that performs well in backtests but fails in live trading. It's like memorizing past exam answers instead of understanding the underlying concepts.
The system becomes too specific to a particular historical period and can't adjust to new market conditions. This is especially common with AI-driven systems.
The Shifting Sands of Market Patterns: Why Reliable Patterns Fail
Stock market patterns aren't fixed. Market dynamics constantly change due to several factors, including economic news, geopolitical events, and shifts in investor sentiment. A pattern that worked well in the past might suddenly become ineffective. For instance, a specific candlestick pattern might reliably predict breakouts during high market volatility but become less predictive during periods of consolidation. This highlights the need for constant testing and adaptation.
Strategies for Staying Objective and Avoiding False Patterns
Successful traders recognize these pitfalls and use strategies to minimize their impact. Objectivity is key. This means questioning your assumptions, considering opposing viewpoints, and being willing to admit when you're wrong. A useful technique is to create a set of objective rules for identifying and trading patterns, instead of relying on intuition.
Validation Safeguards and the Importance of Discipline
Implementing validation safeguards is essential. This includes techniques like walk-forward analysis, where you test your trading system on one part of historical data and then validate it on a separate, unseen part. This helps determine if your system is truly effective or just overfitted to the past.
Discipline is also critical. Even with the best pattern recognition system, emotional impulses can lead to expensive mistakes. Following your predefined trading plan, even when faced with tempting deviations, is essential for long-term success.
Practical Strategies for Testing Pattern Reliability
Testing pattern reliability requires a methodical approach. One effective strategy is analyzing a large set of historical data and calculating the success rate of a specific pattern. This involves tracking how often the expected price movement occurs after the pattern forms.
Calculating the average return associated with the pattern helps you determine its potential profitability. This involves calculating the average percentage gain or loss on trades based on the pattern. Finally, consider the optimal timeframe for the pattern. Some patterns work better on short-term charts, while others are more effective on longer timeframes.
Adapting to Evolving Market Conditions
Markets are dynamic, and your stock market pattern recognition approach should be too. Continuously monitoring your system's performance and adapting to changing market conditions is vital for staying ahead. This might involve adjusting your entry and exit rules, refining your pattern recognition criteria, or even adding new patterns to your system.
Adaptability is a key trait of successful traders. Staying informed about market trends and being willing to adjust your approach is essential for long-term profitability. By combining an understanding of psychological biases, thorough backtesting, and adaptive strategies, you can significantly improve your chances of success in stock market pattern recognition.
The Future of Stock Market Pattern Recognition
Stock market pattern recognition is in constant flux. As technology progresses, new tools and methods are changing how traders find and profit from market patterns. This section explores emerging trends likely to shape the future of pattern-based trading.
Quantum Computing: Enhanced Pattern Detection
Quantum computing, though still developing, has the potential to significantly improve pattern detection. Its immense processing power could analyze massive datasets, far beyond the capabilities of current computers. This could uncover subtle and complex patterns currently hidden.
For example, quantum computers might identify correlations between seemingly unrelated market factors, leading to new trading strategies. However, using quantum computing in finance is still largely theoretical.
Alternative Data: New Pattern Insights
Integrating alternative data sources creates exciting opportunities for pattern traders. Data from social media sentiment, satellite imagery, and consumer spending offers unique market perspectives.
Combining this data with traditional market data reveals new patterns and competitive advantages. This allows traders to better grasp market dynamics and predict price movements.
Explainable AI: Increasing Transparency
While AI offers many advantages, understanding its decision-making process is vital. Explainable AI (XAI) models address this by offering insights into how algorithms reach conclusions.
This transparency builds trust and illuminates the limits of AI-driven pattern recognition. XAI allows traders to assess signal validity and manage risk more efficiently, fostering confidence in the technology.
Human Skills: Maintaining Importance
Despite technological advances, core human skills remain invaluable. Critical thinking, risk management, and adaptability are crucial for interpreting data and making sound decisions. These skills complement AI's analytical abilities.
Traders who combine technological proficiency with strong analytical and decision-making skills will be most successful. This blend of human and artificial intelligence creates a powerful partnership.
Democratization of Pattern Tools: Expanding Access
Increasing access to pattern recognition tools is shifting market dynamics. More traders now access sophisticated software and data analysis platforms, creating a more level playing field and increasing market participation.
This democratization could lead to greater market efficiency and new trading opportunities. However, it also highlights the importance of continuous learning and adaptation to stay competitive. Staying current with the latest tools and techniques is essential.
Practical Steps for Success
To thrive in this evolving environment, traders should develop a comprehensive understanding of both traditional and new pattern recognition techniques. This involves staying informed about technological advances and constantly refining skills.
A data-driven approach and effectively interpreting and analyzing market data are also crucial. Finally, a strong risk management framework is essential to mitigate losses and protect capital. This necessitates both theoretical knowledge and practical experience.
Ready to improve your stock market pattern recognition? ChartsWatcher provides the tools and features you need to identify and capitalize on profitable patterns. Explore the platform and discover how it can enhance your trading strategy: Visit ChartsWatcher Now
