Trading Bullish Engulfing Patterns a Guide
When a chart tells a story, some chapters are more exciting than others. A bullish engulfing pattern is one of those page-turners—a powerful two-candle signal that screams a potential plot twist is coming, shifting the narrative from a downtrend to a potential uptrend.
This pattern shows up when a big, bold bullish candle completely "engulfs" the body of the smaller bearish candle that came right before it. Think of it as a sudden, dramatic power shift where the sellers lose their grip, and the buyers storm the field.
Understanding the Bullish Engulfing Pattern

Imagine a tug-of-war between sellers (bears) and buyers (bulls). For a while, the bears are winning, dragging the price down. That's your downtrend. But then, in a single move, the bulls dig in their heels and yank the rope back with overwhelming force.
That's the essence of the bullish engulfing pattern. It’s a visual snapshot of a sudden, decisive change in market sentiment. The pattern itself is made of two distinct candles you'll find at the bottom of a downtrend:
-
Candle 1: The Bearish Setup. The first candle is bearish (red or black), confirming that sellers were still in control, pushing the price down. Often, this candle is on the smaller side, hinting that the sellers' momentum might be fading.
-
Candle 2: The Bullish Takeover. This second candle is the real star. It's a large bullish candle (green or white) that opens at or below the previous candle's close and closes way above its open. The defining feature is that its body completely swallows, or "engulfs," the body of the first candle.
This engulfing move is a crystal-clear signal. It shows that buyers didn't just absorb all the selling pressure from the prior period—they steamrolled it and established a whole new level of demand. It's the market's way of shouting that the bears are exhausted, and the bulls have taken charge.
The Anatomy of the Pattern
Spotting these patterns correctly is more than just finding two candles of opposite colors. A valid pattern needs the right context and structure to be reliable. The most important piece of context? A preceding downtrend. This is a reversal signal, so it needs a trend to reverse.
A true bullish engulfing pattern tells a story of reversal. The first candle shows sellers are still in control, but the second, larger candle reveals that buyers have entered the market with enough force to absorb all selling pressure and drive prices higher, signaling a potential bottom.
This formation is a two-candle reversal where a strong bullish candle completely smothers the body of the bearish one before it. Some analyses have found this pattern can have a success rate upwards of 70%, especially when it appears after a solid downtrend of at least three bearish candles. Context is king, and that kind of setup makes the signal much stronger. You can discover more insights about candlestick pattern reliability and learn why it's so important.
To help you get a feel for this pattern, the table below breaks down the key features of each candle. Think of it as a quick-reference guide for spotting this setup on your charts.
Anatomy of a Bullish Engulfing Pattern
| Component | Candle 1 (Bearish) | Candle 2 (Bullish) |
|---|---|---|
| Color | Red (or Black) | Green (or White) |
| Context | Appears during a downtrend | Follows the bearish candle |
| Body Size | Typically smaller | Must be larger than Candle 1's body |
| Key Action | Shows selling momentum is potentially weakening | Opens at or below Candle 1's close, closes above Candle 1's open |
| Signal | Confirms the downtrend is still active... for now | "Engulfs" the previous body, signaling a strong buyer takeover |
By getting these individual components down, you’ll be much better at telling a genuine, high-probability signal from simple market noise. That's the first step toward making smarter, more informed trading decisions.
Reading the Psychology Behind the Reversal
A bullish engulfing pattern isn't just a shape on a screen; it’s a story about a sudden and dramatic shift in market sentiment. If you want to really understand why this pattern is such a potent reversal signal, you have to get inside the heads of the traders involved. It’s a classic two-act play, unfolding over just two candles.
Act one begins with the bears firmly in charge. The small, red candle shows sellers confidently pushing the price down, just like they have been. At this stage, everything looks normal for a downtrend. Sentiment is negative, and most people assume the slide will continue.
Then comes the plot twist. The second candle, a massive green one, shows buyers storming the market with overwhelming force. They didn't just halt the decline; they completely wiped out the previous day's losses and then some, pushing the price significantly higher. This isn't a gentle recovery—it’s a power move.
From Seller Confidence to Buyer Dominance
This lightning-fast transition from bearish control to bullish dominance is the heart of the pattern's psychology. The first candle is really the last gasp of the sellers. Traders are still shorting the asset, thinking the downtrend has more fuel in the tank.
But that second candle is a brutal reality check. It traps all those late-to-the-party sellers in losing positions and flashes a bright green light for buyers who were waiting on the sidelines for a bottom. This powerful move creates a sense of urgency, often triggering a stampede of new buying activity.
This psychological whiplash is what makes the bullish engulfing pattern so effective. It’s the exact moment when seller momentum dies out and a new, aggressive wave of buyers takes over, creating a high-probability setup for a reversal.
Think of the sheer size of that bullish candle. It's a visual billboard screaming that the buying pressure wasn't just enough to absorb all the selling—it was strong enough to establish a new, higher price level with authority.
What This Shift Signals to Traders
This sudden change in market mood sends a few clear messages that smart traders are always looking for. It suggests the market’s perception of the asset's value has fundamentally changed in a very short amount of time.
You can break this shift down into a few key takeaways:
- Seller Exhaustion: The downtrend has run out of gas. Anyone who wanted to sell has likely already sold, leaving very little downward pressure.
- Aggressive Buying: That big green candle isn't just passive interest. It shows buyers are actively and aggressively scooping up positions at these lower prices.
- A Potential Low is Set: The bottom of the engulfing candle often becomes a critical support level. Buyers have proven they are willing to step in and defend this price, making it a new floor for the market.
Ultimately, the bullish engulfing pattern is a story of a power struggle where the balance tips decisively. By reading the psychology behind the candles, you move beyond just seeing shapes and start to understand why it signals the old downtrend may be over and a new uptrend is about to begin.
How to Spot and Validate Bullish Engulfing Patterns
Moving from theory to the trading floor is where the pros separate themselves from the amateurs. It’s one thing to spot what looks like a bullish engulfing pattern, but it's another thing entirely to validate it and avoid the fakes that can drain your account. A disciplined, confirmation-first approach is your best defense against false signals.
Think of it like being a detective. A single clue is interesting, but it doesn't solve the case. You need supporting evidence—fingerprints, witness statements, a motive—to build a strong conviction. In trading, a bullish engulfing pattern is a powerful clue, but you need more evidence before you risk your hard-earned capital.
The Identification Checklist
Before you even think about confirmation, you have to make sure the pattern itself is the real deal. Not every big green candle next to a little red one makes the cut. Use this checklist to filter out the weak setups and focus only on the signals that matter.
-
1. A Clear Preceding Downtrend: This is non-negotiable. A bullish engulfing pattern is a reversal signal. For it to reverse something, there has to be an existing downtrend. Look for a clear series of lower highs and lower lows leading into the pattern.
-
2. A Small Bearish Candle: The first candle of the pattern needs to be red, showing that sellers were in control. Its smaller size is often the first hint that the selling pressure is starting to fizzle out.
-
3. A Large Bullish Candle: The second candle must be green. Its entire job is to scream that overwhelming buying power has just entered the scene.
-
4. The Engulfing Action: This is what defines the whole pattern. The body of the second (green) candle has to completely "engulf," or swallow, the entire body of the first (red) candle. This means the green candle opens at or below the red one's close and closes way above its open. If you need a refresher on how these candles work, our guide to understanding candlestick graphs is a great place to start.
Only when a setup ticks all four of these boxes should you move on to the most important part: validation.
Confirmation: The Key to Avoiding Traps
Spotting the pattern is only half the battle. Confirmation is how you stack the odds in your favor by looking for other signs that buyers are truly taking over. A naked pattern without any backup is a low-probability trade, plain and simple.
Here are three confirmation techniques I never trade without:
-
Surging Volume: Volume is the fuel that moves the market. A real bullish reversal should come with a big spike in trading volume on the day the engulfing candle forms. High volume tells you that a lot of traders were involved in the upward push, signaling strong conviction.
-
Indicator Confirmation: Technical indicators can give you fantastic context. The Relative Strength Index (RSI) is one of the best for this. If you see a bullish engulfing pattern while the RSI is climbing out of "oversold" territory (usually below 30), it's a strong sign that the downward momentum was exhausted and a bounce was due.
-
Price Action Follow-Through: Sometimes, patience is your best strategy. Instead of jumping in the second the engulfing candle closes, wait to see what the next candle does. If the following candle also closes higher, it confirms that buyers are still in control and the reversal has some legs.
This visual below breaks down a simple, three-step process for putting these ideas into action, from spotting the pattern to pulling the trigger.
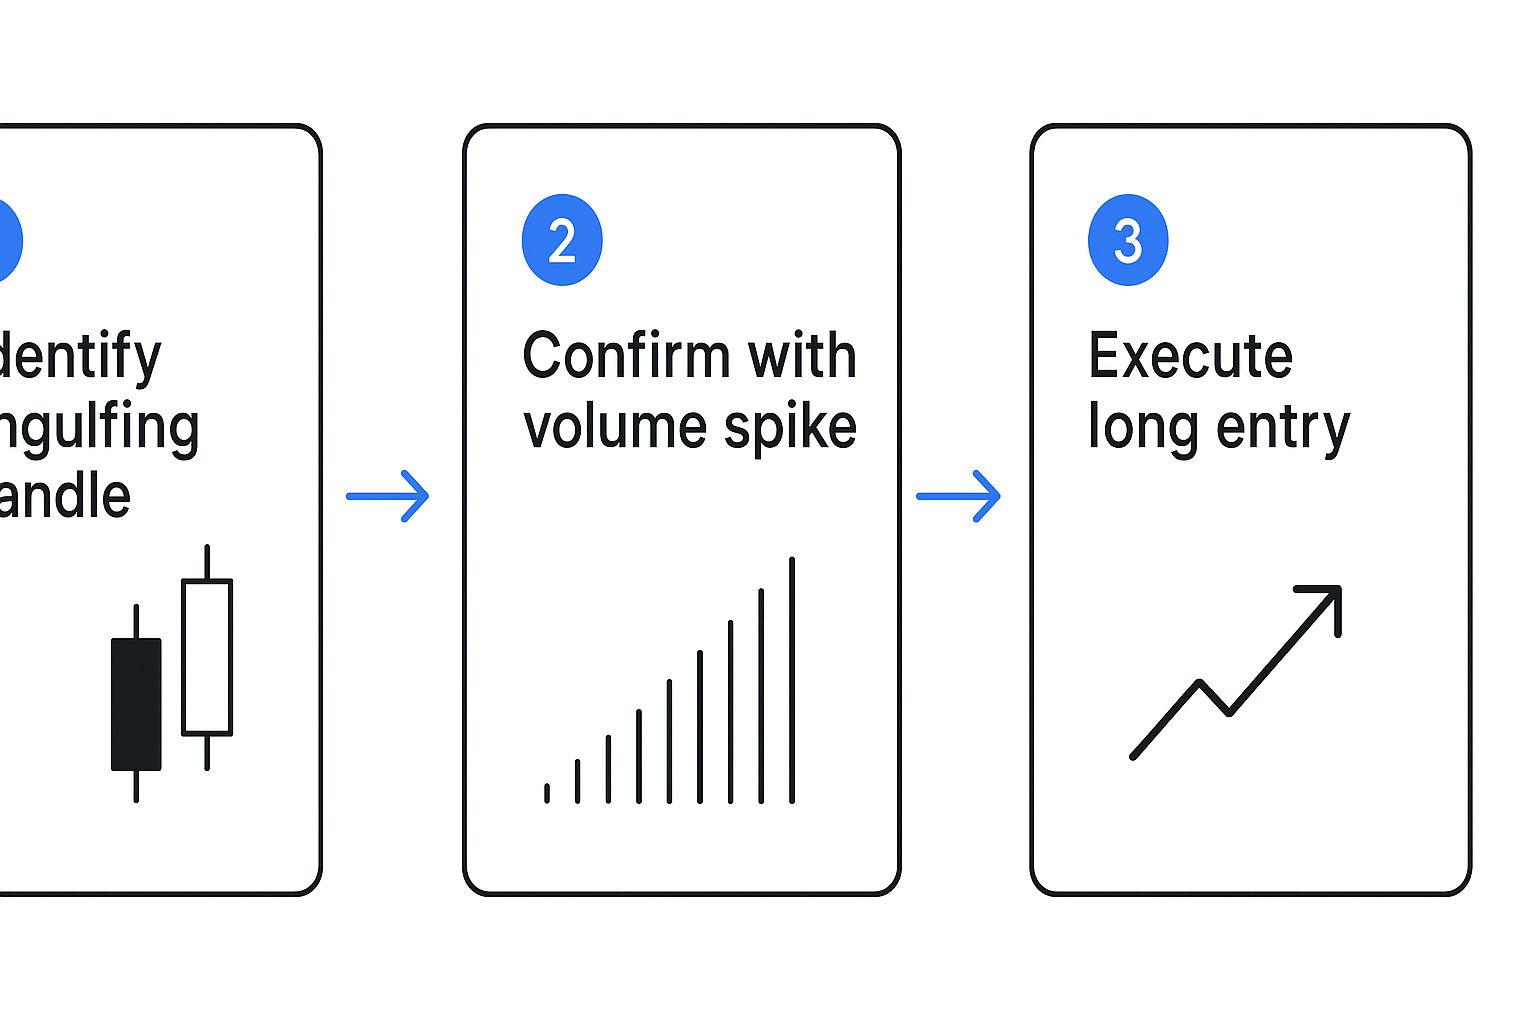
This structured workflow keeps you disciplined, making sure you identify a valid pattern, confirm it with real market participation, and then execute your trade with confidence.
Data-Driven Validation Methods
Beyond just looking at the chart, a data-driven approach can add another layer of confidence to your trading. Backtesting, for example, has shown that adding specific filters can seriously improve your results.
Studies on over 11,000 confirmed signals showed that pairing a bullish engulfing pattern with other criteria, like the price also closing above the 50-day simple moving average (SMA), leads to more profitable reversal trades.
This proves that the pattern becomes much more reliable when it aligns with the broader market trend. The research also found that using risk management tools like the Average True Range (ATR) to set stop-losses and targeting smart risk-reward ratios boosted performance. This kind of data-backed approach is what turns trading from a guessing game into a systematic process.
Building an Actionable Trading Strategy
Spotting a bullish engulfing pattern on your chart is a great start, but let's be honest—that’s only half the battle. To actually make money from this signal consistently, you need a plan. A rock-solid strategy gives you clear rules for every single part of the trade, from the second you get in to the moment you take your profits.
Without a strategy, you're just guessing. Even the best patterns can turn into losing trades if your timing is off, your risk management is sloppy, or you get greedy and don't know when to cash out. This framework turns pattern spotting into a repeatable process, giving you the confidence to pull the trigger when a high-quality setup appears.
Crafting Your Entry Rules
First things first: how and when do you actually enter the trade? Jumping in the second the engulfing candle closes is one way to do it, but it can be a bit aggressive. Sometimes, waiting for a little extra confirmation that the buyers are really in charge can lead to better results.
Here are a few common entry triggers to think about:
-
The Aggressive Entry: You buy at the market price the instant the bullish engulfing candle closes. This gets you in early, but it also comes with a higher risk of getting caught in a "fakeout" where the price immediately reverses.
-
The Confirmation Entry: This is a more conservative approach. You wait for the next candle to trade above the high of the engulfing candle. A simple way to do this is to place a buy-stop order just a few ticks above that high. This way, you only get into the trade once the upward momentum is confirmed.
-
The Retracement Entry: For the patient trader. After the pattern forms, you wait for the price to pull back a bit, maybe to the halfway point of that big engulfing candle. This can give you a much better risk-to-reward ratio, but you do run the risk of the price taking off without you.
Establishing Your Stop-Loss for Risk Management
Your stop-loss is your safety net. It's the pre-planned price where you admit the trade isn't working out and get out to protect your capital. With the bullish engulfing pattern, the placement is pretty straightforward and logical.
The best and most common place to set your stop-loss is just below the low of the bullish engulfing candle. Think about it—that low represents the point where buyers stepped in with maximum force. If the price breaks below that level, the whole reason for the trade is gone. It's a clear signal that sellers have taken back control.
A disciplined stop-loss isn't just a suggestion; it's non-negotiable. Placing it right below the pattern's low defines your risk from the start and protects you from that one bad trade that could wipe out your account.
This simple rule keeps your risk clearly defined before you even click "buy." You know exactly what's on the line, and that's the cornerstone of professional trading.
Planning Your Profit-Taking Exits
Knowing when to take your profits is just as crucial as knowing when to enter. A clear exit plan stops you from giving back your gains or holding on too long because of greed. You need an objective target based on what the market is telling you.
Here are three practical ways to set your profit targets:
-
Target Previous Resistance: Just look to the left on your chart. Find the most recent, significant area of resistance—a previous price peak or a messy consolidation zone. These are natural spots where sellers might show up again, making them logical places to take your money and run.
-
Use a Fixed Risk-to-Reward Ratio: This is a simple but incredibly powerful method. If your stop-loss is 50 pips from your entry, you could set a profit target at a 2:1 ratio (100 pips) or a 3:1 ratio (150 pips). This discipline ensures your winning trades are always bigger than your losing ones.
-
Fibonacci Extension Levels: If you're a bit more advanced, Fibonacci extension tools can help project potential price targets based on the size of the reversal. The 127.2% and 161.8% extension levels are popular targets to watch.
As you build out a trading strategy, having a broader market context can be a massive edge. For instance, if you're trading forex, understanding the global currency exchange market provides a crucial backdrop for your decisions. It’s also wise to never rely on just one signal. Confirming your entry with another indicator, like volume, can seriously improve your odds. You can learn more in our complete guide to trading with volume.
By combining a smart entry, a tight stop-loss, and a clear profit target, you turn a simple candlestick pattern into a complete, actionable trading plan.
Understanding the Pattern's Performance and Limits

While the bullish engulfing pattern is a powerful signal, it's critical to approach it with a healthy dose of realism. No trading pattern is a crystal ball, and this one is no exception. Understanding its real-world performance and where it falls short is what separates traders who profit consistently from those who get burned by false signals.
Think of the pattern like a powerful sailboat. In a steady tailwind (a clear, trending market), it performs beautifully. But throw it into choppy, sideways seas (a ranging market), and it gets tossed around, often sending you in the wrong direction.
The single biggest weakness of the bullish engulfing pattern is its tendency to flash false signals in consolidating markets. When prices are just seesawing without clear direction, a big bullish candle might be nothing more than random noise right before the price drops again.
Setting Realistic Expectations with Data
To trade any pattern well, you have to move beyond theory and look at the cold, hard data. Backtesting is where the rubber meets the road, giving you a much clearer picture of what you can actually expect.
A comprehensive study that analyzed thousands of trades across centuries of U.S. stock market data gives us some valuable context. It found that the bullish engulfing pattern has a 55% success rate at predicting a price move higher. The average gain was about 0.46% within ten days of the signal—a relatively modest return. You can dig into these performance findings to get a better feel for its statistical edge.
This data highlights a crucial lesson: The bullish engulfing pattern offers a slight statistical edge, not a guarantee. Success comes from combining this small edge with solid risk management and extra confirmation.
This really drives home the point that you can't trade this pattern in isolation. A 55% win rate is better than a coin flip, but it also means you’ll be wrong almost half the time. That’s why confirmation from other tools isn't just a suggestion—it’s essential for long-term survival.
The Most Common Pitfalls to Avoid
Besides getting faked out in choppy markets, traders often stumble into other traps with this pattern. Knowing these common limitations can help you make smarter decisions and sidestep costly mistakes.
Here are the main weaknesses to keep on your radar:
-
No Built-In Price Targets: Unlike some patterns that give you a measured move, the bullish engulfing formation doesn't offer a clear profit target. It signals a potential reversal but gives you no clue as to how far the price might run. This forces you to use other methods, like identifying resistance levels or setting risk-to-reward ratios, to plan your exits.
-
Potentially Poor Risk-to-Reward: That big engulfing candle can be a double-edged sword. Since standard practice is to place your stop-loss below its low, a very large candle can force you into a very wide stop. If your profit target isn't proportionally far away, the risk might simply not be worth the potential reward.
-
Vulnerability to Market News: A picture-perfect bullish engulfing setup can be completely blown apart by an unexpected news event or economic data release. A strong technical signal is no match for a sudden, fundamental shift in market sentiment.
By acknowledging these limitations, you can approach bullish engulfing patterns with a clear-eyed strategy. It's a valuable tool, but like any tool, its effectiveness depends entirely on the skill of the person using it.
Answering Your Top Questions About Bullish Engulfing Patterns
Once you get the basics down, the real questions start popping up. Let's tackle some of the most common ones traders ask about the bullish engulfing pattern. Think of this as the nitty-gritty details that turn knowledge into a real strategy.
What’s the Real Difference Between a Bullish Engulfing and a Bullish Harami?
This is a great question because it gets right to the heart of market psychology. The key difference is the order and size of the candles, which tells two completely different stories.
A bullish engulfing pattern is a small down-day followed by a huge up-day that completely swallows the previous candle. It's a sudden, aggressive show of force from the buyers.
The bullish harami is the exact opposite. You have a large down-day followed by a small up-day that fits entirely inside the body of the first candle.
To put it simply, a bullish engulfing screams that buyers have staged a powerful coup. A bullish harami just whispers that the sellers might be taking a break.
One signals a potentially explosive reversal, while the other is more about indecision and a loss of bearish momentum. The engulfing pattern is the one with real conviction behind it.
How Much Does Volume Really Matter When Confirming This Pattern?
It matters. A lot. Volume is your lie detector test for a bullish engulfing pattern.
Ideally, you want to see a significant spike in volume on that second, big green day. High volume is the market's way of validating the move. It tells you there's real money and broad participation behind the reversal, not just a few rogue buyers pushing the price up. It’s the difference between a real uprising and a small protest.
If you spot a bullish engulfing pattern that formed on weak or declining volume, be skeptical. That suggests the move lacks commitment and could easily fizzle out, turning into a nasty bull trap before the downtrend kicks back in.
Can I Use Bullish Engulfing Patterns on Any Timeframe?
Absolutely. You’ll find bullish engulfing patterns everywhere, from a 1-minute chart all the way up to a monthly chart. The catch is that their reliability and meaning change dramatically with the timeframe.
Here’s how to think about it:
- Higher Timeframes (Daily, Weekly): A pattern here is a big deal. It represents a major shift in sentiment that took days or weeks to form. These signals carry much more weight and are the bread and butter for swing and position traders.
- Lower Timeframes (Intraday): You'll see these patterns constantly, but they're much more prone to market "noise" and false signals. Day traders can use them, but they need to be far more disciplined with their confirmation rules.
Always match your expectations to your timeframe. A weekly signal might be the start of a trend that lasts for months. A 5-minute signal might only give you a profitable move for the next hour.
Tired of staring at charts, hoping to catch these patterns? ChartsWatcher is a powerful platform that lets you set up custom alerts for bullish engulfing patterns—and hundreds of others—across any timeframe you trade. Automate your analysis and never miss a high-probability setup again with ChartsWatcher.
