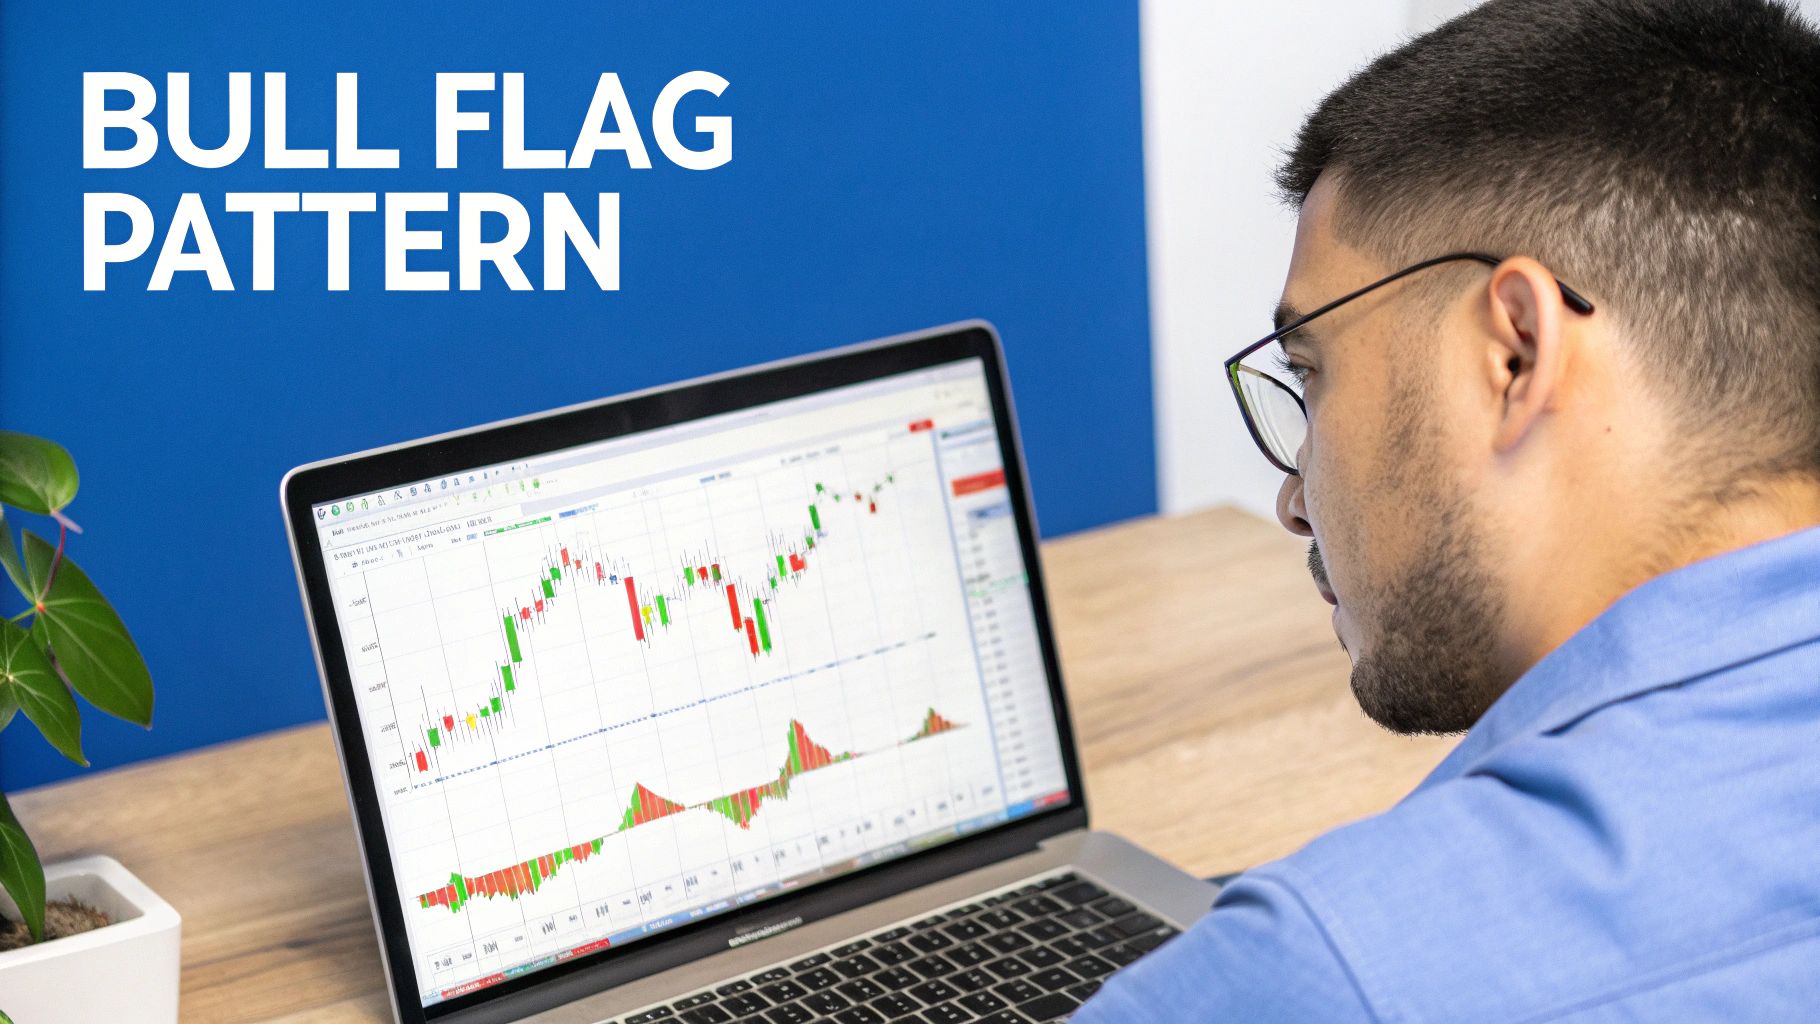
Trading Bull Flag Chart Patterns a Practical Guide
A bull flag pattern is one of the most reliable signals you can find that a strong uptrend is likely to continue. Picture a sprinter who, after a powerful burst off the starting line, takes a short, controlled breather before exploding forward again for the final stretch. That’s a bull flag in action.
This pattern is not a reversal signal. Instead, it’s a healthy pause, a sign that buyers are just catching their breath and getting ready for another push higher.
Understanding Bull Flag Chart Patterns
At its heart, the bull flag tells a story about market psychology. It shows a temporary truce between buyers and sellers right after a period of aggressive buying. This brief consolidation is crucial—it shakes out the less confident traders and allows the market to build a solid foundation before the next leg up.
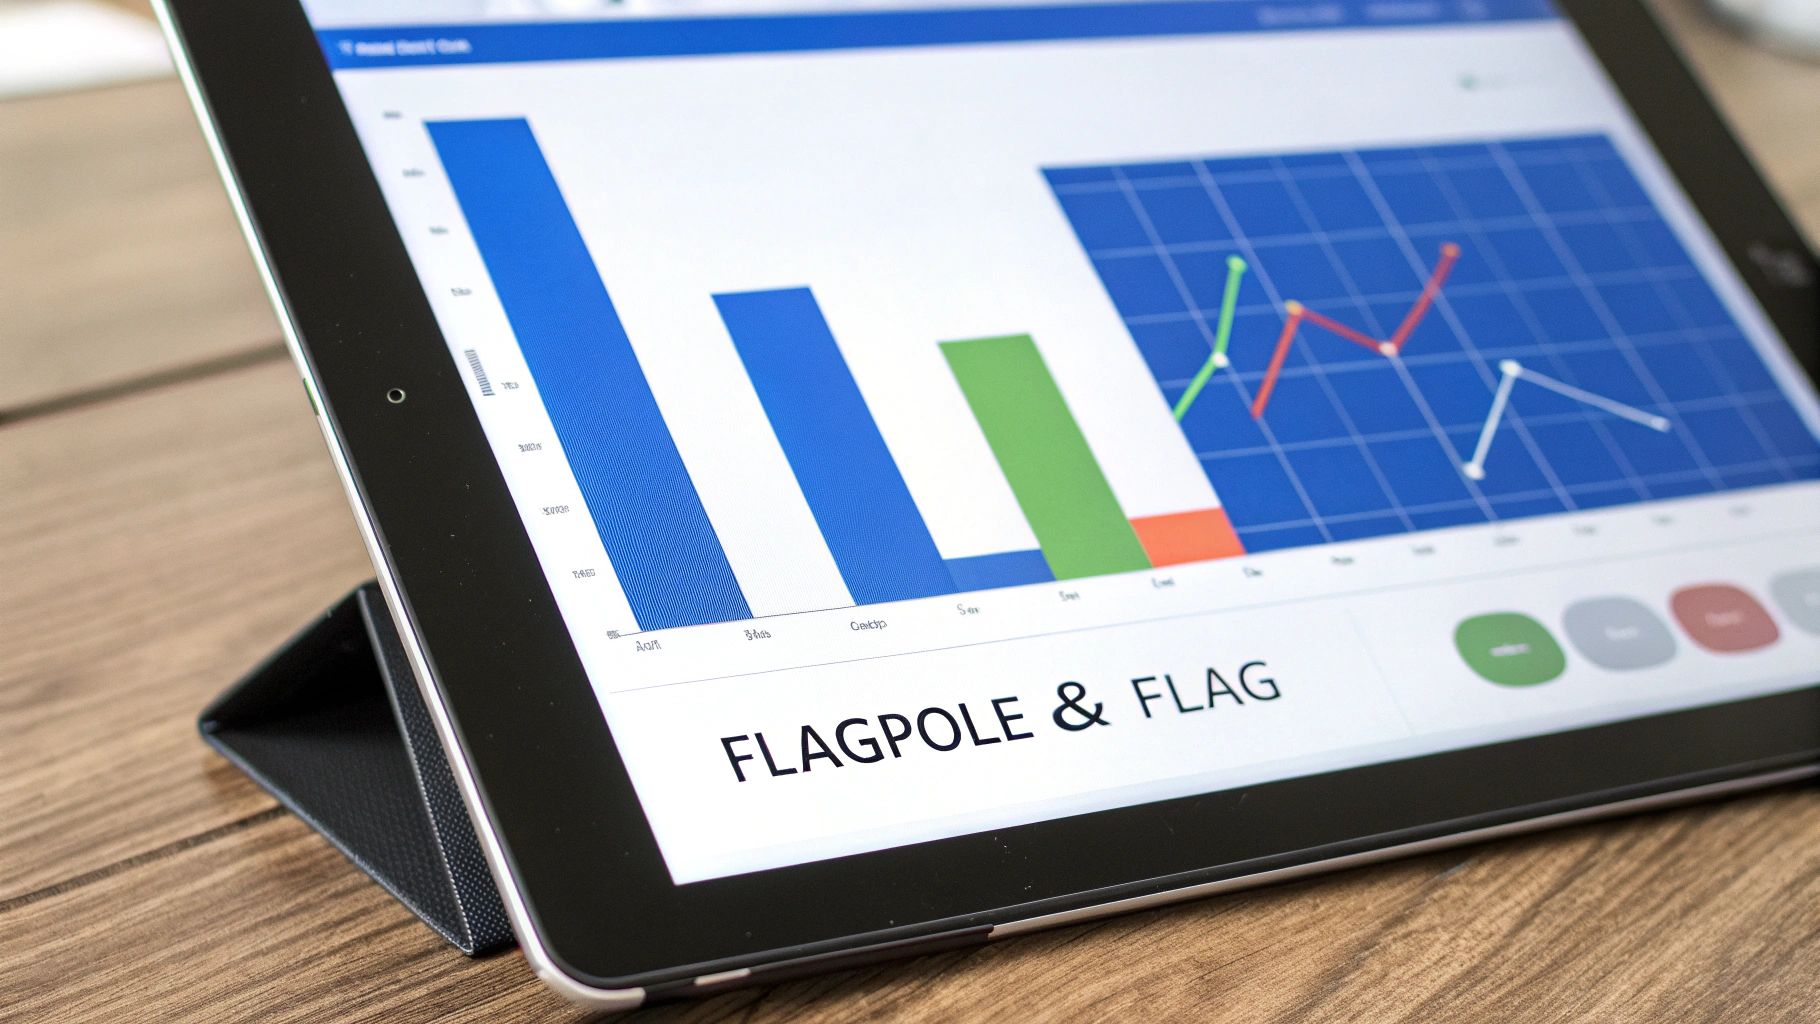
The Two Core Components
Every classic bull flag has two distinct parts you need to spot. Getting a feel for these elements is the first step to trading the pattern with any confidence. If you want to get a better handle on how these moves look on a live chart, our guide to understanding candlestick graphs is a great place to start.
-
The Flagpole: This is the initial, sharp, almost vertical price surge. It’s the result of intense buying pressure where demand completely overwhelms supply, creating a powerful upward move. A strong, decisive flagpole is an absolute must-have for a quality setup.
-
The Flag: Right after the flagpole forms, the price settles into a consolidation phase. This "flag" usually looks like a small, rectangular channel that slopes gently downward, against the primary trend. This slight downward drift isn't a reversal; it’s just minor profit-taking.
A bull flag is a technical chart pattern that signals the continuation of an established uptrend. It consists of a strong upward price move (the flagpole), followed by a period of consolidation with a slight downward drift (the flag).
Market Psychology in Action
The real magic of the bull flag happens during the flag formation. Ideally, you want to see trading volume dry up during this consolidation. This drop in activity is a huge tell—it signals that sellers don't have the conviction to drive the price down in any meaningful way.
The buyers are simply on a break, absorbing the recent gains and getting ready for the next move. When you see the price break out above the flag's upper resistance line, especially on a spike in volume, it's the market's way of saying the buyers are back in charge and ready to resume the uptrend.
Anatomy of a High-Probability Bull Flag
Just spotting a shape on a chart that vaguely resembles a flag isn’t enough to risk your hard-earned capital. The real edge comes from knowing how to tell the difference between a textbook, high-probability bull flag and a weak, deceptive imposter. The best traders I know are incredibly selective; they wait for the perfect setup that checks all the boxes before they even think about clicking "buy."
The entire pattern is built on that first powerful surge of buying. Without a strong start, the rest of the structure is shaky at best. Think of it like building a house—if you skimp on the foundation, you’re just asking for trouble down the road.
The Flagpole Must Show Strength
The flagpole is the make-or-break element. It’s the initial signal of conviction from buyers and sets the whole stage for the next potential leg up. A quality flagpole isn't just any old upward move; it has some very specific, non-negotiable traits.
For a bull flag to be worth your time, the flagpole needs to be a sharp, almost vertical price explosion. This is the visual proof of an explosive imbalance where demand just completely overwhelmed supply. A slow, grinding flagpole is a major red flag—it suggests buyers are hesitant and lack real power.
Volume is your truth serum here. A strong flagpole must be driven by a significant spike in trading volume. This surge is your confirmation that big players—the ones who actually move the market—are behind the move. Without that volume spike, the move just doesn't have any authority.
Analyzing the Flag Consolidation
Once you've identified a solid flagpole, your focus shifts to the flag itself. The way this consolidation phase unfolds gives you incredible insight into the sellers' strength—or, more importantly, their weakness.
A high-probability flag should look calm, orderly, and shallow. It usually forms a gentle, downward-sloping channel or a tight rectangle. Here’s a critical rule of thumb: the flag should not retrace more than 38% of the flagpole's height. If it pulls back deeper than that, especially past the 50% mark, it’s often a sign that sellers are taking over and the bullish momentum is fizzling out.
To really understand how these components work together, let's break them down in a table.
Key Components of a Bull Flag Pattern
| Component | Description | Volume Indicator | What It Signals |
|---|---|---|---|
| The Flagpole | A sharp, near-vertical price surge. | High and Spiking | Strong, urgent buying pressure; institutional interest. |
| The Flag | A shallow, orderly pullback, often in a channel. | Low and Decreasing | Sellers lack conviction; buyers are holding strong. |
| The Breakout | A decisive price move above the flag's resistance. | High and Spiking | Buyers have returned with force, confirming the trend. |
Each part tells a piece of the story, from the initial explosive interest to the quiet pause and the final confirmation.
Key Takeaway: The most powerful signal during the flag's formation is when volume dries up. This drop-off in activity shows that sellers don't have the muscle to push the price down. Buyers are just patiently holding, waiting for their next chance to take control.
The final piece of this puzzle is the breakout. A valid breakout happens when the price closes decisively above the flag's upper trendline. This move should be supercharged by another big surge in volume, confirming that buyers are back in the driver's seat and ready to resume the uptrend. That volume spike is your green light, validating the entire pattern and signaling a prime entry point for a long trade.
A Step-by-Step Guide to Trading Bull Flags
Spotting a bull flag on a chart is one thing. Turning that pattern into a profitable trade is a whole different ballgame. It takes a clear, repeatable process to take the emotion and guesswork out of the equation so you can execute with confidence. This is your playbook for trading bull flags, covering everything from the entry to the exit.
The very first step is always confirmation. Don't jump the gun. Before you even think about placing a trade, make sure the pattern checks all the boxes we talked about earlier. You need to see a powerful flagpole on high volume, followed by a shallow, orderly flag that forms on lighter, declining volume. Patience is your best friend here; let the market prove the setup is legit.
Pinpointing Your Entry and Stop-Loss
Your green light for entry is a decisive breakout. This is the moment a candle closes above the upper trendline of the flag's consolidation channel. If you're an aggressive trader, you might jump in right as this breakout happens. A more conservative trader? You might wait for a retest, where the price dips back to touch that old resistance line (which should now act as support) before climbing higher.
Just as critical is knowing where you'll get out if the trade turns sour. A disciplined stop-loss should be placed just below the lowest point of the flag. This protects your capital by getting you out of the trade if the bullish structure fails, limiting your potential loss to a pre-calculated amount.
This infographic breaks down the core steps you'll follow to identify the setup and nail your entry.
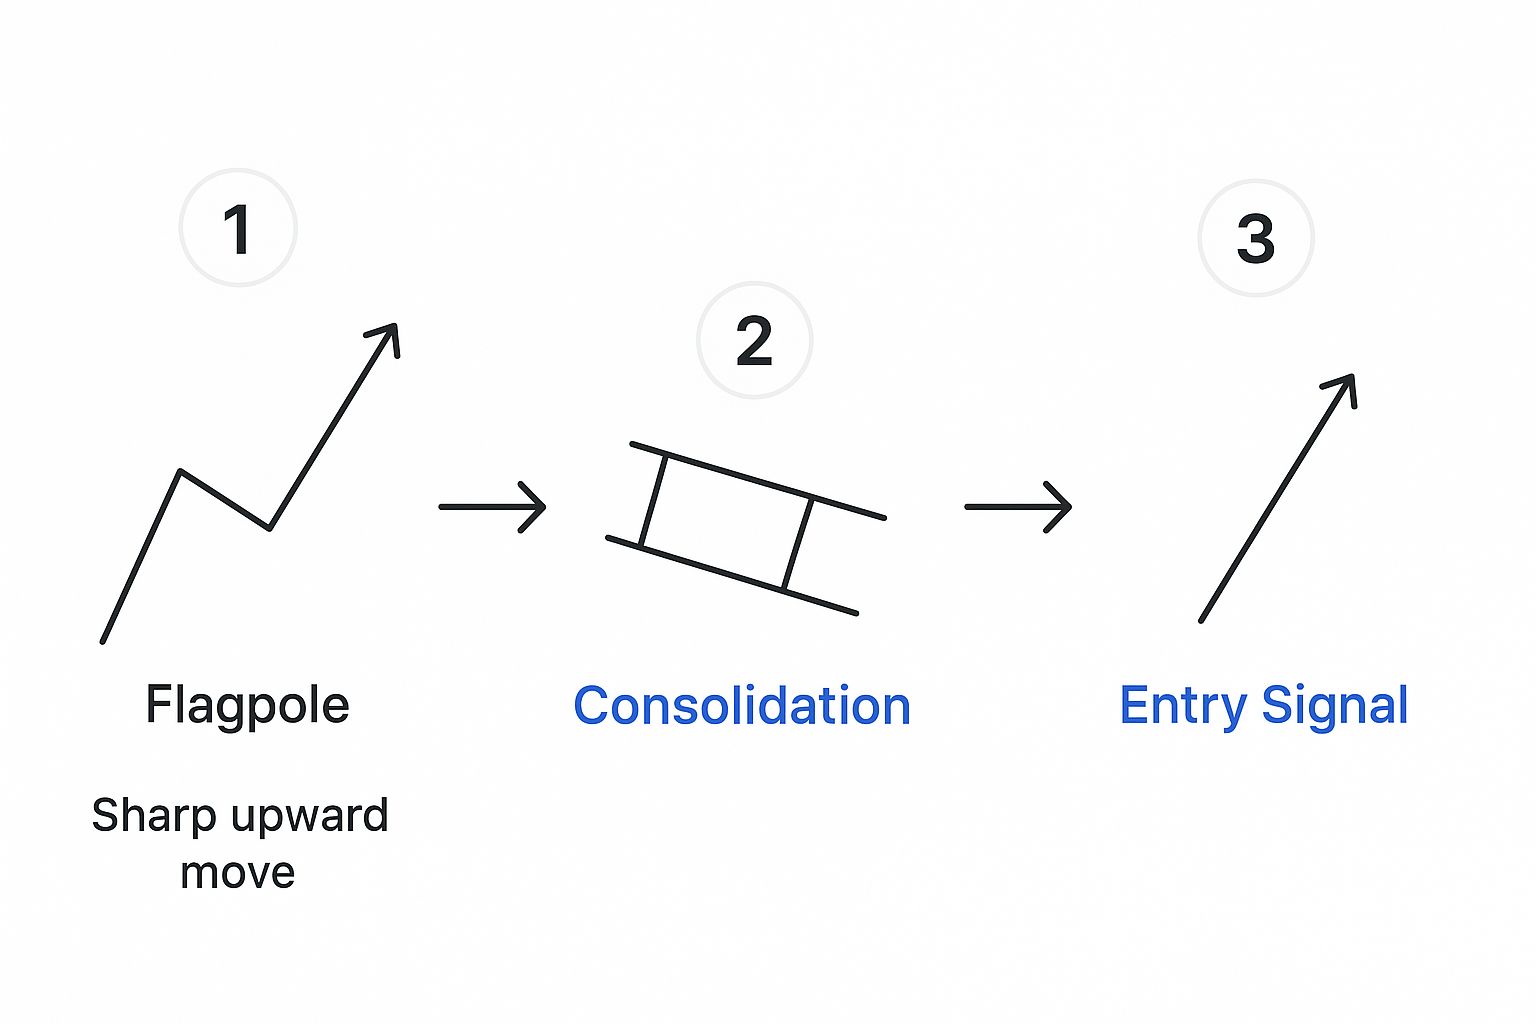
The visual shows the whole sequence perfectly: from the initial flagpole, through the consolidation phase, and finally to the breakout arrow that signals a potential trading opportunity.
Setting Profit Targets and Managing Risk
Once you're in a trade, you need an exit plan for taking profits. The most common technique for bull flags is called the "measured move."
- Measure the Flagpole: Calculate the price distance from the bottom of the flagpole all the way to its peak.
- Project the Move: Take that exact same distance and add it to your breakout price (the point where the price broke through the flag's upper trendline).
This calculation gives you a solid, data-driven target for cashing out. Statistics show that in a trending market, these patterns have a continuation probability between 65% to 70%. For example, say a stock rips from $100 to $120 (that's a $20 flagpole), consolidates down, and then breaks out at $118. Your measured move target would be $138 ($118 + $20).
Risk Management is Key: Before you ever enter a trade, calculate your risk-to-reward ratio. Your potential profit (the distance to your target) should be meaningfully larger than your potential loss (the distance to your stop-loss). Aim for a ratio of at least 2:1 or higher.
Great risk management also demands proper position sizing. A cardinal rule is to never risk more than a small fraction of your trading account on any single trade, typically 1-2%. Finally, before going live with any new strategy, it's crucial to see how it would have performed in the past. You can learn how to backtest trading strategies to build real confidence in your method before putting a single dollar on the line. This disciplined approach is what separates amateurs from traders who survive long-term.
Seeing Bull Flags in the Wild: Real-World Examples
Theory is one thing, but seeing bull flag chart patterns play out on a live chart is where the rubber really meets the road. Spotting these patterns in the heat of the moment takes practice, and the best way to train your eyes is to look back at historical charts.
Let's break down a few classic examples across different markets. In each case, pay close attention to the key ingredients: the powerful flagpole, the quiet and orderly flag, the all-important volume signature, and the explosive breakout that follows.
High-Growth Tech Stock Example
Picture a hot tech stock everyone is talking about. It's already in a strong uptrend, but then some great news hits. The stock absolutely explodes, rocketing from $150 to $180 in just five trading days. This move happens on huge, climactic volume, creating a textbook flagpole.
But no stock goes straight up forever. After such a massive run, it needs to catch its breath. The price begins to drift sideways and slightly down, forming a tight, orderly channel between $178 and $172 over the next eight days. What's happening here? Early buyers are taking some profits, but there's no real selling pressure. The proof is in the volume, which has completely dried up. This tells you the big players are holding on, waiting for the next leg up.
The pattern snaps into action when a daily candle closes decisively above the $178 resistance level. This breakout is accompanied by another monster spike in volume, confirming the bull flag. From there, the stock resumes its climb toward the measured target of $208 (calculated by adding the flagpole's $30 height to the $178 breakout point).
Major Currency Pair Case Study
Bull flags are just as common in the forex market, where news-driven volatility creates perfect setups. Let's look at the EUR/USD pair on a 4-hour chart. Imagine a major economic report comes out that's much better than expected for the Eurozone.
In a single session, the pair shoots up 150 pips. This creates a very clear flagpole driven by a rush of institutional buying.
Following that massive spike, the market goes quiet. Over the next full day, the pair trades sideways in a very narrow 30-pip range, forming a tight, rectangular flag. This is a healthy pause. It’s the market’s way of absorbing the news and building up energy for its next move. And just like with the stock example, volume during this consolidation is noticeably lower than it was during the flagpole surge.
Trader's Insight: The shift from high-volume volatility (the flagpole) to low-volume calm (the flag) is one of the most reliable clues that a continuation pattern is taking shape.
The breakout is clean and simple: the price pushes above the top of that rectangle. That move comes with another jolt of volume, signaling the bulls are back in control. Traders entering on that break could have aimed for a 150-pip target, matching the height of the original flagpole.
Cryptocurrency Market Application
The crypto markets, known for their wild volatility, are a fantastic hunting ground for bull flags. An altcoin might catch fire, fueled by social media hype and a flood of buying pressure, causing it to rally an incredible 40% in just 24 hours. This creates a massive, almost vertical flagpole on the daily chart.
After a parabolic move like that, some profit-taking is inevitable. The coin starts to pull back, but not in a panicked way. It forms a gentle, downward-sloping channel over several days, giving back about 25% of the flagpole’s gain. This flag shows that while some traders are cashing out, there isn't a fundamental shift in sentiment.
The breakout kicks off the next round of fireworks. The price slices right through the flag's upper trendline, and a big spike in trading volume confirms the move. This tells traders that the consolidation is over and the primary uptrend is back on, often triggering another powerful rally.
How to Avoid Common Traps and False Signals

While bull flags are a powerful tool in a trader's arsenal, not every flag you spot is going to lead to a textbook breakout. Far from it. The reality of trading is that patterns fail, and learning to spot the warning signs is what separates disciplined traders from those who chase every glimmer of a setup.
Understanding why some flags fizzle out is your best defense against getting caught on the wrong side of a trade.
A failed pattern often starts with a weak foundation—a flagpole that just doesn't have any real conviction behind it. If that initial price surge is more of a slow, grinding climb than a sharp, explosive move, it’s a sign that buyers might be hesitant. A breakout that happens on weak, uninspired volume is another huge red flag, suggesting a lack of follow-through from the big players.
Another common trap is mistaking a reversal pattern for a simple continuation. If the flag pulls back too deeply, retracing more than 50% of the flagpole’s height, the whole bullish idea starts to fall apart. This tells you sellers are gaining control, and what looked like a healthy pause might actually be the start of a new downtrend.
Red Flags to Watch For
To become more selective, you have to train your eyes to spot the common signs that a bull flag is a low-probability setup. Here’s what to look out for:
- Anemic Breakout Volume: A real breakout needs fuel. It must be accompanied by a significant spike in trading volume. Without it, the move lacks the buying pressure needed to sustain any upward momentum.
- Excessive Retracement: When a flag pulls back too far, it's a clear signal that sellers are getting aggressive. A shallow, tight consolidation is always a stronger sign of bullish control.
- A Long, Drawn-Out Flag: The flag is supposed to be a quick pause, a breather. If the consolidation phase drags on for too long, it often means the initial bullish fire has faded away.
Trading successfully isn't just about finding winning patterns; it's about knowing which ones to avoid. Filtering out weak setups is just as important as identifying strong ones.
The High-Tight Flag: A Powerful Variation
Not all bull flags are created equal. An extensive study that analyzed over 1,000 trades found that traditional bull flags have a surprisingly high failure rate of around 55%.
However, a special variation known as the “high-tight bull flag” performed remarkably well, boasting a success rate of 85%. You can check out the full findings of this study over on LiberatedStockTrader.com.
This specific pattern has much stricter criteria. It typically requires an explosive price increase of 100% or more in a very short time, followed by an extremely shallow consolidation. The massive difference in success rates underscores just how important it is to be selective and focus only on the highest-quality setups.
Ultimately, your goal is to filter out the noise and zero in on high-probability trades. This means having a strict checklist and the discipline to walk away when a pattern doesn't tick all the boxes. Protecting your capital is always priority number one, and a huge part of that is knowing exactly where to place your exits. For a deeper dive into this essential skill, check out our guide on how to set stop-losses effectively.
Frequently Asked Questions
When you're trying to apply a chart pattern to live markets, a few practical questions always pop up. It's one thing to know the theory, but another to feel confident when your capital is on the line. Let's tackle some of the most common "what ifs" that traders have about bull flags.
Think of this as fine-tuning your trading plan. You know the big picture, but these details can be the difference between a clean trade and a frustrating loss.
How Long Should a Bull Flag Consolidation Last?
There's no magic number here—the "right" amount of time is always relative to the chart you're watching. A flag on a 5-minute chart might form and break out in under an hour, while the same pattern on a daily chart could easily take a few weeks to play out.
The real key is this: the flag's duration should be noticeably shorter than the time it took for the flagpole to form. If the consolidation phase drags on and on, it’s a big red flag (pun intended). It's often a sign that the initial buying frenzy is dying down and the bears are starting to gain a foothold.
Key Takeaway: A quick, tight consolidation is almost always a better sign. It shows that buyers are just catching their breath and are ready to push prices higher, while sellers don't have enough power to do any real damage.
Can Bull Flags Appear in a Bear Market?
This is a really important distinction. A true bull flag chart pattern is a continuation pattern, meaning its job is to continue an existing uptrend. So, by definition, you need a strong rally already in place for a legitimate bull flag to even start forming.
You might see similar-looking patterns during a brief bounce within a larger bear market, but trading these is a whole different ball game. They are far less reliable and much riskier because you're fighting the market's main current. The high-probability trades happen when the pattern aligns with the dominant trend, not when it's fighting against it.
What Is the Difference Between a Bull Flag and a Bull Pennant?
Honestly, the difference is mostly cosmetic. Both bull flags and bull pennants are powerful continuation patterns that show up after a big price surge. They both signal the exact same thing: a temporary pause before the uptrend is likely to kick back in.
The only real difference is the shape of the consolidation.
- A Bull Flag: Forms a small, downward-sloping rectangle or channel. Think of it as two parallel lines.
- A Bull Pennant: Forms a small, symmetrical triangle. The trendlines converge toward a point.
Even though they look slightly different, the market psychology behind them—and how you trade them—is virtually identical. You’ll use the same principles to spot the flagpole, wait for the breakout, set your stop-loss, and calculate your price target.
Ready to spot these patterns in real-time? ChartsWatcher provides the advanced scanning and charting tools you need to find high-probability setups across the market. Customize your dashboards, set precise alerts, and gain the edge you need to trade with clarity and confidence.
Explore the powerful features of ChartsWatcher today at https://chartswatcher.com.
