Top Momentum Trading Strategies for Profitable Trading in 2025
Riding the Waves of Market Momentum
Want to profit from trending markets? This listicle delivers eight effective momentum trading strategies for 2025. Learn how to identify and capitalize on price movements using techniques like Moving Average Crossover, RSI, MACD, Breakout patterns, Momentum Divergence, Volume-Weighted Momentum, Sector Rotation, and Mean Reversion with a Momentum filter. These momentum trading strategies can help any trader, from novice to expert, identify opportunities and improve market navigation. Understanding these concepts is crucial for capitalizing on market trends and maximizing profit potential. Let's get started.
1. Moving Average Crossover Strategy
The Moving Average Crossover strategy is a cornerstone of momentum trading, leveraging the interplay between two or more moving averages to pinpoint trend direction and potential entry and exit points. This strategy capitalizes on the principle that shorter-term moving averages react more quickly to price changes than longer-term ones. This difference in sensitivity allows traders to identify shifts in momentum and make informed trading decisions. It’s a popular choice for those seeking a clear, systematic approach within the broader context of momentum trading strategies.
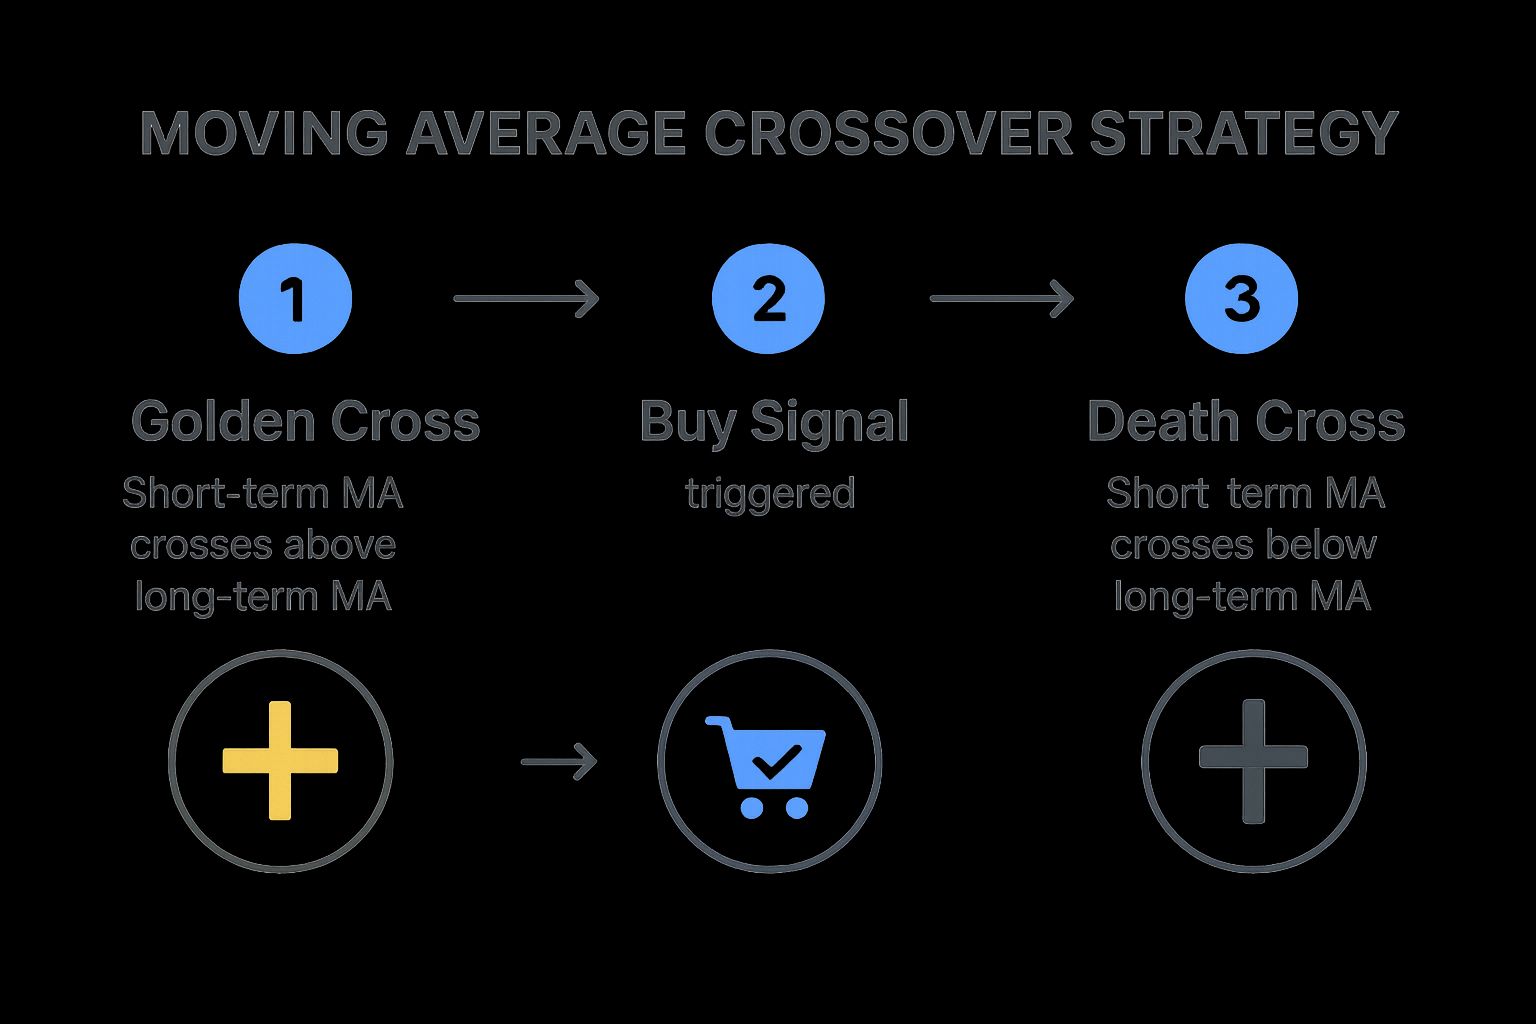
The infographic above visualizes the process of identifying trading signals using the Moving Average Crossover Strategy. It clearly illustrates how the crossover points between the short-term and long-term moving averages generate buy and sell signals. As you can see, the “golden cross” forms when the shorter-term average rises above the longer-term average, while the “death cross” occurs when the shorter-term average falls below the longer-term average.
This strategy typically employs a 50-day and a 200-day moving average, though other periods can be used depending on individual trading styles and timeframes. A "golden cross" occurs when the shorter-term 50-day moving average crosses above the longer-term 200-day moving average. This signals increasing upward momentum and is considered a buy signal. Conversely, a "death cross" happens when the 50-day moving average crosses below the 200-day moving average, suggesting a bearish trend reversal and triggering a sell signal. The sequence of these crossovers is critical for understanding shifts in market sentiment and potential price direction.
How the Moving Average Crossover Strategy Works:
The strategy is based on identifying changes in the relationship between the two moving averages. The process flow is as follows:
- Calculate Moving Averages: Calculate the chosen short-term (e.g., 50-day) and long-term (e.g., 200-day) moving averages for the asset being traded.
- Monitor Crossover Points: Continuously monitor the two moving averages for crossover points.
- Identify Golden Cross (Buy Signal): When the short-term moving average crosses above the long-term moving average, a golden cross occurs, signaling a potential uptrend and a buy entry point.
- Identify Death Cross (Sell Signal): When the short-term moving average crosses below the long-term moving average, a death cross occurs, signaling a potential downtrend and a sell or short-selling opportunity.
- Confirm with Other Indicators (Optional): Use other technical indicators like volume or RSI to confirm the signal and increase the probability of a successful trade.
Examples of Successful Implementation:
The Moving Average Crossover strategy has historically signaled significant market turns. For example, the S&P 500's golden cross in June 2020 following the COVID-19 market crash correctly predicted the start of a strong bull market. Conversely, Bitcoin's death cross in June 2021 preceded a significant price decline, highlighting the strategy's predictive capabilities.
Pros and Cons:
Pros:
- Simplicity: Easy to understand and implement, even for novice traders.
- Trend Identification: Effective at capturing medium to long-term trends.
- Emotional Control: Removes emotional bias from trading decisions.
- Automation: Can be easily automated using trading platforms.
Cons:
- False Signals: Prone to generating false signals in choppy or sideways markets.
- Lagging Indicator: Can miss the initial stages of price movements.
- Confirmation Needed: Often requires confirmation from other indicators for optimal results.
- Drawdowns: Can lead to significant drawdowns during sharp trend reversals.
Tips for Effective Implementation:
- Volume Confirmation: Use rising volume to confirm buy signals and falling volume to confirm sell signals.
- Exponential Moving Averages: Consider using exponential moving averages (EMAs) to give more weight to recent price action.
- Timeframe Adjustment: Adjust the moving average periods based on your trading horizon. Shorter periods for day trading, longer periods for swing or position trading.
- Trailing Stop Loss: Implement a trailing stop-loss order to protect profits during strong trends.
This strategy deserves a place on any list of momentum trading strategies because of its simplicity, proven track record, and ease of implementation. While not foolproof, it provides valuable insights into potential trend changes and can be a powerful tool for traders of all levels. Popularized by technical analysis experts like John Murphy, Richard Dennis, and Linda Raschke, the Moving Average Crossover strategy remains a widely used and respected technique within the trading community.
2. Relative Strength Index (RSI) Momentum Strategy
The Relative Strength Index (RSI) Momentum Strategy stands out among momentum trading strategies for its versatility and responsiveness. Unlike strategies relying solely on price action, this approach leverages the Relative Strength Index (RSI), a momentum oscillator, to gauge the speed and magnitude of price changes. This allows traders to identify potential trend continuations and reversals earlier than with traditional lagging indicators. While the RSI is commonly used to identify overbought (above 70) and oversold (below 30) conditions, the momentum strategy focuses on the indicator's direction, trendline breakouts, and divergences with price to capitalize on ongoing momentum. This makes it a powerful tool for professional traders, stock market analysts, financial institutions, independent investors, stock trading educators, and anyone utilizing stock scanners and screeners for day trading.
Here's how it works: The RSI oscillates between 0 and 100. Instead of simply looking for extreme readings, momentum traders observe the RSI's movement relative to the 50 level. A cross above 50 suggests rising bullish momentum, while a cross below 50 indicates growing bearish momentum. Traders also watch for breakouts from RSI trendlines, signaling a potential shift in momentum. Furthermore, divergences between price and RSI can provide early warnings of trend exhaustion. For example, if the price makes a higher high but the RSI makes a lower high, it suggests weakening bullish momentum and a possible reversal.
Features and Benefits:
- Uses RSI indicator (typically 14-period): This standard setting can be adjusted based on individual trading styles and market conditions.
- Focuses on momentum rather than just overbought/oversold conditions: This allows for earlier entries and exits compared to traditional RSI usage.
- Identifies RSI trendline breakouts: These breakouts can foreshadow powerful price moves.
- Looks for bullish/bearish divergences: Divergences provide early warning signals of potential trend reversals.
Pros:
- More responsive than moving averages, enabling quicker reactions to market changes.
- Provides early warning of potential trend changes through divergences and trendline breaks.
- Works well in both trending and ranging markets, offering flexibility for diverse trading strategies.
- Helps identify momentum exhaustion, allowing traders to exit positions before reversals occur.
Cons:
- Can provide premature signals in strongly trending markets, leading to whipsaws.
- Requires practice to interpret correctly, as RSI signals can be nuanced.
- Subject to false signals without confirmation from other indicators or price action.
- Less effective in markets with sustained overbought/oversold conditions, as the RSI can remain at extreme levels for extended periods.
Examples of Successful Implementation:
- Apple (AAPL): Bullish RSI divergence in March 2020 preceded a significant recovery in the stock price.
- Tesla (TSLA): The 2021 price decline was foreshadowed by bearish RSI divergence.
- EUR/USD: Bullish momentum was signaled by the RSI crossing above 50 during strong uptrends.
Actionable Tips:
- Use multiple timeframes for confirmation of RSI signals.
- Combine with price action analysis for better entry and exit points.
- Look for RSI to stay above 40 in uptrends and below 60 in downtrends to filter out noise.
- Wait for RSI to confirm price breakouts before entering trades.
- Use 70/30 levels for overbought/oversold signals in ranging markets, but focus on the 50 level in trending markets.
Pioneered By:
The RSI was developed by J. Welles Wilder. Experts like Andrew Cardwell, who developed RSI patterns theory, and Constance Brown, a renowned technical analyst who expanded RSI usage, have further popularized its application in momentum trading.
The RSI Momentum Strategy deserves its place in the list of top momentum trading strategies because it provides a robust and versatile approach to identifying and capitalizing on market trends. By focusing on momentum shifts rather than solely on overbought/oversold conditions, this strategy empowers traders with the insights needed to navigate dynamic market environments effectively.
3. MACD Momentum Strategy
The Moving Average Convergence Divergence (MACD) Momentum Strategy is a popular technical analysis approach that leverages the MACD indicator to identify shifts in momentum and determine the overall direction of a trend. This strategy offers a compelling blend of trend following and momentum trading, making it a versatile tool for traders across various markets and timeframes. Its position within the broader spectrum of momentum trading strategies is solidified by its ability to provide clear signals, confirm trend strength, and anticipate potential reversals.
The MACD indicator itself is calculated by subtracting a longer-term Exponential Moving Average (EMA) (typically 26 periods) from a shorter-term EMA (typically 12 periods). A third line, the signal line (usually a 9-period EMA of the MACD line), is then plotted alongside the MACD line. The histogram, a visual representation of the difference between the MACD line and the signal line, adds another layer of insight.
How it Works:
The MACD Momentum Strategy centers around three key components:
-
Signal Line Crossovers: When the MACD line crosses above the signal line, it generates a bullish signal, suggesting increasing upward momentum. Conversely, a bearish signal occurs when the MACD line crosses below the signal line, indicating potential downward momentum.
-
Histogram Transitions: The histogram’s movement from negative to positive territory and vice versa provides further confirmation of momentum shifts. A positive histogram suggests strengthening bullish momentum, while a negative histogram points towards bearish momentum. Expanding histogram bars indicate accelerating momentum, while contracting bars suggest weakening momentum.
-
Divergences: Divergences between price action and the MACD can signal potential trend reversals. A bullish divergence occurs when the price makes lower lows, but the MACD forms higher lows, suggesting underlying bullish strength. A bearish divergence happens when the price makes higher highs, while the MACD forms lower highs, indicating potential weakness.
Examples of Successful Implementation:
- Amazon (2020): Amazon's strong uptrend in 2020 was confirmed by a consistently positive and expanding MACD histogram, signaling strong bullish momentum.
- S&P 500 (April 2020): A bullish MACD crossover in April 2020 marked the beginning of a new bull market for the S&P 500, highlighting the indicator's ability to identify major trend shifts.
- Gold (2020): A bearish divergence between the price of gold and the MACD preceded a significant top in 2020, demonstrating the value of divergence analysis in anticipating potential reversals.
Actionable Tips for Traders:
- Confirmation: Wait for the MACD line to cross above the signal line and the histogram to turn positive before entering a long position. The reverse applies for short positions.
- Trend Strength: Look for histogram expansion to confirm the strength of the prevailing trend. Contracting histograms can signal weakening momentum.
- Zero Line Crossovers: Pay attention to MACD line crossovers of the zero line. These can often indicate significant shifts in the broader trend.
- Price Action Integration: Combine MACD signals with price action analysis, particularly support and resistance breaks, for more robust trading decisions.
- Parameter Optimization: Consider adjusting the standard (12, 26, 9) MACD settings based on market volatility. Faster settings (e.g., 5, 35, 5) may be more suitable for volatile markets.
Pros and Cons:
Pros:
- Combines trend and momentum analysis into a single indicator.
- Provides clear visual signals through the histogram.
- Effective at capturing trend accelerations and decelerations.
- Works across multiple timeframes and markets.
Cons:
- Lagging indicator that can miss early trend movements.
- Can generate false signals in choppy or sideways markets.
- Can be slow to react to sudden market changes.
- Interpretation of divergences can be subjective.
When and Why to Use This Approach:
The MACD Momentum Strategy is particularly effective in trending markets. It's a valuable tool for traders seeking to identify momentum shifts, confirm trend strength, and anticipate potential reversals. However, it's crucial to understand its limitations and avoid relying solely on MACD signals. Combining MACD with other technical indicators and price action analysis can significantly enhance its effectiveness. This strategy caters to various trading styles, including swing trading and trend following, making it a valuable asset for professional traders, stock market analysts, financial institutions, independent investors, and stock trading educators.
4. Breakout Momentum Strategy
The Breakout Momentum Strategy is a powerful technique within the broader scope of momentum trading strategies. It capitalizes on the sudden surges in price that occur when an asset breaks through established support or resistance levels, or escapes from consolidation patterns. This strategy operates on the principle that a breakout accompanied by increased trading volume often signals the start of a significant price trend in the breakout direction. Traders using this strategy identify crucial price levels or chart patterns, then enter positions when the price decisively moves beyond these points, confirmed by strong volume and potentially other momentum indicators.

This strategy deserves its place on the list of top momentum trading strategies because it offers the potential to capture substantial profits from the very beginning of a major price move. The defining features of the Breakout Momentum Strategy include its focus on price breaking through significant levels or patterns like triangles, flags, or channels; the requirement of volume confirmation to validate the breakout's legitimacy; and the frequent use of momentum indicators like the Relative Strength Index (RSI) or Moving Average Convergence Divergence (MACD) as secondary confirmation tools.
Pros:
- Captures Explosive Moves: This strategy allows traders to potentially enter a trending market at its earliest stages, maximizing profit potential.
- Clear Entry and Exit Points: Breakouts provide well-defined entry points (above the resistance or below the support) and stop-loss levels (just below/above the breakout level).
- Effective in Volatile Markets: Breakout strategies can thrive in volatile markets where price fluctuations create more breakout opportunities.
- High Reward-to-Risk Ratios: Successful breakouts can lead to significant price moves, offering attractive reward-to-risk ratios.
Cons:
- False Breakouts (Fakeouts): Not all breakouts lead to sustained trends. False breakouts can trigger losses if not managed carefully.
- Constant Monitoring: Traders need to actively monitor price action and volume around key levels to identify and capitalize on breakouts effectively.
- Overtrading in Choppy Markets: In sideways or choppy markets, frequent false breakouts can tempt traders to overtrade, leading to accumulated losses.
- Slippage: Quick execution is often crucial to avoid slippage, especially during volatile breakouts.
Examples of Successful Implementation:
- Nvidia (NVDA): The breakout above $300 in 2023 fueled a massive uptrend, demonstrating the power of breakout momentum.
- Bitcoin (BTC): Bitcoin's breakout above $20,000 in December 2020 marked the beginning of a major bull run.
- Crude Oil: The breakdown below support in April 2020 led to a dramatic price drop, showcasing the impact of breakouts on the downside.
Actionable Tips for Breakout Trading:
- Confirmation is Key: Wait for a candle to close beyond the breakout level before entering a trade to avoid being trapped by false breakouts.
- Volume is Paramount: Prioritize volume as the primary confirmation tool. Genuine breakouts typically exhibit a significant increase in trading volume.
- Protect Your Capital: Always set stop-loss orders just below the breakout level for long positions and just above for short positions to limit potential losses.
- Support and Resistance Flip: Watch for prior resistance levels to become support after a breakout, and vice-versa. This can provide further confirmation and potential entry points.
- Consider Options: Using options for breakout trades can limit risk while maximizing leverage and capturing potential upside.
When and Why to Use the Breakout Momentum Strategy:
This strategy is particularly effective during periods of increased market volatility and when clear support and resistance levels or consolidation patterns are identifiable. It’s suitable for traders who are comfortable with actively monitoring the markets and can react quickly to changing price action. By understanding the dynamics of breakouts and employing proper risk management techniques, traders can leverage this strategy to capture substantial profits from trending markets.
Influential Figures in Breakout Trading:
This strategy has been popularized by traders like Jesse Livermore, an early practitioner of breakout trading; William O'Neil, founder of the CANSLIM method; Nicolas Darvas, developer of the Darvas Box method; and Mark Minervini, a champion stock trader known for his SEPA strategy. Their contributions have cemented the Breakout Momentum Strategy as a cornerstone of technical analysis and active trading.
5. Momentum Divergence Strategy
The Momentum Divergence Strategy is a powerful tool within the arsenal of momentum trading strategies. It capitalizes on identifying discrepancies between price action and momentum indicators. Essentially, it looks for situations where the price of an asset makes a new high or low, but a corresponding momentum oscillator, such as the Relative Strength Index (RSI), Stochastic Oscillator, Moving Average Convergence Divergence (MACD), or Rate of Change, fails to confirm that new extreme. This divergence can signal waning momentum and a potential trend reversal, offering valuable insights for traders. This strategy is particularly effective in identifying not only when an existing trend is losing steam but also potential points of reversal, enabling traders to exit positions before significant trend changes occur or even enter countertrend positions early.

This strategy hinges on the principle that momentum often precedes price. A bearish divergence, for instance, occurs when the price reaches a new high, but the momentum indicator makes a lower high, suggesting that the upward momentum is weakening. Conversely, a bullish divergence forms when the price hits a new low, but the momentum indicator registers a higher low, indicating potential buying pressure. The Momentum Divergence Strategy isn't limited to spotting impending reversals; it also encompasses "hidden divergences," where the oscillator makes a new high/low while the price doesn't, often signaling trend continuation. This nuanced approach makes it a valuable tool for traders of all styles, from day traders to long-term investors.
Examples of Successful Implementation:
Several historical market events highlight the effectiveness of the Momentum Divergence Strategy. The S&P 500 exhibited a bearish RSI divergence in January 2020, just before the COVID-19 market crash. Similarly, Tesla stock showed multiple bearish divergences throughout 2021, preceding significant corrections. On the bullish side, gold displayed a bullish divergence in late 2022, which foreshadowed its recovery in 2023. These examples underscore the strategy's potential to identify major market turning points.
Actionable Tips for Using the Momentum Divergence Strategy:
- Confirmation is Key: Never rely solely on divergences. Confirm them with additional technical evidence like candlestick patterns, volume analysis, or other indicators.
- Timeframe Matters: Divergences on higher timeframes (e.g., daily, weekly) generally carry more weight than those on lower timeframes (e.g., hourly, 15-minute).
- Multiple Indicators: Using multiple momentum oscillators can increase the reliability of divergence signals. If the RSI and Stochastic both show a divergence, the signal is stronger.
- Regular vs. Hidden: Remember, regular divergences are typically better for spotting reversals, while hidden divergences often suggest trend continuation.
- Price Confirmation: Wait for price action to confirm the divergence, such as a break of a trendline or a key support/resistance level, before entering or exiting a trade.
Pros and Cons:
Pros:
- Early warning of potential trend reversals.
- Applicable across various market conditions and timeframes.
- Potential to identify major market turning points.
- Can create high reward-to-risk trading opportunities.
Cons:
- Divergences can sometimes persist for extended periods before price reacts.
- Requires confirmation from price action.
- Can lead to premature exits in strong trending markets.
- Pattern recognition can be subjective and requires experience.
This strategy deserves a prominent place in any discussion of momentum trading strategies because of its versatility and potential for identifying high-probability trading setups. By understanding the nuances of momentum divergences, traders can gain a significant edge in navigating the complexities of the financial markets. Pioneered by technical analysis giants like John Murphy, Stan Weinstein, Tom DeMark, and Martin Pring, the Momentum Divergence Strategy remains a relevant and powerful tool for professional traders, stock market analysts, financial institutions, and independent investors alike.
6. Volume-Weighted Momentum Strategy
For traders seeking an edge in momentum trading strategies, incorporating volume analysis can significantly enhance the probability of success. The Volume-Weighted Momentum Strategy combines traditional momentum indicators with volume-based indicators to filter out weak signals and identify sustainable trends. This approach rests on the principle that genuine, powerful price movements are typically accompanied by a corresponding surge in volume, reflecting strong conviction and participation from institutional investors and other significant market players.
How it Works:
This strategy goes beyond simply identifying price momentum. It delves into the underlying strength of that momentum by analyzing trading volume. Are large volumes confirming the price move, suggesting real buying or selling pressure? Or is the price moving on thin volume, potentially signaling a false breakout or a manipulation? By integrating volume analysis, traders can gain a more comprehensive understanding of market dynamics and avoid being trapped in weak or unsustainable trends.
Volume-weighted momentum strategies often utilize indicators such as:
- On-Balance Volume (OBV): A running total of volume, adding volume on up days and subtracting volume on down days. A rising OBV confirms a bullish trend, while a falling OBV suggests underlying weakness even if the price is rising.
- Chaikin Money Flow (CMF): Measures the amount of money flowing into or out of a security over a specific period. Positive CMF values indicate buying pressure, while negative values suggest selling pressure.
- Accumulation/Distribution Line (A/D): Similar to OBV, but weighs volume based on the closing price's position within the day's range. It provides a more nuanced view of buying and selling pressure.
- Volume-Price Trend (VPT): Calculates the cumulative volume adjusted by the percentage change in price. It helps confirm the strength of price trends and identify potential divergences.
These volume indicators are used in conjunction with traditional momentum indicators like the Relative Strength Index (RSI), Moving Average Convergence Divergence (MACD), and stochastic oscillators to paint a more complete picture of market momentum.
Examples of Successful Implementation:
- GameStop (GME) 2021 Short Squeeze: The massive volume spike preceding and during the GME short squeeze was a clear signal of extraordinary buying pressure and momentum. A volume-weighted strategy would have highlighted this unusual activity.
- Apple (AAPL) Long-Term Uptrend: Apple's consistent volume expansion during key breakouts throughout its long-term uptrend has provided confirmation of the strength and sustainability of its price advances.
- Bitcoin (BTC) 2021 Price Peak: Diminishing volume during Bitcoin's 2021 price peak signaled weakening momentum and foreshadowed the subsequent correction, illustrating the importance of volume confirmation.
Actionable Tips for Traders:
- Look for Volume to Increase in the Direction of the Trend: Increasing volume during uptrends and decreasing volume during downtrends confirms the strength of the prevailing trend.
- Be Suspicious of Price Movements Without Corresponding Volume: Price movements on low volume can be misleading and may not represent genuine market sentiment.
- Use Volume-Price Trend (VPT) to Confirm Price Breakouts: A rising VPT during a price breakout confirms the strength of the breakout and suggests a higher probability of follow-through.
- Monitor for Volume Divergences: If price makes new highs while volume fails to confirm, it could signal a weakening trend and a potential reversal.
- Consider using the Volume Weighted Average Price (VWAP) as a dynamic support/resistance level: VWAP can help identify potential entry and exit points.
Why This Strategy Deserves Its Place in the List:
The Volume-Weighted Momentum Strategy adds a crucial layer of analysis to traditional momentum trading. By incorporating volume, traders can significantly reduce false signals, distinguish between genuine trends and manipulated moves, and identify more sustainable trading opportunities. While more complex than pure price-based strategies, the potential for improved accuracy and profitability makes it a valuable tool for professional traders, analysts, and serious investors.
Pros:
- Reduces false signals by requiring volume confirmation.
- Helps distinguish between genuine trends and manipulated moves.
- More effective in identifying sustainable trends.
- Works particularly well in equity and cryptocurrency markets.
Cons:
- Less effective in futures or forex markets where volume data may be incomplete or unreliable.
- Requires monitoring multiple indicators simultaneously.
- Volume data can sometimes be misleading due to market structure and other factors.
- More complex to implement than pure price-based strategies.
This strategy, popularized by figures like Joseph Granville (OBV), Marc Chaikin (CMF, A/D), Richard Arms (TRIN), and David Bostian, highlights the importance of volume analysis in understanding market dynamics and improving the effectiveness of momentum trading strategies. It offers a more robust and nuanced approach for navigating the complexities of the financial markets.
7. Sector Rotation Momentum Strategy
The Sector Rotation Momentum Strategy is a powerful approach within the broader umbrella of momentum trading strategies. It capitalizes on the cyclical nature of the economy and the tendency of different market sectors to outperform at various stages. Instead of focusing on the absolute price movement of individual stocks, this strategy emphasizes the relative strength of different sectors compared to the overall market, allowing traders to potentially capture outperformance by rotating investments into the leading sectors.
How it Works:
This strategy involves identifying sectors exhibiting the strongest relative momentum, often measured against a benchmark index like the S&P 500. By analyzing economic indicators and market trends, traders anticipate which sectors are likely to thrive in the prevailing economic environment. As economic conditions shift, momentum rotates between sectors such as technology, healthcare, utilities, financials, and energy. This rotation creates opportunities for traders to profit by reallocating capital to the currently leading sectors. For instance, during periods of economic expansion, technology and consumer discretionary sectors might flourish, while during recessions, defensive sectors like utilities and consumer staples tend to hold up better.
Examples of Successful Implementation:
Several historical examples illustrate the effectiveness of sector rotation:
- Technology Sector (2020-2021): The technology sector exhibited significant momentum leadership during the pandemic, driven by increased demand for remote work and communication technologies.
- Energy Sector (2022): Amidst inflationary pressures and supply constraints, the energy sector dramatically outperformed the broader market in 2022.
- Utilities and Consumer Staples (Economic Uncertainty): These defensive sectors often display relative strength during periods of economic uncertainty, as investors seek refuge in stable, dividend-paying companies.
Actionable Tips for Implementing Sector Rotation:
- Utilize Relative Strength Ratio Charts: Compare the performance of a sector ETF against the S&P 500 (e.g., XLC/SPY for Technology) to identify leading and lagging sectors.
- Consider Economic Cycle Positioning: Align sector choices with the current phase of the economic cycle. For example, favor cyclical sectors during expansion and defensive sectors during contraction.
- Implement a Ranking System: Develop a ranking system based on a combination of momentum and relative strength metrics to prioritize sector allocation.
- Gradual Rotation: Rotate your portfolio gradually rather than making abrupt shifts to mitigate timing risks.
- Use Multiple Timeframes: Incorporate both short-term (4-12 weeks) and intermediate-term (3-6 months) momentum indicators for a more comprehensive view.
Pros and Cons:
Pros:
- Diversification with Focus: Provides diversification benefits while concentrating investments in the strongest sectors.
- Potential for Outperformance: Offers the potential to outperform the broader market by capitalizing on leading sectors.
- Works in Both Bull and Bear Markets: Can be adapted to various market environments.
- Reduced Individual Stock Risk: Less susceptible to the risks associated with individual stock picking.
Cons:
- Frequent Monitoring and Adjustments: Requires ongoing monitoring and potential portfolio adjustments.
- Increased Transaction Costs: Frequent rotation can lead to higher transaction costs.
- Lagging Performance During Regime Changes: May underperform during rapid market shifts before new leadership emerges.
- Vulnerability to Market Reversals: Performance can lag during market reversals before new sector leadership is established.
Why This Strategy Deserves Its Place in the List:
The Sector Rotation Momentum Strategy provides a structured and disciplined approach to momentum trading. By focusing on relative strength and incorporating economic cycle analysis, it offers traders a powerful tool to potentially outperform the market and manage risk. Its versatility across different market conditions and ability to diversify holdings while concentrating on strength makes it a valuable addition to any momentum trader's toolkit. This strategy has been popularized by prominent figures like Sam Stovall, John Murphy, Julius de Kempenaer, and Dorsey Wright & Associates, further solidifying its relevance and importance in the world of momentum trading. This makes it particularly relevant for professional traders, stock market analysts, financial institutions, independent investors, stock trading educators, and users of stock scanners and screeners.
8. Mean Reversion with Momentum Filter Strategy
The Mean Reversion with Momentum Filter Strategy represents a sophisticated approach to momentum trading strategies by combining the principles of mean reversion and momentum. This hybrid approach seeks to capitalize on the tendency of prices to revert to an average after significant deviations, but only when the broader market or sector momentum supports the reversal. This added layer of analysis helps avoid fighting against strong trends, a common pitfall of pure mean reversion strategies, while still allowing traders to profit from overextended price movements likely to correct. This nuanced strategy caters particularly well to professional traders, stock market analysts, financial institutions, independent investors, stock trading educators, and those using stock scanners and screeners for day trading.
This strategy deserves its place on this list because it enhances the effectiveness of traditional mean reversion. By incorporating a momentum filter, it addresses a key weakness of mean reversion: false signals generated during strong trends. Instead of simply betting on price returning to an average, this strategy waits for confirmation from the prevailing momentum, resulting in higher probability trades.
How it Works:
The core of this strategy lies in identifying potential mean reversion setups using indicators like Bollinger Bands or extreme RSI readings (e.g., overbought above 70 or oversold below 30). However, instead of immediately acting on these signals, a momentum filter is applied. This often involves analyzing a longer timeframe trend to confirm that the short-term mean reversion opportunity aligns with the overall market direction. For example, a trader might look for oversold conditions (RSI below 30) in a particular stock, but only enter a long position if the stock's sector ETF exhibits positive momentum. This multi-timeframe analysis helps to ensure the trade isn't fighting against a larger downtrend.
Features and Benefits:
- Combines mean reversion indicators (Bollinger Bands, RSI extremes) with momentum filters: This combination provides a more robust signal than either approach used in isolation.
- Uses longer-term momentum trend to filter short-term mean reversion opportunities: This helps avoid trading against the prevailing trend.
- Often incorporates multiple timeframe analysis: Analyzing different timeframes provides a more comprehensive view of market dynamics.
- Balances countertrend and trend-following approaches: This balanced approach allows the strategy to adapt to different market conditions.
- Offers earlier entries than pure trend following: By anticipating reversals within a trend, this strategy can provide earlier entry points than waiting for a full trend reversal.
Examples:
- Buying a stock exhibiting oversold conditions (RSI below 30) only when its sector shows positive momentum.
- Trading pullbacks to the 20-day moving average only when the price remains above the 200-day moving average.
- Employing the Connors RSI strategy filtered by longer-term ADX readings above 20 to confirm strong directional momentum.
Pros and Cons:
Pros:
- Reduces false signals common in pure mean reversion strategies.
- Improves win rate by aligning with underlying momentum.
- Works well in both trending and range-bound markets.
Cons:
- More complex to implement than single-approach strategies.
- Requires tracking multiple indicators across timeframes.
- Can miss opportunities when momentum filters are too strict.
- Potential parameter optimization challenges.
Actionable Tips:
- Use a higher timeframe momentum direction to filter lower timeframe mean reversion signals.
- Consider the market regime before applying this strategy (more mean reversion in range-bound markets, more momentum in trending markets).
- Apply stricter mean reversion thresholds in strong trending markets.
- Combine with volume analysis for additional confirmation.
- Set stops beyond logical invalidation points rather than using fixed percentages.
This strategy has been popularized by influential figures in the trading world, including Larry Connors, Linda Raschke, Toby Crabel, and Brett Steenbarger, each of whom has contributed to the understanding and application of hybrid momentum and mean reversion approaches. Learn more about Mean Reversion with Momentum Filter Strategy This link provides valuable insights into data-driven trading tips specifically related to mean reversion strategies. By understanding and applying these concepts, traders can potentially enhance their profitability and navigate the complexities of the financial markets more effectively.
Momentum Trading Strategies Comparison
| Strategy | Implementation Complexity 🔄 | Resource Requirements ⚡ | Expected Outcomes 📊 | Ideal Use Cases 💡 | Key Advantages ⭐ |
|---|---|---|---|---|---|
| Moving Average Crossover Strategy | Low | Low (two MAs, basic data) | Medium-to-long term trend capture | Medium to long-term trend trading | Simple, removes emotional bias, easy automation |
| RSI Momentum Strategy | Medium | Moderate (RSI indicator, multiple timeframes) | Early trend change signals | Trending and ranging markets | Responsive, early warnings, momentum exhaustion identification |
| MACD Momentum Strategy | Medium | Moderate (MACD calculation, histogram) | Balanced trend and momentum capture | Trend following and momentum trading | Combines trend and momentum, clear visual signals |
| Breakout Momentum Strategy | Medium-High | Moderate-High (price levels, volume monitoring) | Capture explosive price moves early | Volatile markets, pattern breakouts | High reward/risk, clear entry and stops |
| Momentum Divergence Strategy | High | Moderate (multiple oscillators, divergence analysis) | Early reversal warnings | All market conditions, trend reversal spotting | Early warnings, high reward/risk opportunities |
| Volume-Weighted Momentum Strategy | Medium-High | High (volume and momentum indicators) | Sustainable trend identification | Equities, cryptocurrencies with reliable volume | Reduces false signals, confirms genuine momentum |
| Sector Rotation Momentum Strategy | High | High (sector data, economic cycle analysis) | Outperformance via sector allocation | Portfolio management across economic cycles | Diversification, focuses on strongest sectors |
| Mean Reversion with Momentum Filter Strategy | High | High (mean reversion + momentum indicators, multi-timeframe) | Improved win rate, reduced false signals | Range-bound and trending markets, hybrid approach | Robust, balances countertrend and trend following |
Mastering Momentum: Your Path to Trading Success
This article explored eight powerful momentum trading strategies, from classic moving average crossovers and RSI indicators to advanced techniques like momentum divergence and sector rotation. Mastering these strategies, coupled with a deep understanding of market dynamics, can significantly enhance your ability to identify and capitalize on trending assets. Key takeaways include recognizing the importance of volume analysis in confirming momentum, understanding the role of risk management in protecting your capital, and appreciating how different momentum strategies can be combined for a more robust approach.
To effectively implement these momentum trading strategies requires staying informed and organized. Keeping up with market trends, breaking news, and expert analysis is crucial for informed trading decisions. To streamline this process and enhance your trading workflow, consider using social media management tools to aggregate relevant information from trusted sources. These tools, as highlighted in Top Social Media Management Tools for 2025 from Schedul, can help you curate a personalized feed of market intelligence, keeping you ahead of the curve.
By consistently applying these momentum trading strategies and continuously refining your approach, you can position yourself for long-term success in the dynamic world of financial markets. Remember, consistent practice and informed decision-making are the cornerstones of profitable trading. Ready to put these powerful strategies into action? ChartsWatcher empowers you to visualize and analyze market momentum with advanced charting, customizable dashboards, and real-time data. Visit ChartsWatcher and unlock the potential of momentum trading today.
