Top Market Sentiment Indicators for Smarter Trading in 2025
Decoding the Market's Mood
Understanding market sentiment is crucial for profitable trading. This listicle reveals 8 powerful market sentiment indicators to enhance your trading strategies. By interpreting these indicators, you can anticipate market shifts and make better decisions. We'll cover the VIX, Put/Call Ratio, AAII Sentiment Survey, CNN Fear & Greed Index, COT Report, Margin Debt Levels, Market Breadth Indicators, and the Bullish Percent Index. ChartsWatcher can help you monitor these key market sentiment indicators efficiently. Let's dive into the 8 indicators you should be watching.
1. CBOE Volatility Index (VIX)
The CBOE Volatility Index (VIX), frequently dubbed the "fear gauge" or "fear index," is a key market sentiment indicator providing a quantifiable measure of anticipated market risk and investor sentiment. It calculates the market's expectation of 30-day forward-looking volatility derived from S&P 500 index options. Essentially, it measures how much investors are willing to pay to protect themselves against potential market swings. A high VIX (typically above 20) suggests increased market fear or uncertainty, while a low VIX (below 20) generally points to market complacency or confidence.
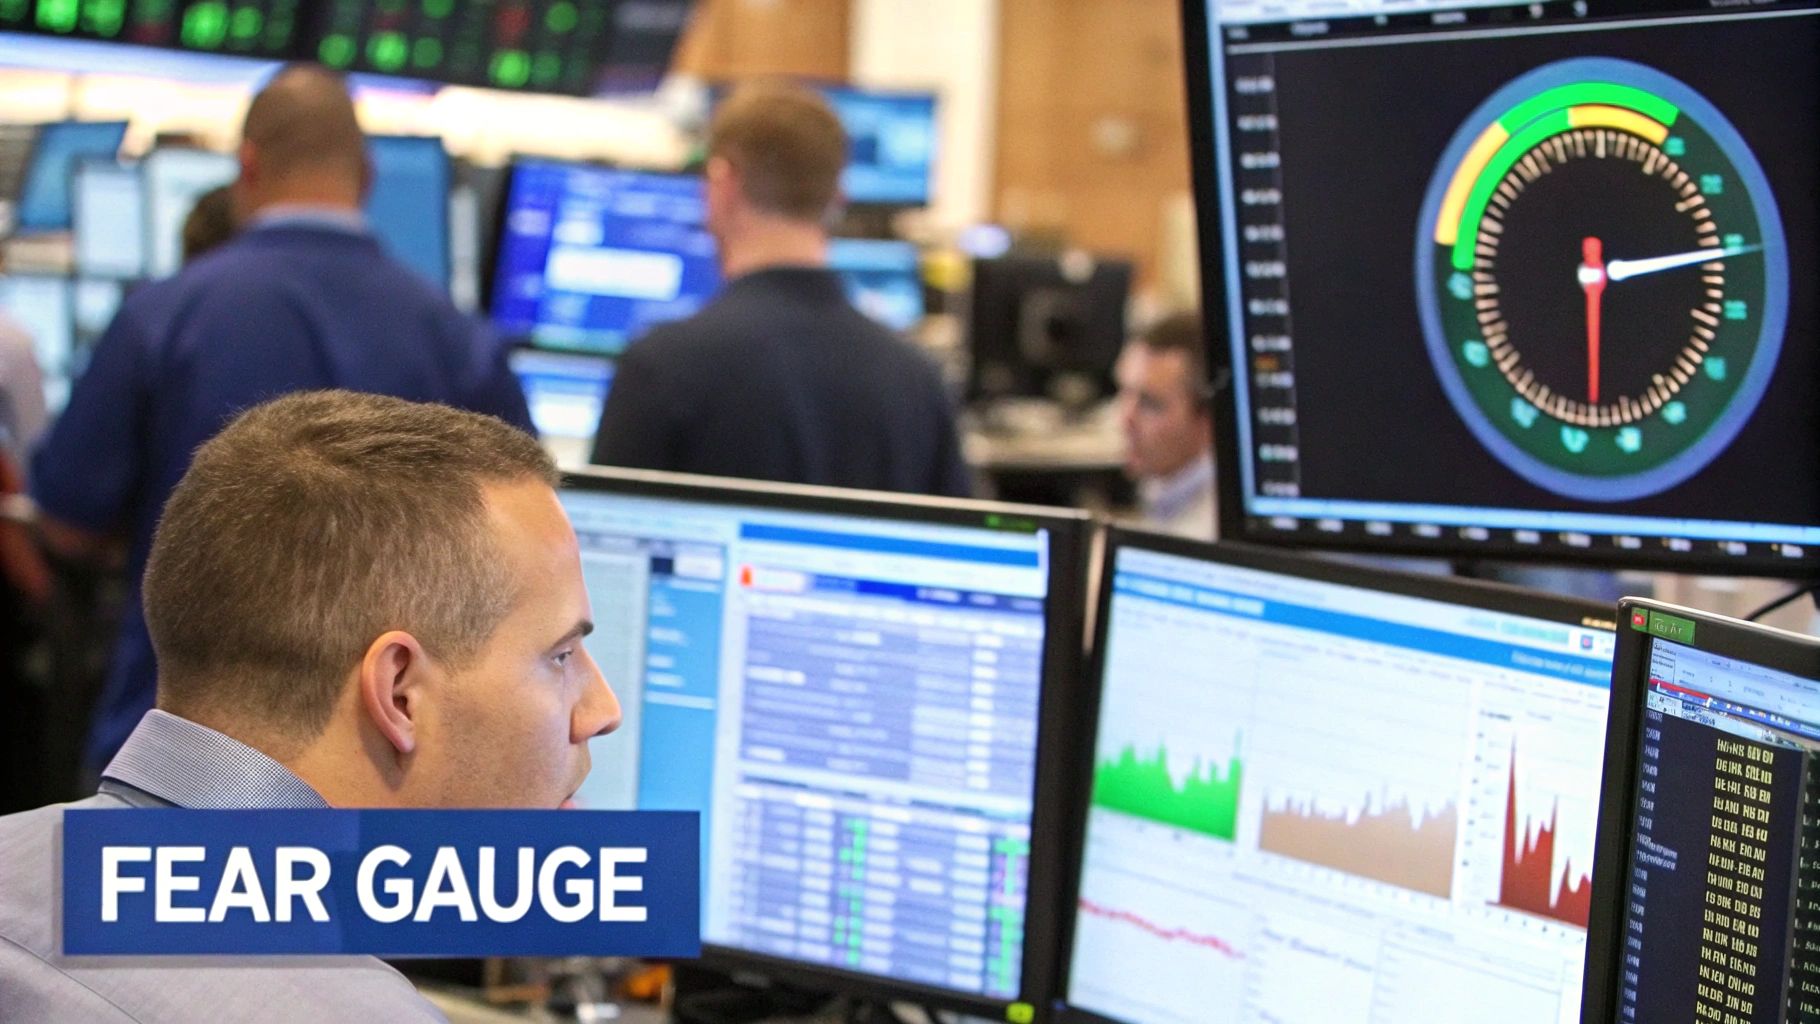
The VIX holds a prominent position among market sentiment indicators due to its real-time calculation throughout the trading day, its derivation from S&P 500 index option prices, and its mean-reverting tendency. It offers a forward-looking measure of expected volatility, quoted in percentage points representing the expected movement in the S&P 500 index over the next 30 days. This allows traders and investors to gauge the potential magnitude of market fluctuations.
Features and Benefits:
- Real-time Calculation: Provides up-to-the-minute insights into market sentiment.
- Derived from S&P 500 Options: Reflects the collective wisdom of options traders.
- Forward-Looking: Offers a glimpse into expected future volatility.
- Standardized Measure: Facilitates comparisons across different time periods and market conditions.
- Widely Tracked: Used by institutional investors and individual traders alike.
- Tradable: VIX futures and Exchange Traded Products (ETPs) allow for direct trading strategies based on volatility.
Pros:
- Strong Negative Correlation with Market Returns: Often rises when the market falls, and vice-versa.
- Excellent Contrarian Indicator: Extreme readings can signal potential market reversals.
- Tradable via Futures and ETPs: Offers opportunities for hedging and speculative trading.
Cons:
- Can Remain at Extremes: High or low VIX levels can persist longer than anticipated.
- Not Always Predictive: While a useful indicator, it doesn't guarantee future market direction.
- ETP Nuances: VIX ETPs are based on futures contracts, not the spot VIX, which can lead to different performance characteristics.
- Complex Calculation: The methodology behind the VIX calculation can be challenging to grasp fully.
- Technical Influences: Can be affected by factors beyond pure market sentiment.
Examples of Successful Implementation:
- March 2020 COVID-19 Crash: The VIX spiked to 82.69, its highest level since the 2008 financial crisis, accurately reflecting the extreme market fear.
- 2017 Market Complacency: The VIX hit historic lows below 10 during periods of market complacency before the 2018 volatility spike, serving as a warning sign for astute observers.
- Portfolio Hedging: Portfolio managers use the VIX to time the implementation of hedging strategies, protecting their investments from potential market downturns.
Actionable Tips:
- Look for Divergences: Analyze divergences between VIX movement and price action in the S&P 500.
- Extreme Readings as Signals: Readings above 30 or below 12 often signal potential market inflection points.
- Historical Context: Compare current VIX levels to its historical average around 19-20.
- VIX Term Structure: Analyze the VIX term structure (comparing different VIX futures expirations) for additional insights.
- Use with Other Indicators: Consider VIX in conjunction with other market sentiment indicators for a more comprehensive analysis.
For professional traders, stock market analysts, financial institutions, and independent investors, understanding and utilizing the VIX is crucial for navigating market volatility and making informed investment decisions. Whether used for hedging, speculative trading, or simply gauging market sentiment, the VIX remains a powerful tool in the arsenal of market participants.
2. Put/Call Ratio
The Put/Call Ratio is a valuable market sentiment indicator that provides insights into the overall bullishness or bearishness of traders. It achieves this by comparing the volume or open interest of put options to call options. Put options give the holder the right, but not the obligation, to sell an asset at a specific price, while call options grant the right to buy. Therefore, a higher demand for puts relative to calls suggests a bearish outlook, while the opposite indicates a bullish sentiment. This contrarian nature allows traders to identify potential turning points in the market.
The Put/Call Ratio is typically expressed as a simple ratio (e.g., 0.85), where a value above 1.0 indicates more puts are being traded than calls, signaling bearish sentiment. Conversely, a ratio below 0.7 suggests a bullish bias. It's worth noting that "extreme" readings can vary depending on market conditions and historical context. Moving averages, such as a 5-day or 10-day moving average, can help smooth out daily fluctuations and provide a clearer trend. This indicator deserves its place on the list of market sentiment indicators due to its direct measurement of options market positioning, its readily available data, and its ability to identify potential market reversals, especially at extreme readings.
Features and Benefits:
- Versatile Data: Can be calculated using either volume or open interest data.
- Broad Applicability: Available for individual stocks, specific sectors, or broad market indices like the S&P 500.
- Easy Interpretation: Presented as a simple ratio or as a moving average for trend analysis.
- Varied Perspectives: Equity-only and index put/call ratios can be analyzed separately for more nuanced insights. The equity-only ratio often provides clearer sentiment signals as it's less influenced by hedging activities common in index options.
- Capitulation Identification: Can pinpoint moments of extreme pessimism or optimism, potentially signaling market bottoms or tops respectively.
Pros:
- Effective Contrarian Indicator: Particularly useful at extreme readings.
- Direct Market Measurement: Reflects actual options market activity and positioning.
- Accessible and User-Friendly: Data is readily available and the ratio is easy to interpret.
Cons:
- False Signals: Can be misleading during strong trending markets.
- Limited Scope: Doesn't account for complex options strategies involving both puts and calls simultaneously.
- Hedging vs. Directional Bets: Difficulty distinguishing between options used for hedging purposes and those used for directional bets.
- Subjectivity of Extremes: Defining "extreme" readings can be subjective and varies across different market regimes.
- Institutional Influence: Large institutional options activity can skew the readings.
Examples of Successful Implementation:
- March 2020: The CBOE equity put/call ratio spiked to 1.28 near the pandemic market bottom, correctly signaling excessive bearishness.
- 2021 Bull Market: Consistently low put/call ratios below 0.6 were observed during much of the 2021 bull market before corrections occurred.
- October 2022: The indicator signaled excessive bearishness before the market rebound.
Tips for Using the Put/Call Ratio:
- Focus on Equity-Only: Prioritize the equity-only put/call ratio for clearer sentiment signals.
- Historical Context: Compare current readings to historical averages and extremes to understand their significance.
- Moving Averages: Employ a 5-day or 10-day moving average to smooth out daily fluctuations.
- Market Regime Awareness: Recognize that "extreme" levels vary depending on the overall market environment.
- Divergence Analysis: Look for divergences between put/call ratios and price action for potential trend reversals.
Popularized By:
- Chicago Board Options Exchange (CBOE)
- Larry McMillan, options strategist and author
- SentimenTrader, a sentiment research service
This indicator is particularly useful for professional traders, stock market analysts, financial institutions, and independent investors seeking to gauge market sentiment and anticipate potential turning points. Day traders can also benefit from intraday put/call ratio analysis, although it requires careful interpretation due to higher volatility. Stock trading educators can utilize the put/call ratio as a teaching tool to demonstrate the importance of understanding market sentiment. Finally, both stock scanners and screeners can incorporate the put/call ratio into their algorithms to identify potential trading opportunities.
3. American Association of Individual Investors (AAII) Sentiment Survey
The American Association of Individual Investors (AAII) Sentiment Survey is a valuable tool for gauging market sentiment indicators, specifically focusing on the outlook of retail investors. It's a weekly poll that asks individual investors about their expectations for the stock market over the next six months, categorizing their responses as bullish, bearish, or neutral. This survey, running since 1987, offers a unique, long-term perspective on the psychological landscape of the market, and is often used as a contrarian indicator.
How it Works:
The AAII surveys its members weekly, asking a simple question: "What direction do you think the stock market will move over the next six months?" The percentage of respondents falling into each category (bullish, bearish, and neutral) is then calculated and published every Thursday. These percentages provide a snapshot of retail investor sentiment, revealing the prevailing optimism or pessimism about the market's near-term future. A high percentage of bullish responses can often suggest excessive optimism and a potential market top, while a high percentage of bearish responses might indicate excessive pessimism and a potential market bottom.
Examples of Successful Implementation:
The AAII Sentiment Survey has a history of highlighting extreme sentiment readings that often precede significant market turns. For instance, during the market bottom in December 2018, bearish sentiment reached 50.3%, which was followed by a strong market rally. Similarly, in March 2020, near the pandemic market bottom, bearish sentiment spiked to 52.1%, marking another sentiment extreme. On the other hand, bullish sentiment reached a high of 63.3% in January 2021, preceding several market corrections throughout the year. These examples illustrate the survey's potential as a contrarian indicator.
Actionable Tips for Using the AAII Sentiment Survey:
- Look for Extremes: Readings that are two standard deviations from historical averages can signal potential turning points.
- Key Thresholds: Pay close attention when bullish readings drop below 25% (potential buying opportunity) or rise above 55% (potential selling opportunity).
- Bull-Bear Spread: Compare the current difference between bullish and bearish sentiment to historical extremes for additional context.
- Confirmation is Key: Use the AAII survey in conjunction with other market sentiment indicators, such as the Put/Call Ratio or the VIX, to confirm potential signals.
- Smoothing the Data: Consider using an 8-week moving average of the sentiment data to filter out short-term noise and identify more sustained sentiment shifts.
When and Why to Use This Approach:
The AAII Sentiment Survey is particularly useful for investors who follow a contrarian investment strategy. By understanding the prevailing sentiment among retail investors, you can identify potential opportunities to buy when others are fearful and sell when others are greedy. This approach is best suited for medium- to long-term investors, as the weekly frequency of the survey might not capture rapid sentiment shifts relevant to short-term traders.
Pros and Cons:
Pros:
- Simple to understand and interpret
- Effective contrarian indicator at extreme readings
- Provides insights into retail investor psychology
- Long history allows for meaningful comparisons
- Free data available to the public (www.aaii.com)
Cons:
- Sample size limitations (typically 200-300 respondents per week)
- Represents only AAII members, who may not be fully representative of all retail investors
- Weekly frequency may not capture rapid sentiment shifts
- Self-reporting bias may affect accuracy
- Extreme readings can persist for extended periods without immediate market reactions
Why It Deserves Its Place in the List:
The AAII Sentiment Survey provides a valuable and readily available gauge of retail investor sentiment. While it shouldn't be used in isolation, its long history, ease of interpretation, and contrarian nature make it a powerful tool for investors looking to incorporate market psychology into their decision-making process. Its popularity amongst professional traders, analysts, and individual investors alike solidifies its importance as a key market sentiment indicator. It’s regularly featured in financial publications like Barron's and championed by experts such as Charles Rotblut, VP at AAII and editor of the AAII Journal.
4. CNN Fear & Greed Index
The CNN Fear & Greed Index is a valuable market sentiment indicator that helps investors gauge the prevailing emotions driving market behavior. It synthesizes seven distinct market factors into a single, easily digestible score, ranging from 0 ("Extreme Fear") to 100 ("Extreme Greed"). This index aims to identify potential market turning points by tracking whether fear or greed is the dominant force. This makes it a practical tool for anyone from seasoned professionals to casual investors trying to understand the market's psychological landscape.
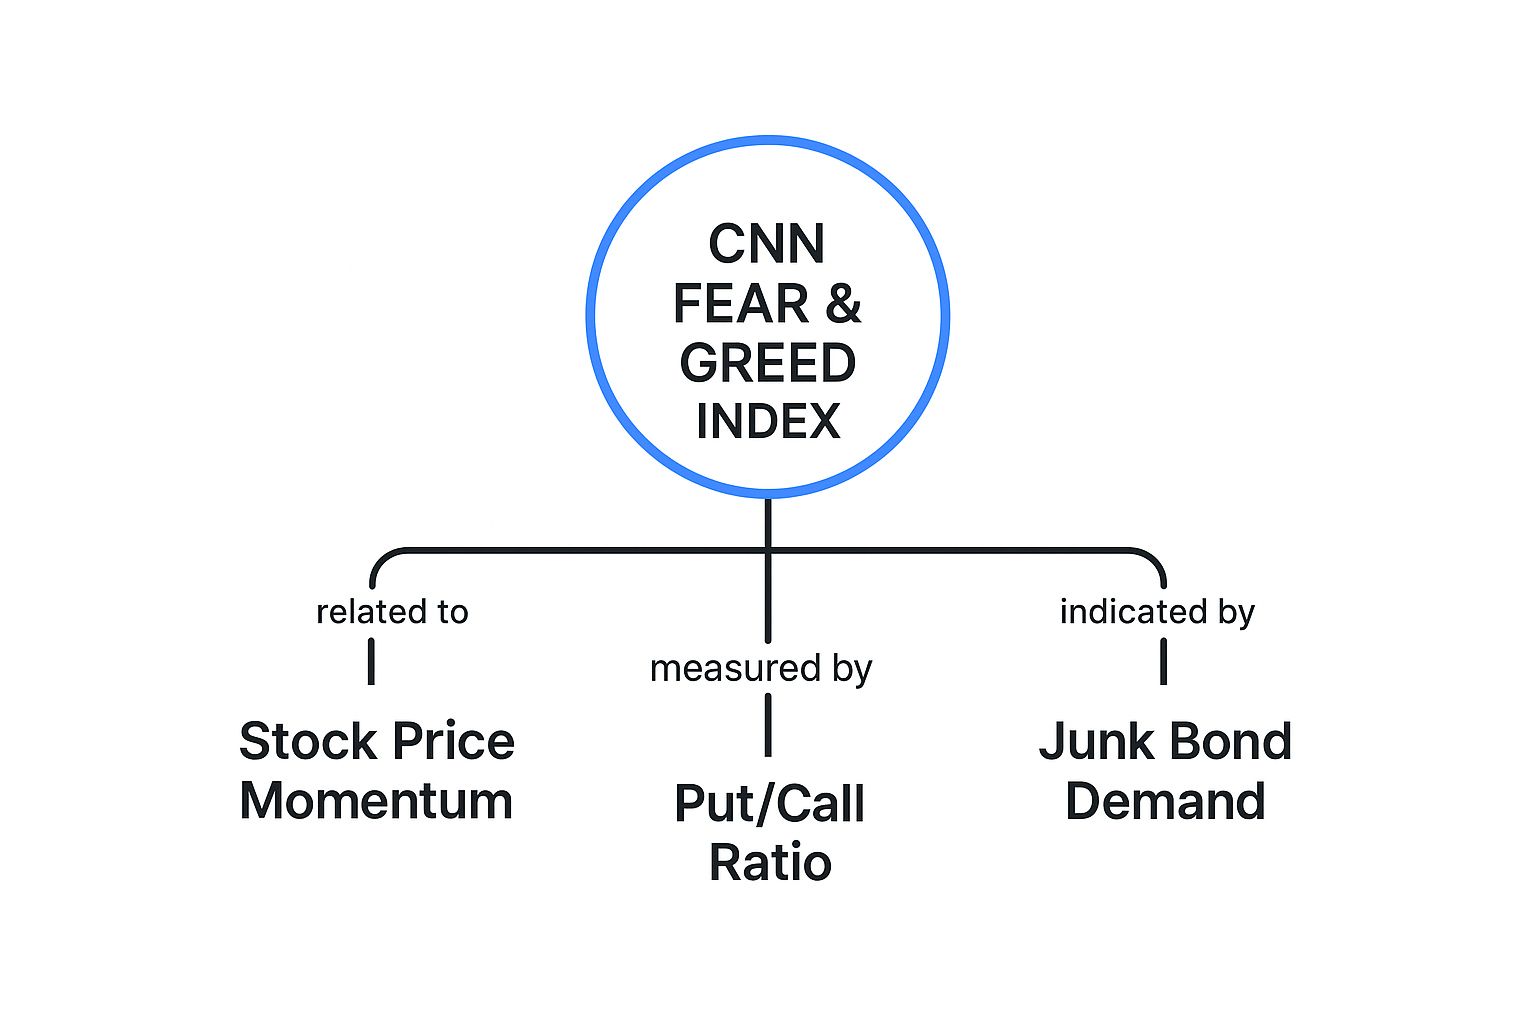
The infographic above visually represents the key concepts behind the CNN Fear & Greed Index. The central concept, "Market Sentiment," is influenced by two primary emotions: "Fear" and "Greed." These emotions are measured through seven key indicators: Stock Price Momentum, Stock Price Strength, Stock Price Breadth, Put/Call Options Ratio, Junk Bond Demand, Market Volatility, and Safe Haven Demand. The infographic highlights the relationship between these seven indicators and the overall sentiment score, emphasizing how extreme readings can signal potential market reversals. As shown, extreme levels of either fear or greed often precede a shift in market direction.
The index's power lies in its composite nature, incorporating stock price momentum, strength, and breadth alongside put/call ratios, junk bond demand, market volatility, and safe haven demand. This multi-faceted approach provides a more robust sentiment reading than relying on a single data point. The 0-100 scale, with defined ranges for Extreme Fear (0-25), Fear (26-45), Neutral (46-55), Greed (56-75), and Extreme Greed (76-100), allows for quick and intuitive interpretation, even for those new to market analysis. The index is updated daily and provides historical views (7-day, 1-month, and 1-year), providing valuable context for current readings.
Pros:
- Intuitive and Visually Accessible: Easy to understand, even for beginners.
- Comprehensive: Combines multiple indicators for a more robust reading.
- Contrarian Indicator: Extremes can signal potential turning points.
- Free and Widely Followed: Easily accessible and frequently discussed.
- Historical Context: Provides current and historical data for comparison.
Cons:
- Proprietary Calculation: Limited transparency on weighting methodology.
- Extended Extremes: Can remain at extreme levels for prolonged periods.
- Lagging Indicator: May lag behind major market turns due to its composite nature.
- Limited Sentiment Granularity: Doesn't differentiate between retail and institutional sentiment.
- Relatively Short History: Less long-term data compared to other indicators.
Examples of Successful Implementation:
- March 2020: Reached "Extreme Fear" (2) during the COVID-19 crash, preceding a significant market rally.
- January 2020: Registered "Extreme Greed" (above 90) before the pandemic-induced market downturn.
- December 2018: Showed "Extreme Fear" near the market bottom, potentially signaling a buying opportunity.
Tips for Using the CNN Fear & Greed Index:
- Contrarian Signals: Consider extreme readings (below 20 or above 80) as potential contrarian signals.
- Divergence Analysis: Look for divergences between the index and market price action.
- Component Analysis: Examine the individual components driving the overall reading.
- Historical Context: Compare the current reading to recent history.
- Broader Framework: Use the index as one input within a larger analytical framework, not as a standalone timing tool.
The CNN Fear & Greed Index earns its place among key market sentiment indicators due to its accessibility, comprehensive approach, and potential for identifying market turning points. While it's important to acknowledge its limitations and avoid using it in isolation, the index can provide valuable insights for investors of all levels. While there isn't a direct website link for the index itself, it's regularly featured on CNN Business and other financial news networks. It's often referenced by market commentators, particularly during periods of market volatility. For traders, analysts, and investors, this indicator offers a quick and intuitive way to assess the overall market sentiment and incorporate it into their decision-making process.
5. Commitment of Traders (COT) Report
The Commitment of Traders (COT) Report is a powerful market sentiment indicator providing a unique window into the positioning of different trader groups within the U.S. futures markets. This valuable resource, published weekly by the Commodity Futures Trading Commission (CFTC), allows professional traders, analysts, and investors to gauge overall market sentiment and identify potential turning points by analyzing the positions held by commercial hedgers, large speculators, and small retail traders. This makes it a crucial tool for anyone serious about understanding market dynamics and gaining an edge.
The COT report deserves its place on this list of market sentiment indicators because, unlike surveys or opinion-based metrics, it provides concrete data on actual market positioning. This information helps traders anticipate potential price moves and make more informed decisions.
How it Works:
The CFTC categorizes traders into three main groups:
- Commercial Traders (Hedgers): These are typically businesses involved in the underlying commodity or financial instrument. They use futures contracts to hedge against price fluctuations in their business operations. Their positions are often considered "smart money" due to their deep understanding of the market fundamentals.
- Non-Commercial Traders (Large Speculators): This group includes large institutional investors, hedge funds, and other managed money entities. They aim to profit from price movements and often take more speculative positions.
- Non-Reportable Traders (Small Retail Traders): This category represents smaller retail traders whose positions fall below the reporting threshold. Their collective positioning can offer insights into broader retail sentiment.
The report details the long, short, and spread positions held by each group across a wide range of futures markets including currencies, interest rates, equities, and commodities. It's available in both legacy and disaggregated formats, providing different levels of detail in trader classifications. The COT report is released every Friday at 3:30 PM ET, reflecting data as of the close of business the previous Tuesday. You can access the report directly from the CFTC website.
Examples of Successful Implementation:
- 2020 S&P 500 Recovery: In early 2020, commercial hedgers in S&P 500 futures held near-record net long positions just before the market rebounded sharply from the COVID-19 crash. This demonstrates the contrarian signal often provided by commercial hedgers at market extremes.
- 2016 Japanese Yen Reversal: Extreme net short positioning by large speculators in the Japanese yen correctly signaled the currency's reversal in 2016.
- 2016 Gold Rally: Commercial short positions in gold reaching multi-year extremes in late 2015 preceded a significant gold rally in 2016.
Pros:
- Based on Actual Positioning: Provides concrete data rather than subjective opinions.
- Multi-Asset Class Coverage: Offers insights across a wide range of markets.
- Contrarian Signals: Commercial hedger positions often indicate potential turning points.
- Free and Transparent: Publicly available government data with a consistent methodology.
- Long Historical Dataset: Allows for robust analysis and comparison across market cycles.
Cons:
- Data Lag: Published with a three-day delay.
- Complex Interpretation: Requires understanding of each market's typical positioning dynamics.
- Extended Extremes: Positions can remain extreme for extended periods without immediate market reactions.
- Classification Challenges: Trader classifications may not always perfectly reflect true positioning intent.
Actionable Tips:
- Focus on Commercial Hedgers: Pay close attention to their positioning, especially at extremes.
- Track Changes, Not Just Levels: Significant shifts in positioning are often more informative than absolute levels.
- Compare to Historical Extremes: Contextualize current positioning by comparing it to historical extremes specific to each market.
- Use with Other Indicators: Combine COT data with price action analysis, technical indicators, and fundamental analysis for a more comprehensive view.
- Consider Seasonality: Be mindful of seasonal patterns in positioning, particularly in commodity markets.
Popularized By:
The COT report is a product of the CFTC. However, its use as a market sentiment indicator has been popularized by individuals like Larry Williams, a renowned trader and educator, and Floyd Upperman, author of "Commitments of Traders." Their work has helped traders understand the value and application of this powerful tool.
6. Margin Debt Levels: A Window into Investor Conviction and Market Vulnerability
Margin debt levels, a potent market sentiment indicator, offer valuable insights into investor behavior and potential market vulnerabilities. This metric tracks the total amount of money borrowed by investors to purchase securities, using their existing investments as collateral. As such, it serves as a proxy for investor confidence, risk appetite, and the degree of leverage in the market. This makes it an essential tool for professional traders, stock market analysts, financial institutions, and independent investors alike.
How it Works as a Market Sentiment Indicator:
Rising margin debt typically signifies increasing investor optimism and a willingness to take on more risk. Investors borrow money because they believe the market will continue to climb, allowing them to amplify their returns. Conversely, falling margin debt suggests growing caution and a desire to deleverage, often preceding market downturns. Extreme readings in margin debt, particularly when viewed as a percentage of market capitalization or GDP, have historically coincided with major market tops and bottoms. This indicator, therefore, provides a crucial lens through which to assess overall market sentiment and potential instability.
Examples of Margin Debt as a Predictive Indicator:
Several historical instances highlight the predictive power of margin debt:
- 2021 Market Peak: Margin debt reached a record high of $935.9 billion in October 2021, just before the market began its decline in 2022. This peak signaled excessive optimism and leverage in the market.
- 2007-2008 Financial Crisis: Margin debt peaked in July 2007, shortly before the market topped and the subsequent financial crisis unfolded. This surge in borrowing foreshadowed the unsustainable levels of risk in the system.
- 2009 Market Bottom: Conversely, margin debt reached historic lows relative to market size in early 2009, coinciding with the market bottom during the financial crisis. This extreme low reflected widespread fear and capitulation, marking a potential turning point.
Features and Benefits:
- Reported Monthly by FINRA: For U.S. markets, the Financial Industry Regulatory Authority (FINRA) provides monthly data on margin debt. ([FINRA website link would go here if available])
- Measured in Absolute and Relative Terms: Margin debt is tracked both in absolute dollar terms and as a percentage of market capitalization or GDP, providing a more nuanced view of its significance.
- Reflects Actual Behavior: Unlike surveys or polls, margin debt represents real investor actions and risk-taking, making it a more reliable indicator of sentiment.
- Long Historical Dataset: The availability of a long historical dataset allows for meaningful comparisons across market cycles, aiding in identifying potential bubbles and crashes.
Pros:
- Based on Actual Behavior: Reflects real investor positioning and risk-taking.
- Long Historical Dataset: Enables comparisons across market cycles.
- Clear Relationship with Market Peaks: Extreme readings often coincide with market tops.
- Difficult to Manipulate: Represents actual borrowed money.
Cons:
- Monthly Reporting Frequency: Limits timely signals.
- Requires Adjustment for Inflation and Market Size: Raw numbers need context.
- Lagging Indicator: Trends can persist before market reactions.
- Regulatory Changes: Affect historical comparisons.
- Not a Precise Timing Tool: Extremes can become more extreme before reversing.
Actionable Tips for Using Margin Debt Levels:
- Look for Divergences: Identify discrepancies between margin debt trends and market performance. For example, if the market is rising while margin debt is falling, it could signal underlying weakness.
- Compare to Historical Peaks: Compare current margin debt levels to previous peaks as a percentage of market capitalization to assess potential overvaluation.
- Monitor Rate of Change: Pay attention to the rate of change in margin debt, rather than just absolute levels, as rapid increases can signal heightened risk.
- Use with Other Indicators: Combine margin debt analysis with other valuation and sentiment measures for a more comprehensive market assessment.
- Focus on Vulnerability, Not Timing: Consider margin debt as an indicator of market vulnerability rather than a precise market timing tool.
Popularized By:
- FINRA (Financial Industry Regulatory Authority)
- Doug Short (Advisor Perspectives)
- John Hussman (Hussman Funds)
Margin debt levels provide a valuable perspective on investor sentiment and market vulnerability. By understanding its dynamics and utilizing the tips provided, traders and investors can gain a significant edge in navigating the complexities of the financial markets.
7. Market Breadth Indicators (Advance-Decline Line)
Market breadth indicators, specifically the Advance-Decline Line (A-D Line), offer valuable insights into market sentiment by measuring the number of advancing stocks versus declining stocks over a period. This provides a more comprehensive view of market participation beyond the movement of major indices. The A-D Line is calculated by finding the difference between the number of advancing and declining issues each day and adding this difference to a cumulative running total. This cumulative nature allows traders and analysts to gauge the underlying strength or weakness of a market trend. A rising A-D Line suggests broad participation in an uptrend, while a falling A-D Line indicates weakening participation even if the market index is still rising, potentially foreshadowing a reversal.
This indicator deserves its place in the list of market sentiment indicators because it offers a robust, data-driven perspective on market internals, unlike sentiment surveys or opinion-based indicators. It distinguishes between broad-based market moves and those driven by a handful of large-cap stocks, providing a clearer picture of true market strength. One of the most powerful applications of the A-D Line lies in divergence analysis. Divergences between the A-D Line and major indices, like the S&P 500 or Nasdaq, can be potent warning signals of potential market reversals.
Features and Benefits:
- Broad Participation Tracking: The A-D Line tracks participation across the entire market or specific sectors, allowing for a granular view of market internals.
- Cumulative Measure: Its cumulative nature reveals underlying strength or weakness accumulating over time.
- Market Availability: It's available for various markets, including NYSE, Nasdaq, and sector-specific versions.
- Technical Analysis Applicability: You can apply moving averages and trend line analysis to the A-D Line for enhanced interpretation.
- Early Warning System: Divergences often signal market turns before price indices confirm them.
Pros:
- Data-Driven: Based on actual market data rather than subjective opinions.
- Broad Perspective: Identifies broad-based moves versus those driven by a few large stocks.
- Early Reversal Signals: Divergence analysis provides advance warning of potential reversals.
- Timely Updates: Daily updates enable timely responses to changing market conditions.
- Difficult to Manipulate: Incorporates data from thousands of stocks, making manipulation challenging.
Cons:
- Index Composition Changes: Can be influenced by changes in index composition over time.
- Conflicting Signals: Different markets (e.g., NYSE vs. Nasdaq) may show conflicting signals.
- Divergence Duration: Divergences can persist before price confirmation, requiring patience.
- Equal Weighting: Equal weighting of all stocks, regardless of market capitalization, can sometimes distort the overall picture.
- Interpretation Nuance: Requires an understanding of normal breadth behavior in different market phases.
Examples of Successful Implementation:
- Dot-com Bubble: In 1999-2000, the NYSE A-D Line peaked and declined while the S&P 500 continued higher, presaging the dot-com bubble burst.
- 2009 Market Bottom: A positive divergence emerged in March 2009, with the A-D Line improving before major indices bottomed, signaling a potential turnaround.
- 2022 Market Correction: Deteriorating breadth in late 2021, with fewer stocks participating in new highs, preceded the 2022 market correction.
Tips for Using the A-D Line:
- Focus on Divergences: Pay close attention to divergences between the A-D Line and major price indices.
- Compare Market Segments: Compare breadth across different market segments (e.g., small-cap vs. large-cap).
- Moving Averages: Use a 21-day moving average of the A-D Line to smooth out daily fluctuations.
- Confirmation of Highs/Lows: Look for confirmation or non-confirmation of new price highs/lows by the A-D Line.
- Sector-Specific Breadth: Consider sector-specific breadth for more targeted analysis.
Individuals ranging from professional traders and stock market analysts at financial institutions to independent investors, educators, and those using stock scanners and screeners for day trading can benefit from incorporating the A-D Line into their analysis. Learn more about Market Breadth Indicators (Advance-Decline Line) to enhance your understanding and application of this valuable market sentiment indicator. Pioneering figures like Joseph Granville, Richard Arms (creator of the Arms Index/TRIN), and technical analysts like Paul Desmond and Lowry Research have contributed significantly to the development and popularization of breadth indicators.
8. Bullish Percent Index (BPI)
The Bullish Percent Index (BPI) is a powerful market sentiment indicator that deserves a place in any serious trader's toolkit. It offers valuable insights into the internal strength or weakness of a market, going beyond simple price action to reveal the underlying breadth of bullish or bearish participation. This makes it particularly relevant for professional traders, stock market analysts, financial institutions, and independent investors looking to gain an edge. Stock scanners and screeners can also integrate BPI data for identifying potential trading opportunities.
Essentially, the BPI measures the percentage of stocks within a given index, sector, or industry group that are currently displaying Point and Figure buy signals. Point and Figure charting, developed by Abe Cohen, filters out market "noise" by focusing on significant price movements and ignoring minor fluctuations. This allows the BPI to offer a clearer picture of the dominant trend. Tom Dorsey of Dorsey, Wright & Associates further expanded and popularized BPI analysis, solidifying its place among key market sentiment indicators. Renowned technical analyst John Murphy has also featured the BPI in his market analysis.
How it Works:
The BPI oscillates between 0% and 100%. A reading of 0% represents extreme bearishness, indicating that all stocks within the measured group are on Point and Figure sell signals. Conversely, a reading of 100% signifies extreme bullishness, with all stocks exhibiting buy signals. More commonly, the BPI fluctuates within this range, providing dynamic insight into market sentiment. Readings above 70% are generally considered overbought, while readings below 30% are considered oversold.
Features and Benefits:
- Based on Point and Figure Charting: This filters out insignificant price movements, providing a clearer view of underlying trends.
- Broad Applicability: Available for major indices (like the NYSE and S&P 500), sectors (like Technology or Healthcare), and even specific industry groups.
- Clear Overbought/Oversold Levels: The 0-100% scale with 30% and 70% as key reference points offers clear signals for potential trend reversals.
- Internal Market Strength Analysis: Reveals the breadth of participation in a market move, regardless of how a price-weighted index might be performing.
- Versatile Application: Can be used for both tactical (short-term) and strategic (long-term) market analysis.
- Sector Rotation: Comparing BPI readings across different sectors can highlight potential rotation opportunities, allowing investors to shift capital to areas of relative strength.
Pros:
- Filters out market noise.
- Provides clear overbought/oversold levels.
- Shows internal market strength regardless of index performance.
- Effective for both tactical and strategic analysis.
- Useful for sector rotation analysis.
Cons:
- Requires an understanding of Point and Figure charting.
- Can remain at extreme levels during strong trends.
- Can be less accessible than simpler indicators.
- May generate whipsaws in choppy markets.
- Calculation variations exist across different data providers.
Examples of Successful Implementation:
- March 2020: The NYSE Bullish Percent Index fell below 20%, signaling an extremely oversold market just before the sharp recovery.
- Late 2021: The Technology sector BPI reached above 80% before a significant sector correction, highlighting the overbought condition.
- 2015-2016: Divergences between the S&P 500 BPI and actual price action correctly identified a market bottom, providing an early signal for the subsequent rally.
Actionable Tips:
- Key Levels: Use 30% and 70% as your primary overbought/oversold reference points.
- Reversal Signals: Look for reversals from extreme BPI readings as potential entry or exit signals.
- Sector Rotation: Compare BPI readings across various sectors to identify rotation opportunities.
- Rate of Change: Analyze the rate at which the BPI is changing, as rapid shifts can signal accelerating trends.
- Divergences: Pay close attention to divergences between the BPI and price action, as these can foreshadow potential trend changes.
By incorporating the Bullish Percent Index into your market analysis, you can gain a more nuanced understanding of sentiment and potentially improve your trading decisions. Its ability to reveal the internal strength or weakness of a market makes it an invaluable tool for navigating the complexities of the financial markets.
Market Sentiment Indicators Comparison
| Indicator | Implementation Complexity 🔄 | Resource Requirements ⚡ | Expected Outcomes 📊 | Ideal Use Cases 💡 | Key Advantages ⭐ |
|---|---|---|---|---|---|
| CBOE Volatility Index (VIX) | High: Complex calculation, option pricing data | Moderate: Requires options market data and futures markets | Quantifies 30-day expected volatility; contrarian signals | Hedging timing, market fear gauging, volatility trading | Strong contrarian signal; widely used; tradable directly |
| Put/Call Ratio | Low: Simple ratio calculation | Low: Options volume/open interest data | Identifies market sentiment extremes; contrarian signals | Short-term sentiment shifts; options positioning analysis | Direct measure of options positioning; easy to interpret |
| AAII Sentiment Survey | Low: Weekly online survey | Low: Polling infrastructure and data collection | Retail investor sentiment extremes; contrarian indicator | Long-term sentiment trends; retail psychology analysis | Simple, free, with long historical data |
| CNN Fear & Greed Index | Moderate: Composite index with 7 factors | Moderate: Multiple market data inputs | Visual sentiment gauge from fear to greed; contrarian sign | Quick market emotion snapshots; broad market sentiment overview | Combines multiple sentiment factors; intuitive display |
| Commitment of Traders (COT) Report | High: Complex data aggregation and categorization | Moderate: Futures market position data (weekly) | Reveals trader positioning extremes; contrarian signals | Multi-asset futures positioning; institutional sentiment | Based on actual market positions; broad market coverage |
| Margin Debt Levels | Moderate: Data aggregation and adjustment | Low: Monthly reports from FINRA | Indicates investor leverage extremes; signals vulnerability | Long-term risk appetite and market tops/bottoms | Based on real borrowed money; difficult to manipulate |
| Market Breadth Indicators (Advance-Decline Line) | Moderate: Requires cumulative calculation and market-wide stock data | Moderate: Daily price data for many stocks | Signals underlying market strength/weakness; early reversal warning | Confirming price trends; breadth analysis across markets | Based on actual market internals; timely daily data |
| Bullish Percent Index (BPI) | Moderate: Point and Figure charting methodology | Low to Moderate: Price data for index stocks | Measures percentage of stocks on buy signals; overbought/oversold zones | Sector rotation; tactical market strength analysis | Filters noise; clear overbought/oversold levels; useful for sector analysis |
Putting Sentiment to Work
Mastering market sentiment indicators like the VIX, Put/Call Ratio, AAII Sentiment Survey, CNN Fear & Greed Index, COT Report, Margin Debt Levels, Advance-Decline Line, and Bullish Percent Index can significantly enhance your trading strategy. These indicators provide a crucial glimpse into the collective psychology of the market, allowing you to gauge fear, greed, and overall market confidence. Understanding these emotional drivers can be as important as analyzing fundamental or technical factors when making investment decisions. This understanding allows you to anticipate potential market turns, refine your risk management strategies, and identify opportune entry and exit points, ultimately increasing your probability of success. In fact, understanding customer behavior and sentiment is vital across many industries. For further insights into the impact of customer-centric approaches and their correlation with business growth, exploring relevant data can be invaluable. Check out these customer success statistics for more information. By integrating these market sentiment indicators into your analysis, you gain a valuable edge, enabling you to make more informed and potentially more profitable trading decisions.
Remember, while powerful, market sentiment indicators are most effective when used in conjunction with other forms of analysis. No single indicator provides a complete picture, but by combining sentiment analysis with your existing toolkit, you can develop a more comprehensive market perspective. Ready to harness the power of market sentiment? Explore the potential of these indicators and elevate your trading with ChartsWatcher, a platform designed to seamlessly integrate these key market sentiment indicators into your analysis and decision-making process.
