Top Market Sentiment Indicators for Smart Investing
Unlocking Market Sentiment
In the world of finance, understanding market sentiment is key. Market sentiment refers to the overall attitude of investors toward a particular asset or the entire market. It's a powerful tool for interpreting current market conditions and anticipating future trends. History demonstrates the impact of investor psychology, from the 17th-century tulip mania to the dot-com bubble of the late 90s. While predicting the future with certainty is impossible, understanding market sentiment can give investors valuable insights.
Analyzing market sentiment effectively relies on identifying trustworthy indicators. These indicators can come from various sources, such as option pricing, investor surveys, trading volumes, and insider activity. They provide a way to measure fear, greed, and overall confidence in the market. Understanding the history and theory behind these tools allows investors to see their strengths and weaknesses. This knowledge leads to better decisions, potentially reducing risk and improving returns.
Key Market Sentiment Indicators
This article explores several important market sentiment indicators and how to use them in your investment strategy. We'll cover established metrics like volatility indexes and put/call ratios, as well as broader measures of investor confidence and market breadth. You'll learn how to interpret the signals of market sentiment and use these insights to your advantage in the financial world.
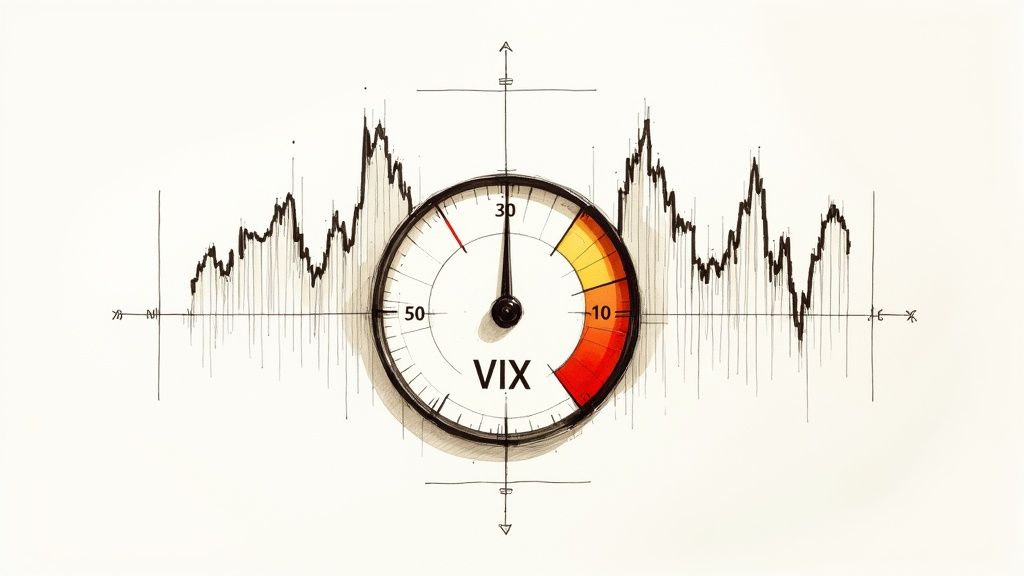
- Volatility Indexes: The VIX is a popular example. It measures expected market volatility and is often referred to as the "fear gauge."
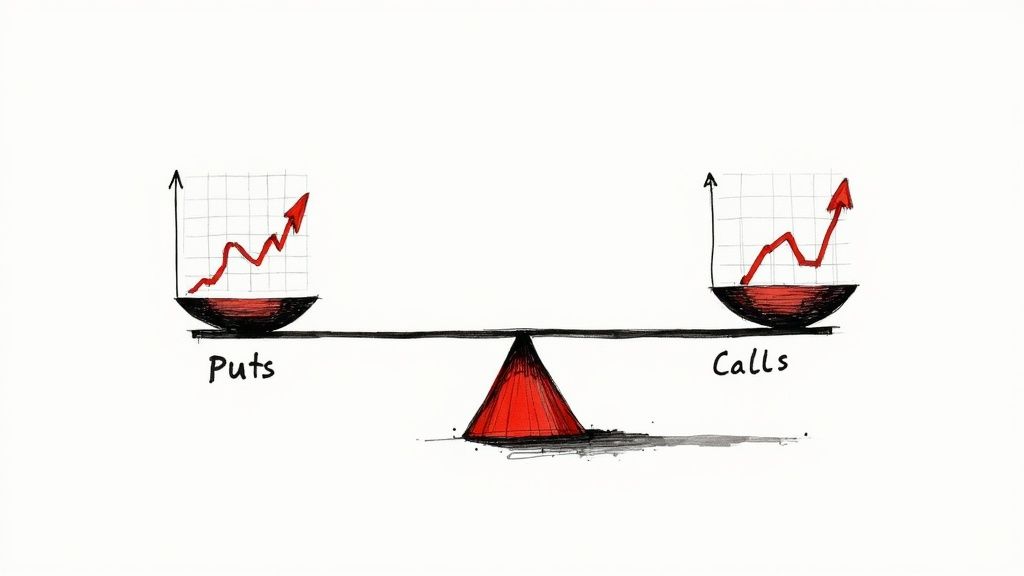
- Put/Call Ratios: This indicator compares the volume of put options (bets that a stock will go down) to call options (bets that a stock will go up).
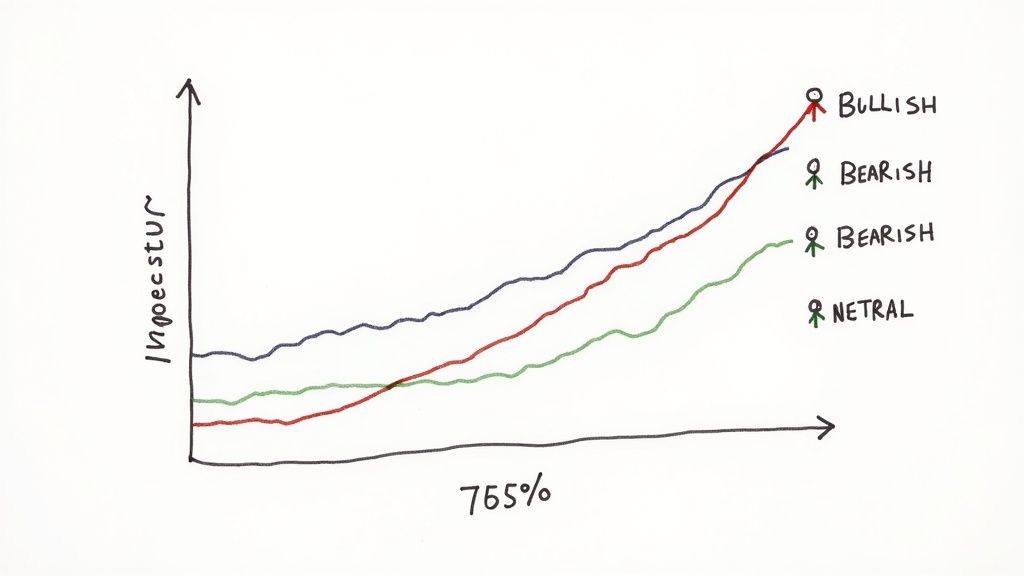
- Investor Surveys: These surveys ask investors about their outlook on the market. The AAII Sentiment Survey is a widely followed example.
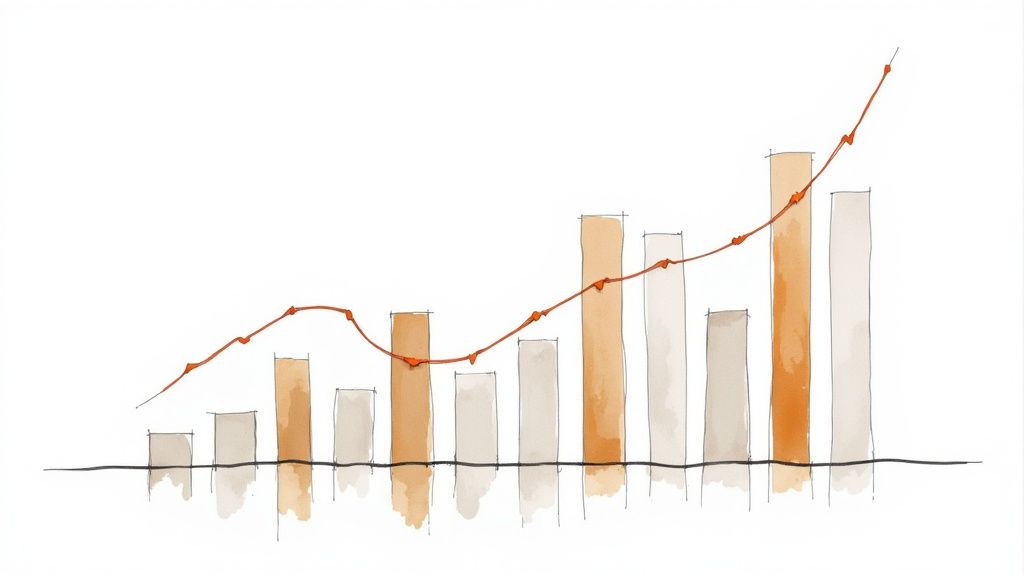
- Market Breadth: This refers to the number of stocks advancing versus declining. It can indicate overall market strength or weakness.
By studying these indicators, you can develop a deeper understanding of market dynamics and improve your ability to navigate the complexities of today’s markets.
1. VIX (CBOE Volatility Index)
The VIX, often called the "fear gauge" or "fear index," measures the expected volatility of the S&P 500 index over the next 30 days. Derived from S&P 500 index options prices, it offers valuable insights into investor expectations regarding future market movements. Its importance in finance makes it a crucial tool for professional traders, analysts, and individual investors.
Understanding the VIX
The VIX doesn't measure the S&P 500's actual volatility, but rather its implied volatility – the market's prediction of future price swings. A complex formula considers the weighted prices of put and call options at various strike prices to calculate the VIX. This value is expressed on a scale of 0 to 100.
Higher VIX values indicate higher expected volatility and usually increased market fear or uncertainty. Lower values, conversely, suggest calmer market conditions.
Features and Benefits
- Forward-looking: The VIX provides a 30-day outlook on expected market volatility.
- Real-time Updates: The index is constantly updated during trading hours, showing dynamic sentiment shifts.
- Numerical Representation: It offers a clear, quantifiable measure of market fear and complacency.
- Hedging Tool: The VIX's strong negative correlation with the S&P 500 lets investors hedge against market downturns.
- Tradability: VIX futures, options, and Exchange Traded Products (ETPs) allow direct trading based on volatility outlooks.
- Accessibility: The VIX is easily accessible via financial news, trading platforms like TradingView, and the CBOE website.
Pros and Cons
Pros:
- Clear, numerical representation of market sentiment.
- Strong negative correlation with the S&P 500, making it a useful hedge.
- Easily accessible information.
- Directly tradable through various instruments.
Cons:
- Complex calculation methodology.
- Potential for false signals.
- Narrow focus on S&P 500 options.
- Susceptibility to technical spikes.
Real-World Examples
- 2008 Financial Crisis: The VIX hit 89.53 on October 24, 2008, reflecting extreme market fear.
- COVID-19 Pandemic (March 2020): The VIX spiked to 82.69 mirroring the panic and volatility.
- Calm Bull Market (2017): The VIX stayed historically low, often below 10, indicating complacency.
Practical Tips for Implementation
- High Anxiety: VIX values above 30 generally signal high anxiety.
- Complacency: Readings below 20 typically suggest complacency.
- Divergences: Monitor divergences between VIX and S&P 500 price action, which can signal trend reversals.
- Broader Analysis: Use the VIX with other technical and fundamental indicators.
Evolution and Popularization
Created by Robert Whaley for the CBOE in 1993, the VIX initially measured the implied volatility of at-the-money S&P 100 index options. It was later refined to track the S&P 500, and its calculation was improved. The VIX gained popularity through CBOE's marketing and mentions by financial commentators like Jim Cramer of CNBC, solidifying its status as a key market sentiment indicator. The VIX is valuable because it quantifies market fear and uncertainty, offering actionable insights.
2. Put/Call Ratio
The Put/Call Ratio is a valuable tool for understanding market sentiment. It's a contrarian indicator, meaning it can help traders identify potential turning points in the market. By examining the volume or open interest of put options compared to call options, this ratio offers insights into the overall bearishness or bullishness of the market. Essentially, it measures whether traders are leaning towards a decline (buying puts) or an advance (buying calls).
How It Works
The Put/Call Ratio is typically calculated by dividing the volume of put options traded by the volume of call options traded. A ratio greater than 1 suggests more put buying activity than call buying, pointing to bearish sentiment. Conversely, a ratio below 1 indicates bullish sentiment, as call buying dominates.
Key Features and Benefits
-
Direct Insight into Trader Behavior: The Put/Call Ratio reflects actual trading activity, offering a more objective market sentiment view than surveys or news sentiment analysis.
-
Contrarian Signal: Extreme readings can often signal potential market reversals. A very high ratio might suggest an overly bearish market poised for a rebound, while a very low ratio could indicate an overbought market vulnerable to a correction.
-
Market Segmentation: This ratio allows for targeted analysis by examining specific indexes (like the S&P 500), individual stocks, or the entire options market. Equity-only and index-only versions also exist for more refined insights.
-
Historical Data: Traders can use readily available historical data to establish benchmarks and identify recurring patterns.
-
Frequent Updates: Data is updated daily and often intraday, providing real-time sentiment readings.
Pros and Cons
Here's a quick breakdown of the advantages and disadvantages:
| Pros | Cons |
|---|---|
| Direct insight into trader actions | Can be influenced by institutional hedging |
| Contrarian indicator for reversals | Multiple versions can give conflicting signals |
| Segmented analysis (equity vs. index) | Needs context and historical comparison for interpretation |
| Readily available historical data | Doesn't factor in option strikes or expiration dates |
Real-World Examples
-
March 2020 Market Crash: The CBOE equity put/call ratio surged to 1.28, a significantly bearish reading that coincided with the market bottom. This highlighted widespread fear and, retrospectively, signaled a potential buying opportunity.
-
2020-2021 Bull Market: During the following bull market, the equity put/call ratio frequently fell below 0.5, indicating extreme bullish sentiment. This arguably served as a contrarian bearish signal, foreshadowing market consolidation or correction periods.
Practical Tips for Implementation
-
Focus on Extremes: Pay close attention to extreme readings (above 1.0 or below 0.5 for the equity put/call ratio) as potential contrarian signals.
-
Moving Averages: Compare current readings to 10-day, 20-day, and 50-day moving averages to spot trends and smooth out short-term fluctuations.
-
Equity-Only Ratio: The equity-only put/call ratio can often provide clearer signals than the total market ratio.
-
Confirmation: Use the Put/Call Ratio alongside other sentiment indicators, such as the VIX or investor surveys, for added confirmation.
Popularized By
The CBOE publishes daily put/call data, making this indicator widely accessible. Options expert Larry McMillan, author of Options as a Strategic Investment, and SentimenTrader, a research service known for its work with put/call ratios, have also greatly contributed to its widespread use.
By understanding the Put/Call Ratio and using it effectively, traders can gain valuable insights into market sentiment and identify potential shifts in market direction.
3. AAII Investor Sentiment Survey
The AAII Investor Sentiment Survey is a valuable tool for understanding how individual investors feel about the stock market. The American Association of Individual Investors (AAII) polls its members every week. This provides insights into the percentage of investors who are bullish, bearish, or neutral on the market's direction over the next six months. This can be particularly useful as a contrarian indicator. Extreme optimism can sometimes signal market tops, while extreme pessimism can precede market bottoms.
Since its beginning in 1987, the survey has become a key resource for market analysts and individual investors. It gives a long-term perspective on investor sentiment. Its simple methodology, asking investors directly about their outlook, provides a clear measure of market psychology. The survey's consistent weekly release every Thursday allows for tracking changes in sentiment over time, building valuable historical context. You can access the data through the AAII website with a membership.
Features and Benefits
- Weekly Frequency: Provides regular snapshots of investor sentiment.
- Three Sentiment Categories: Offers a nuanced view of investor outlook.
- Historical Data: Allows for comparison with past market conditions.
- Direct Polling: Captures authentic investor perspectives.
Pros
- Direct Measure of Retail Sentiment: Offers a pure view of individual investor sentiment.
- Long History: Provides a substantial data set for analysis.
- Regular Updates: Keeps you informed of evolving market sentiment.
- Publicly Available (with membership): Data is readily accessible to members.
Cons
- Sample Bias: AAII members may not represent all individual investors.
- Survey Limitations: Self-reported data may have inherent biases.
- Potential Lag: May not fully capture rapid sentiment shifts.
- Intentions vs. Actions: Reported intentions might not align with actual trading activity.
Real-World Examples
- March 2009: Bearish sentiment hit 70.3% at the market bottom during the financial crisis.
- January 2000: Bullish sentiment soared above 75% during the dot-com bubble's peak.
- November 2016: Bullish sentiment jumped from 23.6% to 46.7% after the US presidential election.
Tips for Implementation
- Contrarian Signals: High bullish readings could be bearish, and low readings could be bullish.
- Bull-Bear Spread: The difference between bullish and bearish percentages provides a concise overview.
- Moving Averages: 8-week moving averages can smooth out short-term fluctuations.
- Long-Term Perspective: The survey is most useful for medium- to long-term analysis.
Popularity and Influence
Founded by James Cloonan, the AAII and its sentiment survey gained recognition through the work of Charles Rotblut, VP at AAII and editor of the AAII Journal. The survey is widely used and often cited by financial news outlets like CNBC, Bloomberg, and the Wall Street Journal. Its focus on individual investors makes it a powerful tool for understanding market sentiment. This survey offers a direct look into the minds of individual investors, serving as a potent contrarian indicator with a rich history.
4. CNN Fear & Greed Index
The CNN Fear & Greed Index offers a valuable glimpse into the overall market sentiment. It provides a snapshot of whether investors are generally feeling bullish or bearish. The index combines seven different market factors into a single score, ranging from 0 ("Extreme Fear") to 100 ("Extreme Greed"). Created by CNN Business, the index is based on the principle of contrarian investing: extreme fear can often indicate a buying opportunity, while excessive greed may suggest a market correction is coming.
This index earns its place on our list because of its comprehensive approach and user-friendly presentation. It incorporates several key factors:
- Stock price momentum
- Strength
- Breadth
- Put/call ratios
- Junk bond demand
- Market volatility
- Safe haven demand
These factors offer a broad perspective on market sentiment. The straightforward 0-100 scale, combined with clear labels like "Fear," "Neutral," and "Greed," makes the index easy to understand, even for those new to investing. Daily updates show the current reading, previous close, and the reading from a week ago, allowing investors to track shifts in sentiment almost immediately. A visual gauge makes it even more accessible.
Real-World Examples of the Index in Action
Several real-world examples highlight the index's potential usefulness. During the March 2020 COVID-19 market crash, the index plunged to 2 ("Extreme Fear"), coinciding with a significant market bottom. Conversely, in January 2022, as the market peaked before a correction, the index registered readings above 70 ("Greed"). During the relatively calm bull market of 2017, the index consistently pointed to "Greed" and "Extreme Greed."
Limitations of the CNN Fear & Greed Index
While the index offers many advantages, it's important to be aware of its limitations. The proprietary methodology lacks transparency, making it hard to know the exact weighting of each factor. The simplified presentation, while great for accessibility, might oversimplify the complex dynamics of the market. Finally, as a newer indicator (launched in 2012), it has less historical context compared to more established sentiment indicators. Its weighting might be subject to recency bias. For other helpful tools, you might find value in our guide on top overbought and oversold indicators.
Tips for Using the CNN Fear & Greed Index
To make the most of the CNN Fear & Greed Index, consider the following tips:
- Use extreme readings (below 20 or above 80) as potential contrarian signals.
- Monitor how quickly the index moves between categories to gauge accelerating sentiment.
- Compare the current reading with 50-day and 200-day averages to find unusual sentiment conditions.
- Examine the individual components for additional confirmation of the overall reading.
Popularized by CNN Business and widely cited by financial media and social media commentators, the CNN Fear & Greed Index has become a key resource for evaluating market sentiment. While it's not a perfect predictor, it's a useful tool for understanding the prevailing emotions influencing market behavior.
5. Commitment of Traders (COT) Report
The Commitment of Traders (COT) Report, published weekly by the U.S. Commodity Futures Trading Commission (CFTC), provides valuable insights into the positions held by various trader groups in U.S. futures markets. It's a powerful tool for professional traders, analysts, and institutions seeking to understand market sentiment and anticipate potential market turning points. Unlike sentiment indicators based on surveys or opinions, the COT report offers a unique look at actual market positioning. Access the report directly from the CFTC website.
The report categorizes traders into three main groups:
-
Commercial Traders ("Smart Money"): These are typically businesses involved in the underlying commodity or financial instrument. They use futures contracts primarily for hedging, protecting themselves against price fluctuations. Their positions are often considered insightful due to their deep market knowledge.
-
Non-Commercial Traders (Large Speculators): This group includes hedge funds, managed money, and other large speculative players. They aim to profit from price movements, often taking substantial directional bets.
-
Non-Reportable Traders (Small Speculators): This category includes smaller traders whose positions fall below CFTC reporting thresholds.
Features and Benefits
-
Published Weekly: The report is released every Friday at 3:30 PM Eastern Time, reflecting positions as of the previous Tuesday.
-
Broad Market Coverage: The report covers major futures markets, including commodities (e.g., crude oil, gold), currencies, interest rates, and stock indices.
-
Detailed Positioning Data: It provides long and short positions for each trader category, enabling analysis of net positioning and changes over time.
-
Historical Data: A long history of COT data is available, allowing for the development of statistical norms, identifying extreme readings, and backtesting trading strategies.
-
Free and Publicly Available: The data is readily accessible from the CFTC website.
Pros
-
Based on Actual Positions: The report offers a more objective view of market sentiment than surveys or opinions.
-
Reveals Institutional Sentiment: It provides insight into the positioning of large players, particularly the "smart money" commercial hedgers.
-
Historical Context: The available historical data allows for identifying patterns and extremes.
Cons
-
Reporting Lag: The three-day delay between data collection and publication can be a disadvantage in rapidly changing markets.
-
Data Complexity: Analyzing and interpreting the data to extract meaningful signals requires effort.
-
Category Ambiguity: Trader classifications are not always perfectly clear. For instance, swap dealers can sometimes act as both hedgers and speculators.
-
Limited Equity Market Application: The report is more directly applicable to futures markets than equities.
Real-World Examples
-
2008 Oil Price Collapse: The COT report showed commercial hedgers holding large short positions in crude oil futures while speculators were record long, foreshadowing the subsequent price drop.
-
2022 Bond Rally: In late 2021, commercial hedgers established significant long positions in Treasury futures, preceding the 2022 bond market rally.
-
Currency Turning Points: Extreme readings in commercial forex positions often coincide with major turning points during significant currency trends.
Tips for Implementation
-
Focus on Net Positioning: Analyze the net difference between long and short contracts held by commercial hedgers.
-
Look for Divergences: Identify significant divergences in positioning between commercial hedgers and large speculators.
-
Use the COT Index: Normalize positions on a scale of 0-100% relative to three-year extremes to identify historically significant readings.
-
Combine with Price Action: Commercial hedgers often establish contrary positions early. Combining COT data with price action analysis can improve signal accuracy.
Popularized By
The analytical power of the COT report has been championed by individuals like Larry Williams, a renowned trader and author who popularized COT analysis techniques, and Floyd Upperman, developer of COT data tools and author of Commitments of Traders. Their work has helped traders understand and utilize this valuable market sentiment indicator effectively.
6. Margin Debt Levels
Margin debt, the borrowed money investors use to buy securities, provides valuable insight into market sentiment and potential vulnerabilities. Unlike surveys or opinions, it represents actual financial commitments, making it a key indicator for professional traders, analysts, and individual investors. Tracked monthly by FINRA (Financial Industry Regulatory Authority), margin debt levels offer a quantifiable measure of investor confidence, speculative activity, and market leverage.
Why Margin Debt Matters
High and rapidly increasing margin debt often precedes market peaks. It suggests excessive optimism and the potential for a sharp downturn if the market reverses. Conversely, substantial decreases can indicate forced selling and capitulation, potentially signaling a market bottom. This indicator's value lies in its tangible measurement of risk-taking.
Features and Benefits
- Reported by FINRA: Data is reliable and publicly accessible, albeit with a one-month delay.
- Represents Actual Borrowed Money: Margin debt reflects real financial stakes, not just sentiment.
- Versatile Analysis: It can be analyzed in absolute terms, relative to GDP, or market capitalization for comprehensive insights.
- Historical Significance: Extensive data allows comparisons across market cycles, revealing patterns and potential turning points.
- Insight into Forced Selling: Helps anticipate potential selling pressure as investors deleverage during downturns.
Pros and Cons
Analyzing margin debt offers both advantages and disadvantages. Understanding these nuances is crucial for accurate interpretation.
Pros:
- Objective Measure: Based on real transactions, providing an unbiased view.
- Directly Measures Risk: Clearly shows investor leverage and risk appetite.
- Historical Context: Long-term data enables valuable comparisons across cycles.
- Predictive Potential: Historically peaks before major market corrections.
Cons:
- Lagging Indicator: Monthly reporting limits its use for short-term signals.
- Requires Context: Raw data needs interpretation alongside economic and market size.
- Long-Term Comparisons Challenging: Regulatory and market structure changes can complicate long-term comparisons.
- Not a Precise Timing Tool: High margin debt can persist before a market turn.
Real-World Examples
Several historical events highlight the significance of margin debt as a market indicator:
- Dot-com Bubble: Margin debt peaked before the 2000 crash.
- Financial Crisis: A similar pattern occurred before the 2007-2008 crisis.
- Recent Market Correction: Margin debt reached record highs of over $910 billion in 2021, preceding the 2022 correction.
- COVID-19 Crash: Rapid declines in margin debt during the 2020 crash highlighted forced deleveraging.
Tips for Implementation
Using margin debt effectively requires careful analysis and context:
- Track Rate of Change: Compare current levels to the 12-month rate of change for trend identification.
- Relative Context: Calculate margin debt as a percentage of market capitalization for perspective.
- Divergence Warnings: Watch for divergences between market prices and margin debt.
- Confirmation Tool: Use margin debt with other indicators to confirm market sentiment.
Popularized By
The importance of margin debt has been emphasized by various entities and individuals, including FINRA, the NYSE (historically), Doug Short (Advisor Perspectives), and John Hussman. Their work has brought this metric into mainstream market analysis.
7. Market Breadth Indicators
Market breadth indicators provide valuable insights into the overall market's health by analyzing individual stock participation in broader trends. Rather than solely focusing on major index movements like the S&P 500, these indicators delve deeper. They examine metrics such as advancing versus declining stocks, new highs versus new lows, and the percentage of stocks trading above key moving averages. This helps investors understand if a market move has broad support or is driven by a select few securities, crucial for assessing trend strength and anticipating potential shifts.
Several market breadth indicators offer unique perspectives:
- Advance-Decline Line: This tracks the cumulative difference between advancing and declining stocks, providing a long-term view of market participation.
- McClellan Oscillator: Derived from the Advance-Decline Line, this shorter-term indicator helps identify overbought and oversold market conditions.
- New Highs-New Lows: This indicator measures the difference between stocks hitting new 52-week highs and lows, revealing shifts in market momentum.
- Percentage of Stocks Above Moving Averages: This shows the proportion of stocks trading above specific moving averages (like the 20-day, 50-day, or 200-day), indicating overall market strength or weakness.
These indicators, updated daily with real-time market data, can be applied to various indices and exchanges. They are usually presented as line charts or oscillators for easy visual analysis.
Benefits of Using Market Breadth Indicators
- Reveal Internal Market Health: Breadth indicators offer a more detailed view of market strength than major price indexes alone.
- Identify Divergences: They can spot instances where index movements lack broad market confirmation, signaling potential trend reversals.
- Early Warning Signals: These indicators can provide early warnings of potential market tops and bottoms.
- Based on Actual Market Action: They are derived from real market activity, not opinions or surveys.
Potential Drawbacks of Market Breadth Indicators
- Conflicting Signals: Different breadth indicators may occasionally provide conflicting signals, requiring careful interpretation.
- Index Composition Changes: Changes in market index composition over time can affect some breadth measures.
- Large-Cap Dominance: Their effectiveness might decrease in markets dominated by a few large-cap stocks.
- Technical Knowledge Required: Understanding these indicators requires some technical analysis knowledge.
Real-World Examples of Market Breadth Indicators in Action
- Dot-com Bubble (1999-2000): As the S&P 500 rose, the NYSE Advance-Decline Line fell, signaling a narrowing rally and foreshadowing the dot-com crash.
- Market Bottom (March 2009): The percentage of NYSE stocks above their 50-day moving average surged, confirming a new bull market.
- Market Correction (2022): Even with major indexes hitting new highs in 2021, fewer stocks made new 52-week highs, foreshadowing the 2022 correction.
Practical Tips for Using Market Breadth Indicators
- Watch for divergences between price indexes and breadth indicators as potential warnings.
- Use multiple timeframes (such as the percentage of stocks above the 20-day, 50-day, and 200-day moving averages) for a more complete analysis.
- Consider using sector-specific breadth indicators for more focused insights.
- The NYSE Advance-Decline Line is a particularly useful tool for assessing broad market participation.
You might be interested in: Our guide on Technical Analysis Indicators for a broader understanding of technical indicators.
Influential figures like Sherman and Marian McClellan (McClellan Oscillator and Summation Index), Joseph Granville (on-balance volume and breadth analysis), and Gerald Appel (MACD) popularized market breadth indicators. Their widespread availability on platforms like StockCharts.com has further solidified their importance in modern technical analysis. They offer a deeper understanding of market internals beyond just price action, making them an essential tool for any serious trader or investor.
8. Insider Trading Activity
Insider trading activity, often misunderstood, refers to the legally mandated reporting of stock transactions by corporate insiders. These insiders—executives, directors, and major shareholders—possess unique insights into a company's performance. Tracking their buying and selling of company stock provides a powerful market sentiment indicator. Why is this important? Aggregated across the market, insider activity can offer a glimpse into the collective wisdom of those "in the know," potentially foreshadowing broader market movements.
How It Works
Insider transactions are reported to the SEC through Form 4 filings, usually within two business days. These filings differentiate between open market transactions (direct stock purchases or sales) and other transactions like option exercises or pre-planned sales. Open market transactions are generally considered more informative. Data can be analyzed at the individual company level, by sector, or market-wide. This data is often presented as a ratio of insider buying to selling or in terms of dollar volumes traded.
Features and Benefits
- Superior Information: Insider actions are based on privileged access to company financials, operations, and strategic plans.
- Contrarian Indicator: Insider activity can be particularly insightful during market extremes. Heavy buying during pessimistic periods might signal undervaluation. Conversely, widespread selling during euphoric times could suggest overvaluation.
- Objective Data: Unlike surveys or opinions, insider trading data represents concrete actions backed by legal reporting.
- Multi-Level Application: This data is effective for company-specific analysis (identifying potentially mispriced stocks) and broad market analysis (gauging overall sentiment).
Pros and Cons
Pros:
- Based on the actions of those with superior information.
- Valuable contrarian indicator.
- Legally reported data, enhancing reliability.
- Effective for both company-specific and market-wide analysis.
Cons:
- Insiders may transact for non-market reasons (e.g., diversification or tax planning).
- Some transactions (like pre-planned sales) have less predictive value.
- Timing can be early, preceding market turns by months.
- Regulatory changes can affect the interpretation of historical patterns.
Real-World Examples
- 2008/2009: Insider buying surged before the market bottom.
- 2021: High insider selling preceded the 2022 market correction.
- March 2020: During the COVID-19 crash, insiders made significant purchases weeks before the recovery began.
Tips for Implementation
- Focus on Open Market Transactions: Prioritize open market buys and sells.
- Cluster Buying: Multiple insiders buying within the same company is a stronger signal.
- Key Players: Pay attention to CFO and CEO transactions.
- Buy/Sell Ratio: Use this ratio to identify deviations from typical patterns.
Popularized By
The SEC mandates and publishes insider trading filings. Investors like Peter Lynch popularized using insider buying as an investment signal. Academic research, such as that by Nejat Seyhun, author of Investment Intelligence from Insider Trading, has further validated its use. Services like InsiderScore, Thomson Reuters, and Washington Service aggregate and analyze insider data.
By analyzing insider trading activity, traders and investors can gain valuable insights into market sentiment and identify potential opportunities. While not foolproof, it offers a powerful lens through which to view the collective wisdom of those closest to the action.
8-Point Market Sentiment Comparison
| Indicator | 🔄 Complexity | 💡 Resources | 📊 Outcomes | ⭐ Use Cases | ⚡ Advantages |
|---|---|---|---|---|---|
| VIX (CBOE Volatility Index) | High – Complex calculation process | Real-time options and market data | Numerical gauge of market fear and volatility | Hedging and contrarian analysis during volatile periods | Widely accessible, tradable via futures/options |
| Put/Call Ratio | Moderate – Simple formula with context | Daily options volume data available from major platforms | Measures trader sentiment through put/call activity | Detecting extreme sentiment and potential market reversals | Direct insight into actual trading behavior |
| AAII Investor Sentiment Survey | Low – Straightforward survey method | Survey data from individual investors | Reflects bullish, bearish, and neutral investor moods | Contrarian signals in medium to long-term market analysis | Long historical record and clear retail investor sentiment |
| CNN Fear & Greed Index | Low – Composite metric with simple scale | Aggregated daily market factors from diverse indicators | Quick snapshot of overall market sentiment | Rapid sentiment assessment for retail investors | Easy-to-interpret visual gauge |
| Commitment of Traders (COT) Report | High – Detailed analysis required | Public CFTC data with multiple trader categories | Reveals institutional positioning and smart money moves | In-depth analysis of market turning points | Based on actual trader positions with long-term historical context |
| Margin Debt Levels | Moderate – Straightforward yet context-driven | Monthly FINRA reports on borrowing amounts | Indicates market leverage and rising risk levels | Detecting unsustainable borrowing and potential forced selling | Objective measure of investor borrowing behavior |
| Market Breadth Indicators | Moderate – Multiple measures to evaluate | Daily market data covering broad participation and technical indicators | Shows overall market participation and divergence | Confirming trends and early detection of market reversals | Holistic view of market health beyond price indexes |
| Insider Trading Activity | Moderate – Analysis of SEC filings needed | Timely, legally reported insider transactions | Reflects sentiment from corporate insiders | Company-specific sentiment analysis and contrarian signals | Based on actions of informed insiders offering unique insights |
Putting Sentiment To Work
Market sentiment indicators offer a crucial look into the psychological factors driving market trends. From the VIX (Volatility Index) to insider trading activity, these tools help decipher the emotions of fear, greed, and uncertainty among investors. Remember, these indicators aren't perfect predictors, but valuable pieces of the puzzle.
By understanding the current sentiment landscape alongside fundamental and technical analysis, you gain a more comprehensive market perspective, ultimately leading to better trading decisions.
Utilizing sentiment indicators effectively requires a multifaceted approach. Here are some key considerations:
-
Combine Indicators: Don't rely on just one sentiment indicator. Integrate several for a more robust view. Consider using the Put/Call Ratio, the AAII (American Association of Individual Investors) survey, and the CNN Fear & Greed Index. Cross-referencing these indicators can help validate or challenge initial interpretations.
-
Context is Key: Interpret sentiment data within the broader market context. Bearish sentiment during a prolonged downtrend might indicate a bottoming process. Conversely, the same sentiment in a strong uptrend could signal a potential correction.
-
Consider Timeframes: Different sentiment indicators operate on various timeframes. Short-term sentiment can fluctuate dramatically, while longer-term indicators offer more stability. Align your sentiment analysis timeframe with your trading strategy.
-
Learn and Adapt: Market dynamics constantly evolve. Continuously evaluate the effectiveness of your chosen sentiment indicators and be prepared to adjust your approach as market conditions change. Stay informed about new trends and advancements in sentiment analysis. New indicators and data sources are constantly emerging.
Key Takeaways
- Sentiment indicators offer valuable insights into market psychology.
- They are not perfect timing tools, but rather supporting components of a comprehensive analysis.
- Combining multiple indicators provides a more robust perspective.
- Context and timeframes are critical for accurate interpretation.
- Continuous learning and adaptation are essential for successful implementation.
Ready to improve your market analysis with real-time sentiment data? ChartsWatcher empowers professional traders with a sophisticated platform to track, analyze, and interpret market movements. From customizable dashboards and multi-screen configurations to powerful alerts and backtesting capabilities, ChartsWatcher gives you the tools for a decisive edge. Explore flexible pricing plans, from a free basic package to the comprehensive Pro Plan. Take control of your trading strategy and unlock deeper market insights with ChartsWatcher. Visit https://chartswatcher.com today!
