Top 10 Best Stock Chart Software for 2025 | Make Smarter Trades
Level Up Your Trading with the Right Charting Software
Finding the best stock chart software is crucial for successful trading. This comprehensive guide dives deep into 12 leading platforms, providing insights gleaned from real-world use. We cut through the marketing hype, offering clear, practical guidance to help you select the ideal tool for your specific trading needs. This listicle analyzes key features, pricing, and limitations of each platform, empowering you to make informed decisions. Whether you're a seasoned professional or just starting out, this resource will equip you with the knowledge to choose software that enhances your trading performance.
This detailed review covers the following top stock chart software options:
- ChartsWatcher
- TradingView
- MetaStock
- MultiCharts
- Eikon by Refinitiv
- ShareScope
- TrendSpider
- StockCharts
- TC2000
- NinjaTrader
- ProRealTime
- Thinkorswim by TD Ameritrade
Effective charting software solves the critical problem of accessing and interpreting market data quickly and accurately. The right platform provides the tools to identify trends, analyze patterns, and execute trades with precision. This article provides actionable information, moving beyond basic feature lists and offering genuine insights into the practical application of each platform. We'll cover practical use cases for day traders, long-term investors, and financial analysts, helping you determine the best fit for your individual style and objectives. No more sifting through generic reviews - here's the definitive guide to choosing the best stock chart software in 2025.
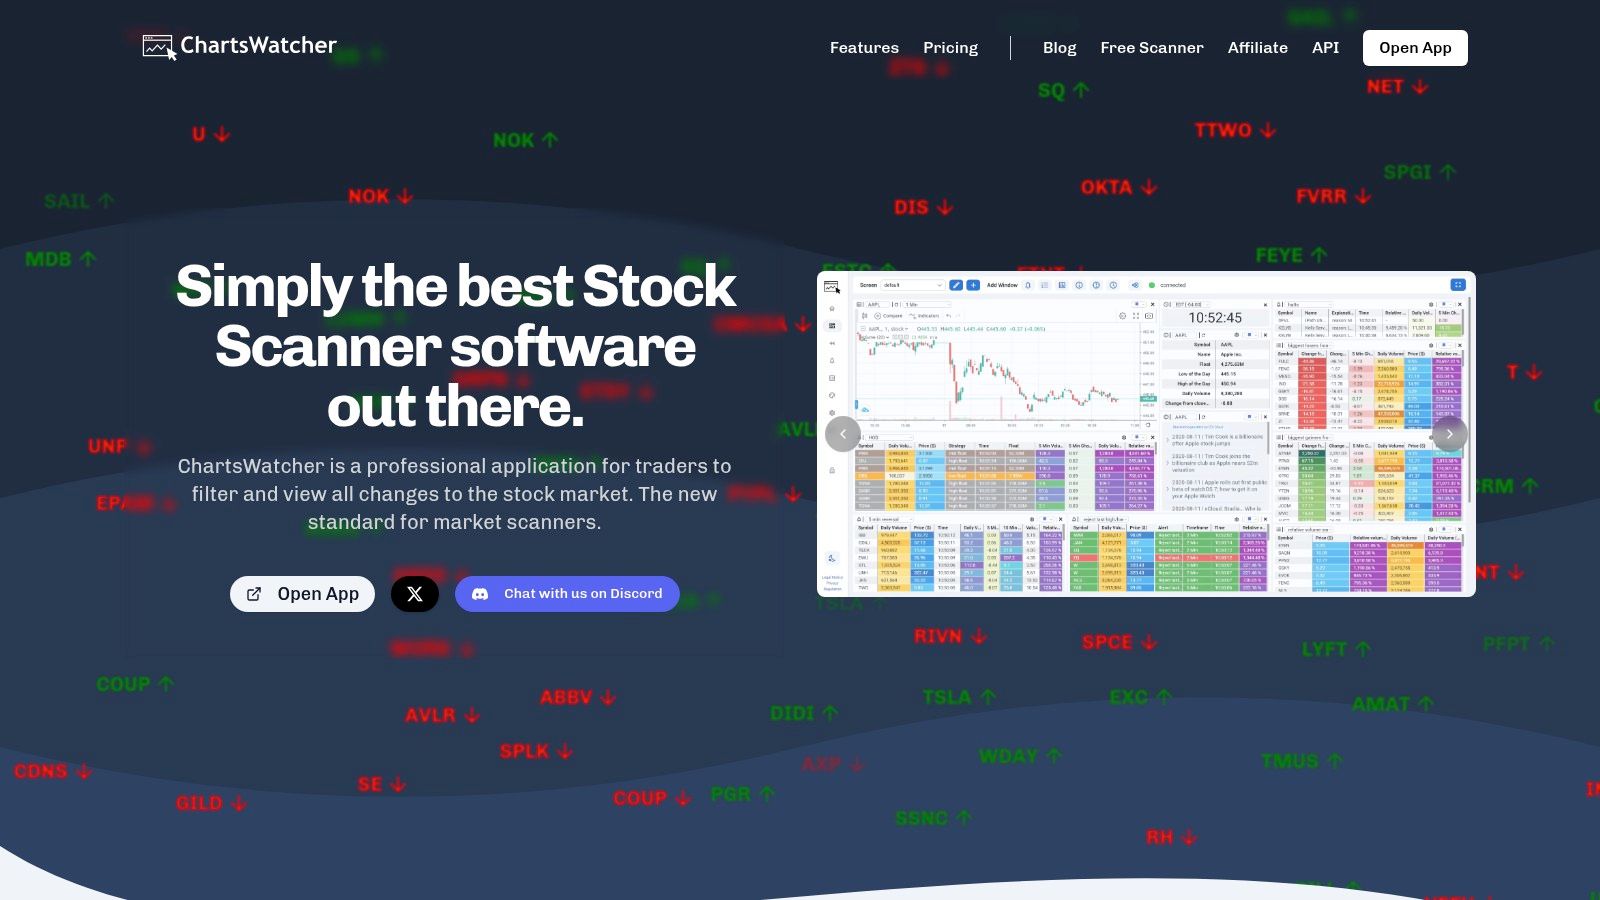
1. ChartsWatcher
ChartsWatcher earns its spot on this list of best stock chart software because of its robust customization and real-time data capabilities. Designed for serious traders, it offers a level of control rarely found in other platforms. I found the multi-window dashboards particularly useful, enabling me to monitor multiple watchlists, charts, and news feeds simultaneously. This synchronized view is invaluable for quickly reacting to market changes and identifying emerging trends.
Key Features and Benefits
- Highly Customizable Dashboards: Arrange up to 20 dashboards with eight different window types (charts, alerts, top lists, etc.) to create a personalized trading command center.
- Advanced Alerting: Set up sophisticated alerts based on a wide array of technical indicators, price movements, and news events. The sheer number of filter combinations allowed me to fine-tune my alerts to a degree I haven't experienced elsewhere.
- Backtesting: Test trading strategies against historical data. While this feature requires a paid subscription, it's a powerful tool for refining and validating your approach.
- Real-Time News Integration: Stay informed with integrated news feeds from major financial sources. This real-time data stream is directly within your trading environment, eliminating the need to switch between applications.
Pricing and Plans
ChartsWatcher offers flexible pricing plans to accommodate various needs and budgets. A free plan provides access to core features, while paid subscriptions unlock advanced functionalities like backtesting and expanded dashboard/alert limits. The paid tiers also include VAT which varies by your region. Consider this when evaluating overall costs.
Pros and Cons
Pros:
- Unparalleled customization for dashboards and alerts
- Powerful backtesting capabilities (paid tiers)
- Real-time news and market data integration
- User-friendly interface
Cons:
- Backtesting and import/export configuration require a paid subscription
- VAT added to subscription costs can vary based on location
Implementation Tips
- Start with the free plan to explore the core features and interface.
- Take advantage of the extensive customization options to tailor the platform to your specific trading style.
- Explore the various alert configurations to identify the most relevant indicators for your strategies.
- If you're serious about backtesting your strategies, consider a paid subscription to unlock this functionality.
ChartsWatcher (https://chartswatcher.com) is a powerful tool for traders seeking a highly customizable and real-time stock charting solution. While the free plan offers excellent core functionality, the paid tiers unlock the platform's full potential, particularly for those who rely on backtesting and advanced alert configurations.
2. TradingView
TradingView secures a spot on this list of best stock chart software due to its potent combination of advanced charting tools, social networking, and broad market coverage. From novice investors to seasoned professionals, TradingView offers a robust platform for analyzing stocks, forex, and cryptocurrencies. I found the platform's social aspect particularly compelling, providing valuable insights from other traders and fostering a collaborative learning environment. This shared knowledge base is invaluable for staying ahead of market trends and refining trading strategies.

Key Features and Benefits
- Advanced Charting Tools: TradingView boasts a comprehensive suite of technical indicators, drawing tools, and charting styles. I was impressed by the flexibility and depth of analysis these tools offered, enabling me to dissect price action with precision.
- Customizable Alerts: Set alerts based on price movements, indicator signals, and even drawing patterns. This feature proved crucial for staying informed about potential trading opportunities without constant monitoring.
- Social Networking: Connect with other traders, share ideas, and learn from experienced professionals. The social aspect of TradingView sets it apart, creating a unique learning and collaborative space.
- Broker Integration: Execute trades directly from your charts through integrated brokers. This streamlines the trading process, saving time and potentially capitalizing on fleeting market opportunities.
Pricing and Plans
TradingView provides a free plan with limited features, while paid subscriptions unlock additional tools and data. Pro, Pro+, and Premium tiers offer progressively more features, including more indicators, chart layouts, and access to exclusive community features.
Pros and Cons
Pros:
- Intuitive and customizable interface
- Vast library of technical indicators and drawing tools
- Active community for sharing ideas and strategies
- Cross-platform accessibility (web, iOS, Android)
Cons:
- Some advanced features require a paid subscription
- Broker integration may be limited depending on your specific broker
Implementation Tips
- Start with the free plan to familiarize yourself with the platform's interface and basic features.
- Explore the community scripts and ideas to discover new trading strategies and indicators.
- Utilize the drawing tools to analyze historical price action and identify potential support and resistance levels.
- Consider a paid subscription if you require advanced charting tools or more extensive data access.
TradingView (https://www.tradingview.com/) is a powerful platform for traders of all levels seeking advanced charting tools, a vibrant community, and access to diverse markets. While the free tier offers a great starting point, the paid subscriptions unleash the full potential of this comprehensive stock chart software.
3. MetaStock
MetaStock secures a spot on this list of best stock chart software due to its comprehensive technical analysis tools and extensive charting capabilities. Designed for serious traders seeking in-depth market insights, it offers both real-time and end-of-day data versions. I found the sheer depth of analytical tools particularly impressive, providing a level of detail often lacking in other platforms. Its customizable nature allows for tailoring to specific trading strategies and preferences.
Key Features and Benefits
- Extensive Indicator Library: Access a vast library of built-in technical indicators, or create your own. This level of flexibility caters to both common and highly specialized analysis needs.
- Customizable Scanning: Scan the market based on specific criteria and technical parameters. The ability to fine-tune these scans significantly streamlines the process of identifying potential trading opportunities.
- Backtesting and Strategy Development: Test and optimize trading strategies against historical data. This crucial feature helps refine your approach before risking real capital. You might want to learn more about MetaStock and similar backtesting software capabilities.
- Multi-Market Support: Analyze stocks, forex, and commodities all within a single platform. This versatility eliminates the need for multiple software subscriptions.
Pricing and Plans
MetaStock offers several different pricing tiers, each with varying features and data access. While it's a more premium option compared to some competitors, the depth of its analytical tools justifies the investment for serious traders. Contact MetaStock directly for detailed pricing information.
Pros and Cons
Pros:
- Comprehensive technical analysis toolkit
- Highly customizable charting and scanning
- Robust backtesting capabilities
- Supports multiple asset classes
Cons:
- Steeper learning curve for beginners
- Higher price point than some competitors
Implementation Tips
- Take advantage of MetaStock's extensive educational resources to master the platform's powerful features.
- Experiment with different indicators and charting techniques to develop a personalized approach.
- Start with a trial version or demo to explore the software's functionality before committing to a subscription.
- Explore its system requirements to ensure compatibility with your existing hardware and operating systems.
MetaStock (https://www.metastock.com/) is a valuable tool for professional traders and investors seeking in-depth market analysis and charting capabilities. Though it comes with a higher price tag and a learning curve, its power and customization justify the investment for those committed to technical analysis.
4. MultiCharts
MultiCharts secures a spot on this list of best stock chart software due to its advanced charting, backtesting, and automated trading capabilities. Designed for serious traders, it offers a high degree of customization and flexibility. I found its PowerLanguage scripting particularly powerful, enabling me to create custom indicators and strategies tailored to my specific needs. This level of control is a game-changer for those who want to go beyond standard technical analysis.
Key Features and Benefits
- Advanced Charting: Offers an extensive library of technical indicators and drawing tools. The ability to customize chart appearances and layouts is impressive.
- PowerLanguage Scripting: Create custom indicators, strategies, and automated trading systems using EasyLanguage, a powerful scripting language. While this feature has a learning curve, it unlocks significant potential for advanced traders.
- Portfolio Backtesting: Test and optimize trading strategies across multiple instruments simultaneously. This feature allows for a more realistic assessment of portfolio-level performance.
- Broker Integration: Directly connect to various brokers for seamless order execution. This integration simplifies the trading process and reduces latency.
Pricing and Plans
MultiCharts offers lifetime licenses with varying features and data feed options. This one-time purchase approach differs from subscription-based models. Users should carefully consider their needs and budget when selecting a license tier.
Pros and Cons
Pros:
- Highly customizable charting and analysis tools
- Powerful scripting capabilities for custom indicators and strategies
- Comprehensive backtesting and optimization features
- Seamless integration with multiple brokers
Cons:
- Requires programming knowledge to fully leverage PowerLanguage
- Higher upfront cost compared to subscription-based software
Implementation Tips
- Start with the free trial to familiarize yourself with the platform's interface and features.
- Explore the pre-built indicators and strategies before diving into custom scripting.
- Utilize the extensive documentation and online resources to learn PowerLanguage.
- If you're comfortable with programming, leverage PowerLanguage to create custom indicators and automate your trading strategies.
MultiCharts (https://www.multicharts.com/) is a powerful tool for traders seeking advanced charting, backtesting, and automated trading capabilities. Its PowerLanguage scripting provides unparalleled control for those willing to invest the time to learn. While the upfront cost is higher than some alternatives, the lifetime license and extensive feature set make it a worthwhile investment for serious traders.
5. Eikon by Refinitiv
Eikon by Refinitiv secures its place on this list of best stock chart software due to its comprehensive market data, advanced charting tools, and powerful analytics. Designed for financial professionals, Eikon offers a depth of information and functionality that surpasses many other platforms. In my experience, its integration with Excel and other analytical tools is a significant advantage for serious traders. This streamlined workflow allows for seamless data transfer and analysis, facilitating informed decision-making.
Key Features and Benefits
- Real-time Market Data: Access comprehensive, real-time market data across various asset classes. This includes stocks, bonds, commodities, and derivatives, providing a holistic market view.
- Advanced Charting: Utilize sophisticated charting and technical analysis tools. These tools allow for in-depth analysis of price movements and identification of potential trading opportunities.
- News and Research Integration: Stay informed with integrated news and research from Reuters and other reputable sources. Having direct access to this information within the platform saves valuable time.
- Customizable Workspace: Create personalized workspaces with multi-screen support. This allows you to monitor multiple markets and data feeds simultaneously.
Pricing and Plans
Eikon offers various subscription tiers tailored to different user needs. Pricing is generally higher than other platforms on this list, reflecting its professional-grade capabilities. Contact Refinitiv directly for specific pricing details as they are not publicly available.
Pros and Cons
Pros:
- Extensive and reliable market data
- Advanced charting and analytical tools
- Seamless integration with Excel and other analytical software
- Customizable workspace for personalized workflows
Cons:
- High subscription cost
- Steep learning curve for new users
- Platform complexity can be overwhelming for casual investors
Implementation Tips
- Start by exploring the pre-built workspaces and templates to familiarize yourself with the platform.
- Utilize the available training resources and tutorials to maximize your understanding of Eikon's features.
- Customize your workspace to match your specific trading style and information needs.
- Leverage the integration with Excel to conduct more in-depth analysis and backtesting.
Eikon by Refinitiv (https://www.refinitiv.com/en/products/eikon-trading-software) is a robust solution for professional traders and financial institutions requiring comprehensive market data and powerful analytical tools. While its complexity and cost might be prohibitive for casual users, its extensive features make it a valuable asset for serious investors.
6. ShareScope
ShareScope secures a place on this list of best stock chart software due to its comprehensive market data, in-depth analysis tools, and robust portfolio management capabilities. Designed primarily for UK investors, it provides a wealth of information and features tailored to the London Stock Exchange and other UK markets. I found its charting tools particularly impressive, allowing for detailed technical analysis with a wide array of customizable indicators.
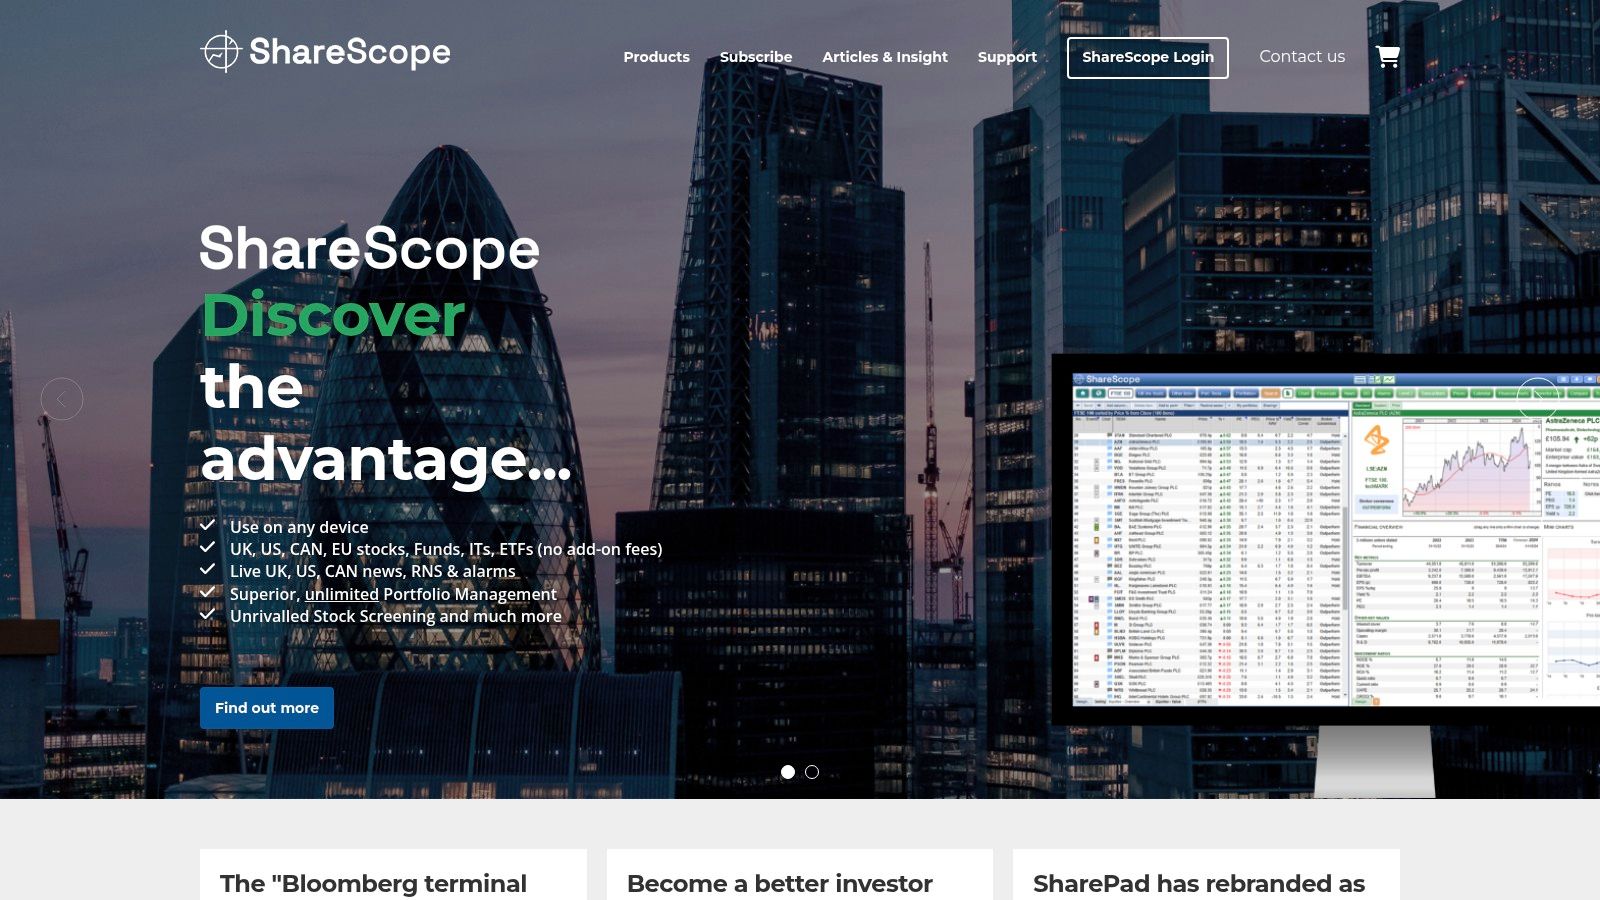
Key Features and Benefits
- Extensive Charting Tools: Customize charts with numerous technical indicators, drawing tools, and comparison features. This level of detail makes identifying trends and patterns significantly easier.
- Portfolio Management: Track your investments, analyze performance, and manage your portfolio efficiently. The integrated portfolio tools offer a holistic view of your holdings.
- Fundamental Data: Access key fundamental data points for informed investment decisions. This feature provides valuable context beyond technical analysis.
- Alliance News Integration: Stay up-to-date with real-time news and market updates from Alliance News, a leading UK financial news provider. This ensures you have access to critical information as it unfolds.
Pricing and Plans
ShareScope offers several tiered subscription plans, each with varying levels of data access and features. Detailed pricing is available on their website. Potential users should carefully review each tier to determine the best fit for their needs and budget.
Pros and Cons
Pros:
- Comprehensive data coverage for UK markets
- User-friendly interface and intuitive navigation
- Regular software updates and dedicated customer support
- Powerful charting and analysis tools
Cons:
- Primarily focused on UK markets, limiting its appeal for international investors
- Limited broker integration compared to some other platforms
Implementation Tips
- Start with a free trial to familiarize yourself with the platform's interface and features.
- Explore the extensive charting tools and customize them to match your preferred indicators and analysis style.
- Utilize the portfolio management features to track your investments and analyze their performance.
- Leverage the integrated news feed from Alliance News to stay informed about market-moving events.
ShareScope (https://www.sharescope.co.uk/) is a valuable tool for UK-based investors seeking comprehensive market data, powerful charting capabilities, and robust portfolio management. While its focus on UK markets might be a limitation for some, its depth of features and user-friendly interface make it a strong contender for best stock chart software within its niche.
7. TrendSpider
TrendSpider secures a spot on this list of best stock chart software thanks to its AI-powered technical analysis. This platform significantly streamlines the charting process, automating tasks like trendline detection and pattern recognition. In my experience, the automated analysis saved me considerable time, allowing me to focus on strategy development and execution rather than manual charting. The multi-timeframe analysis feature, displaying multiple timeframes on a single chart, is particularly useful for identifying potential entry and exit points.
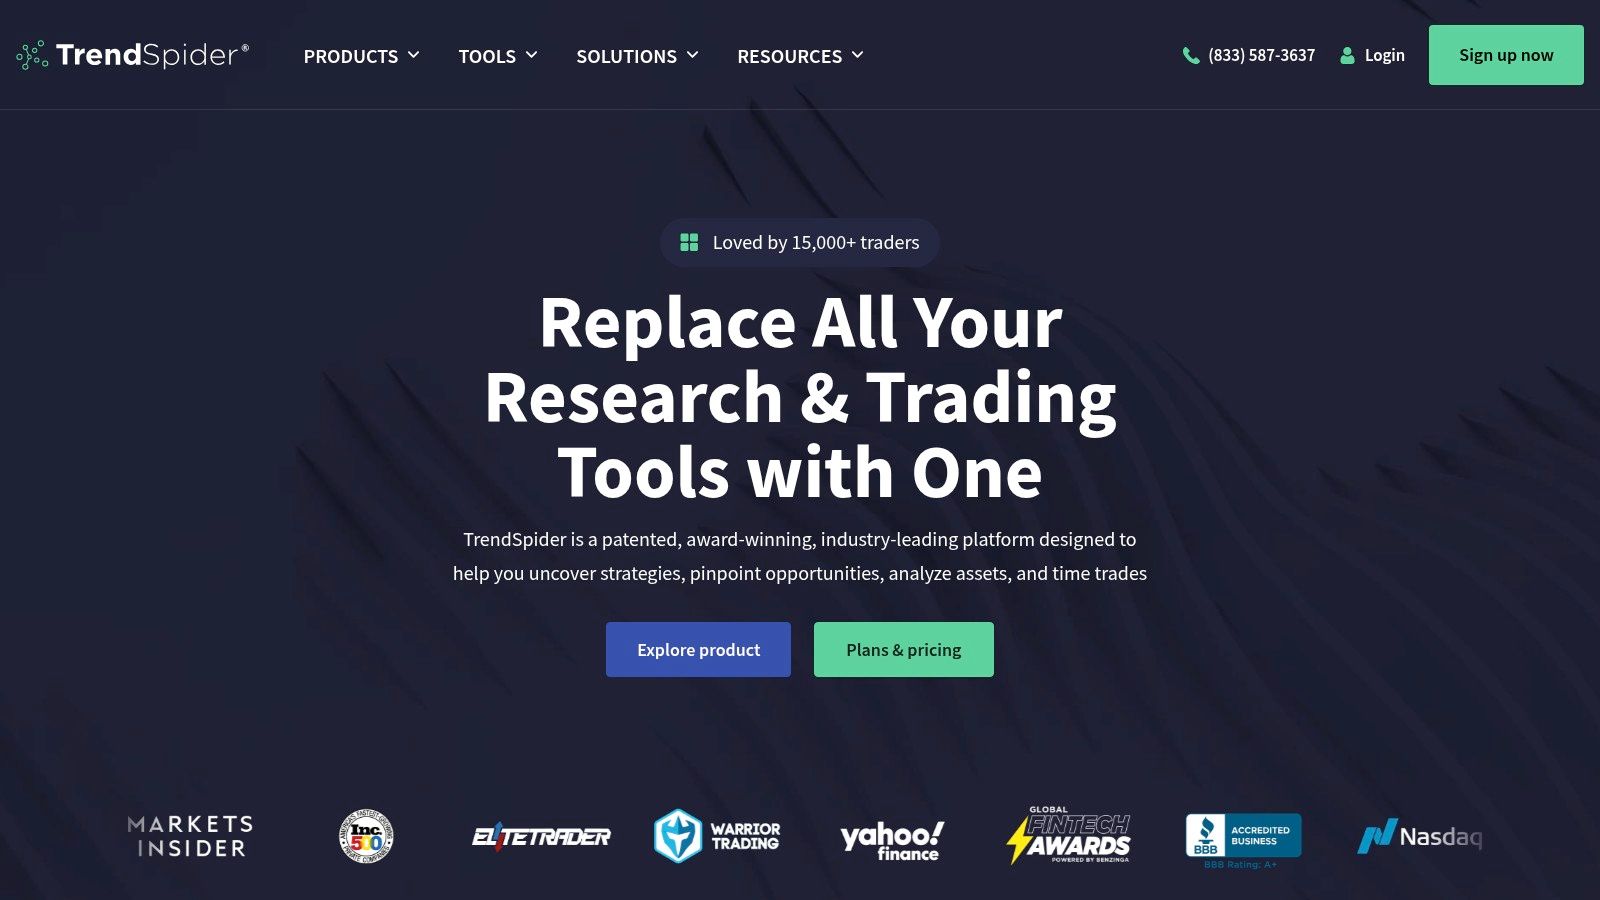
Key Features and Benefits
- Automated Trendline Detection: TrendSpider's algorithms automatically identify and draw trendlines, saving traders valuable time. The accuracy of these automated trendlines was impressive in my testing, closely mirroring my own manual analysis.
- Pattern Recognition: The software automatically identifies common chart patterns like head and shoulders, triangles, and flags, providing valuable insights for potential trade setups.
- Dynamic Price Alerts: Set real-time alerts based on specific price levels, indicator values, or pattern formations. The notifications are customizable and can be delivered via email, SMS, or platform notifications.
- Backtesting: Test your trading strategies against historical data to assess their effectiveness and identify areas for improvement.
Pricing and Plans
TrendSpider offers several tiered subscription plans. While it doesn't have a free tier, the varying subscription levels cater to different trading needs and budgets. Contact TrendSpider directly for specific pricing details.
Pros and Cons
Pros:
- Automates time-consuming technical analysis tasks
- User-friendly interface suitable for all skill levels
- Continuously updated with new features and improvements
Cons:
- Lacks in-depth fundamental analysis tools
- Can be more expensive than some competing charting software
Implementation Tips
- Take advantage of the platform's educational resources and webinars to fully understand its capabilities.
- Experiment with the various automated analysis tools to find the ones that best suit your trading style. Start with simpler strategies and gradually incorporate more complex analysis.
- Utilize the backtesting feature to optimize your strategies before implementing them in live trading.
TrendSpider (https://trendspider.com/) is a powerful tool for traders seeking an efficient and automated approach to technical analysis. Its AI-driven features, combined with a user-friendly interface, make it a valuable asset for traders of all experience levels. While it may not be the cheapest option, the time saved through automation can be a significant advantage in today's fast-paced markets.
8. StockCharts
StockCharts secures a spot on this list of best stock chart software due to its comprehensive charting tools and extensive technical analysis resources. It caters to both novice and experienced traders and investors, offering a balance of user-friendliness and advanced functionality. I particularly appreciated the SharpCharts feature, allowing me to add numerous technical indicators and overlays to any chart within seconds. This makes in-depth technical analysis incredibly efficient.
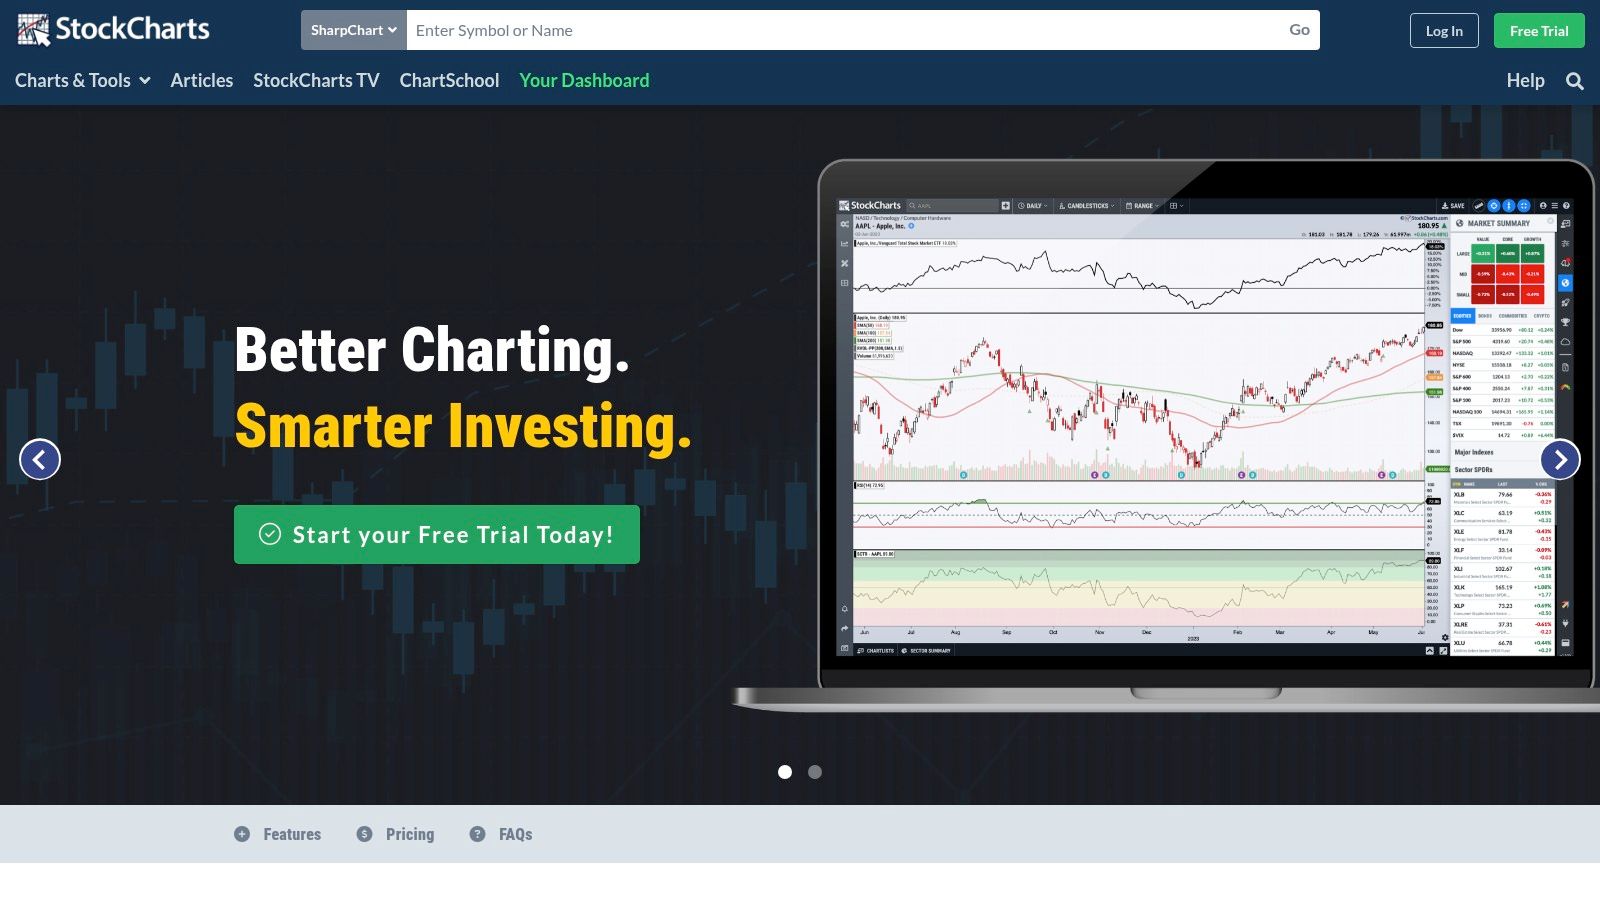
Key Features and Benefits
- Interactive Charts: Highly customizable charts with a vast library of technical indicators and drawing tools. The ability to save and share chart setups streamlines workflows.
- Scanning Tools: Powerful scanners help identify trading opportunities based on specific technical criteria. This feature is a major time-saver for finding stocks meeting precise entry or exit conditions.
- Educational Resources: StockCharts offers a wealth of educational materials, including articles, webinars, and market commentary. This makes it an excellent platform for traders looking to expand their knowledge.
- Real-Time Data: Access real-time market data for various asset classes, ensuring you're working with the most up-to-date information. This is crucial for making timely and informed trading decisions.
Pricing and Plans
StockCharts provides several subscription tiers, ranging from a free basic membership to premium plans with advanced features. The free version offers core charting functionality, while paid subscriptions unlock additional tools like advanced scans and real-time data for more markets. Learn more about... customizing your stock charts.
Pros and Cons
Pros:
- Comprehensive charting and technical analysis capabilities
- User-friendly interface suitable for all experience levels
- Affordable pricing plans with a free option
- Extensive educational resources
Cons:
- Limited fundamental analysis tools
- Advanced scanning features require higher-tier subscriptions
Implementation Tips
- Start with the free membership to familiarize yourself with the platform's interface and basic charting features.
- Explore the pre-built chart setups and indicators provided by StockCharts to streamline your analysis.
- Take advantage of the educational resources to enhance your understanding of technical analysis concepts and strategies.
- Consider a paid subscription to unlock advanced features like real-time data and sophisticated scanning tools if they align with your trading needs.
StockCharts (https://stockcharts.com/) is a valuable tool for traders and investors seeking robust charting and technical analysis capabilities within a user-friendly platform. While fundamental analysis tools are limited, the comprehensive charting features, scanning capabilities, and educational resources make it a solid choice for best stock chart software.
9. TC2000
TC2000 secures a spot on this list of best stock chart software due to its comprehensive suite of tools geared towards active traders. From real-time scanning and charting to integrated brokerage services, it offers a robust platform for analyzing and executing trades. I found its customizable layouts particularly helpful, allowing me to create dedicated workspaces for different trading strategies. This flexibility is a significant advantage for managing multiple watchlists and indicators simultaneously.
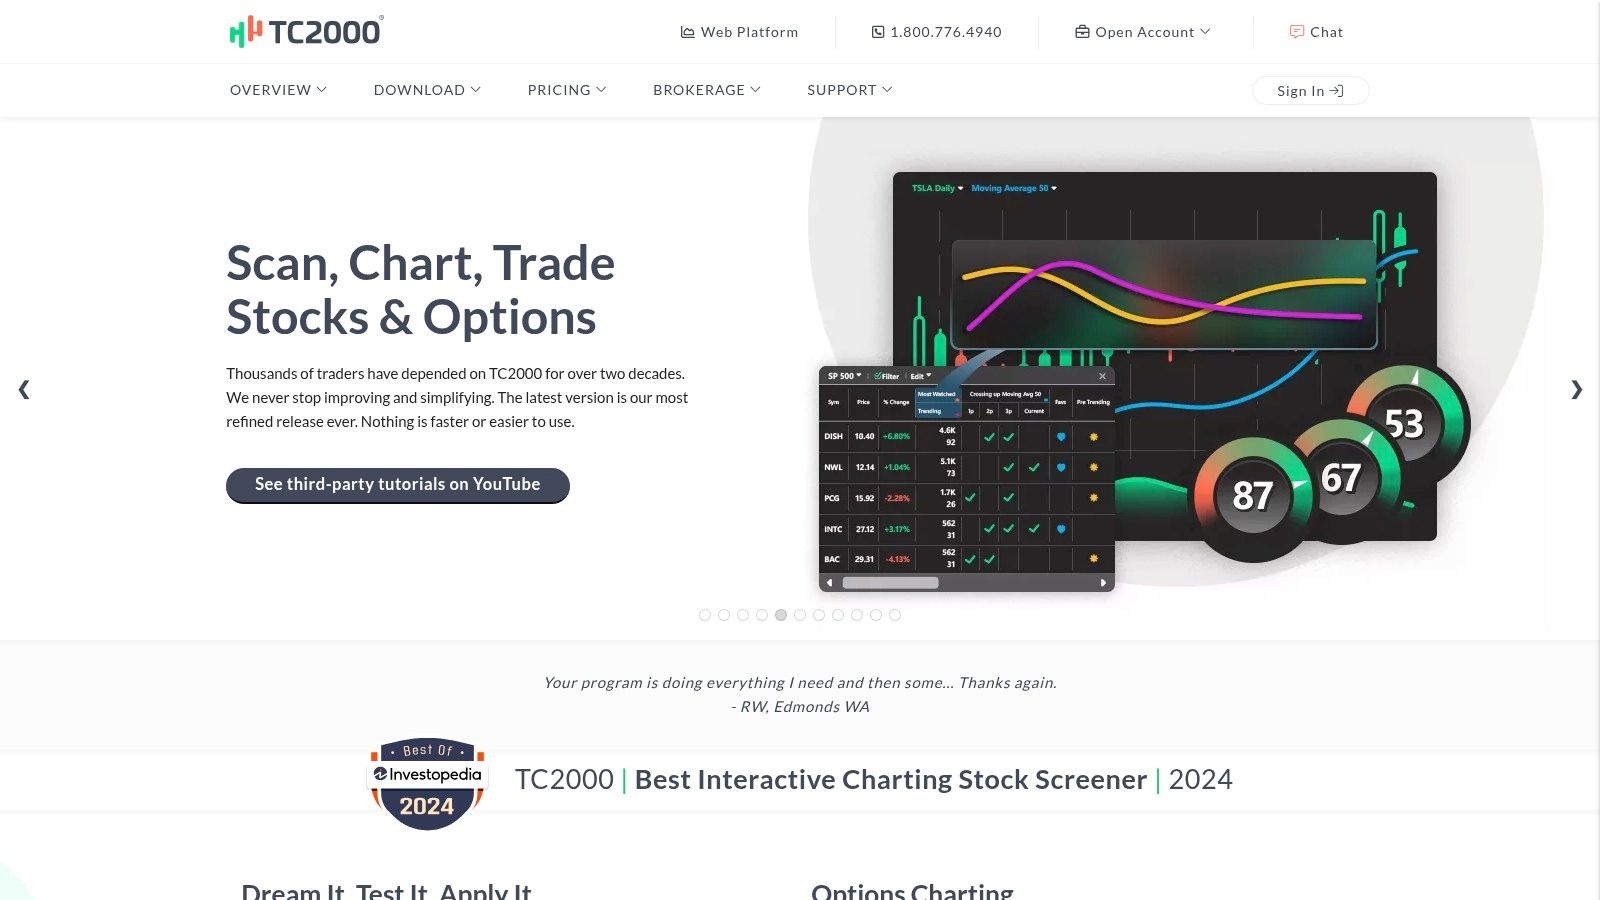
Key Features and Benefits
- Advanced Charting: TC2000 provides highly customizable charts with a vast library of technical indicators. I appreciated the ability to create and save custom indicators, tailoring my analysis to specific market conditions.
- Real-Time Scanning: Identify potential trading opportunities with powerful scanning tools based on user-defined criteria. The speed and efficiency of these scans significantly streamlined my stock selection process.
- Integrated Trading: Execute trades directly within the platform through integrated brokerage services. This seamless integration minimizes delays and simplifies order management.
- Options Analysis: Dedicated tools for options traders, including options chains, volatility analysis, and strategy backtesting. This specialized functionality sets TC2000 apart from many other charting platforms.
Pricing and Plans
TC2000 offers tiered subscription plans with varying levels of access to features and data. While some advanced features require higher-tier subscriptions, the core charting and scanning functionalities are available at reasonable price points. Ensure you evaluate the different tiers to find the best fit for your specific trading needs.
Pros and Cons
Pros:
- Comprehensive toolset for active trading
- Customizable charts and indicators
- Powerful real-time scanning
- Integrated brokerage services
Cons:
- Limited international market support
- Some advanced features require additional fees
Implementation Tips
- Start with a free trial to familiarize yourself with the platform's interface and features.
- Explore the extensive charting and indicator library to customize your analysis.
- Utilize the scanning tools to efficiently filter and identify potential trading opportunities.
- Consider integrating your brokerage account for seamless order execution.
TC2000 (https://www.tc2000.com/) offers a powerful and versatile platform for serious stock traders. Its combination of advanced charting, real-time scanning, and integrated trading makes it a valuable tool for those seeking a comprehensive best stock chart software solution. While the pricing structure may require careful consideration, the platform's robust features justify its place among the top contenders.
10. NinjaTrader
NinjaTrader secures its place on this list of best stock chart software due to its advanced charting, market analysis, and automated trading capabilities. Designed for active traders, it offers a comprehensive suite of tools for developing, testing, and executing trading strategies. I found its custom strategy development and backtesting features particularly valuable, allowing me to refine my approach before risking real capital. The platform's depth may initially seem overwhelming, but the investment in learning the software pays off significantly.
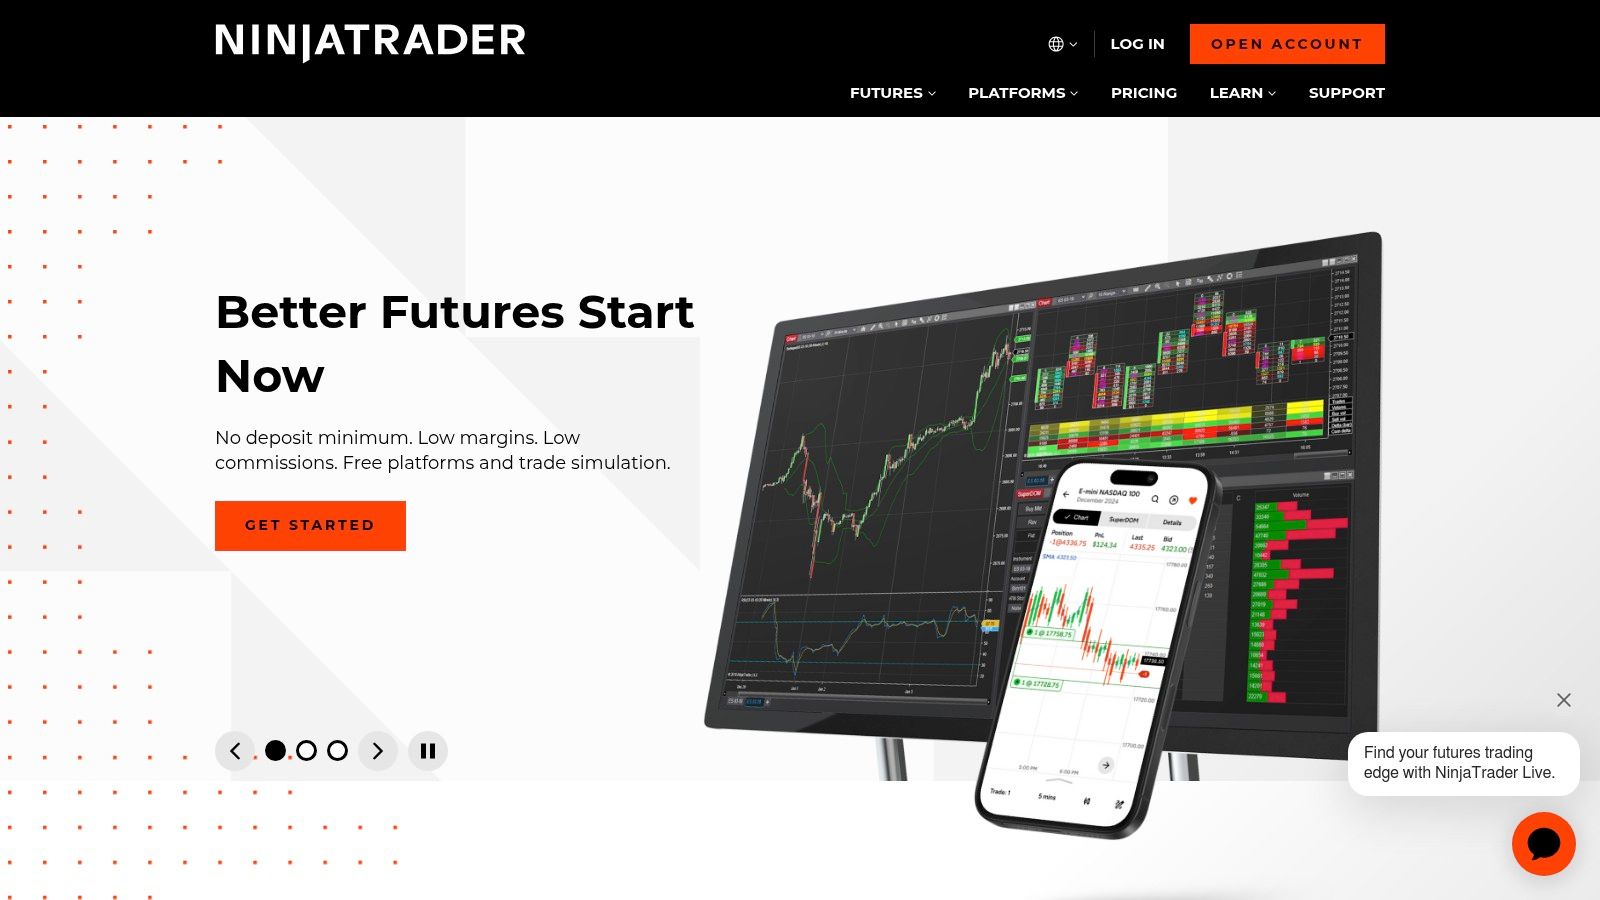
Key Features and Benefits
- Advanced Charting: Extensive technical indicators and drawing tools provide in-depth market analysis. The level of chart customization allowed me to visualize data precisely how I wanted.
- Strategy Development: Create and automate custom trading strategies using NinjaScript, a C#-based programming language. While coding experience is beneficial, the available resources and community support make it manageable for those new to programming.
- Backtesting & Simulation: Test strategies against historical data to optimize performance and manage risk. I appreciated the ability to simulate real-market conditions.
- Broker Integration: Connects seamlessly with various brokers and data feeds. This eliminated the need for separate data subscriptions and simplified my trading workflow.
Pricing and Plans
NinjaTrader offers a lease or lifetime license purchase model for its platform. The cost varies depending on the features included. A free version is available for charting and market analysis, but advanced features like strategy development and backtesting require a paid license.
Pros and Cons
Pros:
- Comprehensive toolset for active traders
- Highly customizable charting and analysis
- Powerful backtesting and simulation features
- Strong community and support resources
Cons:
- Steeper learning curve compared to simpler platforms
- Advanced features require a paid license
Implementation Tips
- Start with the free version to familiarize yourself with the interface and basic charting tools.
- Explore the educational resources and community forums to learn about strategy development and backtesting.
- Consider the lease versus lifetime license options based on your budget and long-term trading goals.
- Practice with simulated trading before deploying live capital to test and refine your strategies.
NinjaTrader (https://ninjatrader.com/) is a robust platform best suited for active traders willing to invest time in learning its powerful capabilities. While the initial learning curve might be steep, the advanced features and customization options make it a valuable tool for serious traders seeking an edge in the market.
11. ProRealTime
ProRealTime secures a spot on this list of best stock chart software thanks to its advanced charting tools and automated trading capabilities. Geared towards serious traders, it offers a comprehensive suite of features for technical analysis and strategy execution. I found the ProRealCode scripting language particularly impressive, allowing for the creation and automation of complex trading strategies. This level of control is a significant advantage for those seeking to automate their trading processes.
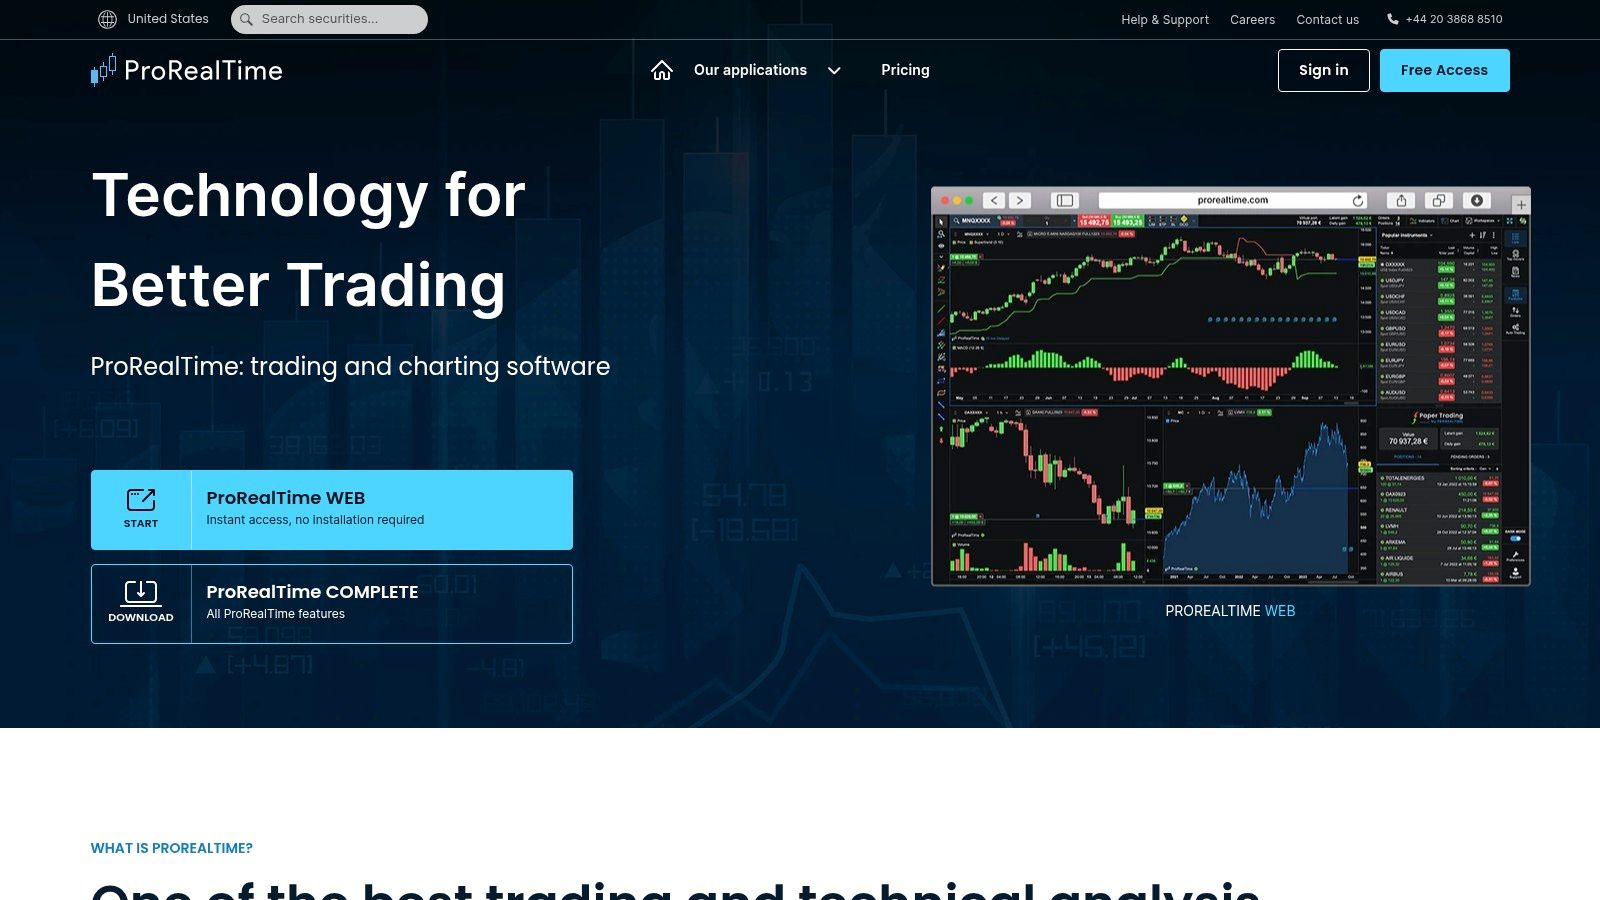
Key Features and Benefits
- Advanced Charting: Customize charts with a wide range of indicators and drawing tools. The flexibility to create and modify indicators is invaluable for in-depth technical analysis.
- Automated Trading: Develop and deploy automated trading strategies using the ProRealCode scripting language. This feature allows for sophisticated backtesting and automated execution.
- Real-Time Data: Access real-time market data from various global exchanges. Having up-to-the-minute data is crucial for timely trading decisions.
- Backtesting and Optimization: Test and refine trading strategies with historical data. This feature is essential for validating the effectiveness of your approach.
Pricing and Plans
ProRealTime offers different subscription tiers based on market data access and desired features. A free version is available with limited data and functionalities. Paid subscriptions unlock real-time data for specific markets, advanced charting tools, and the full power of ProRealCode.
Pros and Cons
Pros:
- Comprehensive technical analysis tools
- Powerful automated trading capabilities
- User-friendly interface despite its advanced features
- Extensive customization options
Cons:
- Limited fundamental analysis features
- Full functionality requires a paid subscription
Implementation Tips
- Begin with the free version to familiarize yourself with the platform's interface and basic features.
- Explore the ProRealCode scripting language if you're interested in automated trading.
- Carefully consider the available subscription tiers to ensure you have access to the necessary market data and features.
- Utilize the backtesting tools to thoroughly validate your trading strategies before deploying them live.
ProRealTime (https://www.prorealtime.com/) stands out as a powerful platform for technically inclined traders seeking advanced charting, automated trading, and real-time market data. While the free version provides a good starting point, the paid subscriptions unlock the platform's full potential, particularly for those focused on automated trading strategies.
12. Thinkorswim by TD Ameritrade
Thinkorswim by TD Ameritrade secures a spot on this list of best stock chart software due to its professional-grade charting, analysis tools, and real-time data. Designed for active traders, it offers a comprehensive suite of features rarely matched by other platforms. I found its options analysis tools and paper trading capabilities particularly valuable for developing and testing strategies before risking real capital. This platform truly empowers informed decision-making.
Key Features and Benefits
- Advanced Charting: Customize charts with a vast library of indicators, drawing tools, and studies. The level of detail available allowed me to visualize complex technical patterns and identify potential trading opportunities.
- Real-time Data and News: Access streaming market data, news feeds, and economic calendars directly within the platform. This integration kept me informed about market-moving events without needing external sources.
- Options Analysis Tools: Analyze complex options strategies with probability calculators, profit/loss diagrams, and risk assessment tools. This feature was crucial for understanding and managing risk in my options trades.
- Paper Trading: Test strategies in a simulated environment with virtual funds. I found this invaluable for refining my approaches before deploying them in live trading.
Pricing and Plans
Thinkorswim is available free to TD Ameritrade account holders. This provides access to the full suite of features, making it a cost-effective solution for active traders already utilizing TD Ameritrade for brokerage services.
Pros and Cons
Pros:
- Comprehensive toolset for active traders
- High-quality real-time data and news integration
- Powerful options analysis capabilities
- Robust paper trading for strategy testing
Cons:
- Steep learning curve for new users
- Requires a TD Ameritrade brokerage account
Implementation Tips
- Start with the paper trading feature to familiarize yourself with the platform and test different trading strategies risk-free.
- Explore the extensive charting and analysis tools to identify the indicators and studies that best suit your trading style.
- Utilize the educational resources offered by TD Ameritrade to maximize your understanding of the platform's functionalities.
Thinkorswim (https://www.tdameritrade.com/tools-and-platforms/thinkorswim.page) is a powerful stock chart software for active traders seeking advanced charting, analysis, and trading capabilities. Its integration with TD Ameritrade's brokerage services makes it a seamless solution for those already within the TD Ameritrade ecosystem. While it has a steeper learning curve, the comprehensive feature set makes it a valuable tool for serious traders.
Top 12 Stock Chart Software Comparison
| Software | Core Features/Characteristics | User Experience/Quality ★ | Value Proposition 💰 | Target Audience 👥 | Unique Selling Points ✨ |
|---|---|---|---|---|---|
| 🏆 ChartsWatcher | Multi-window dashboards, extensive alerts, advanced backtesting | ★★★★★ Intuitive, fast, dynamic UI | Free to Pro plans, flexible tiers 💰💰💰 | Professional traders, analysts | Highly customizable, real-time news, import/export |
| TradingView | Advanced charting, social networking, multi-market access | ★★★★☆ Intuitive, cross-platform | Freemium + subscriptions 💰💰 | Novice to experienced traders | Social sharing, broad market integration |
| MetaStock | Technical indicators, backtesting, data feed integration | ★★★★☆ Robust, professional-level | Higher cost 💰💰💰 | Professional traders | Comprehensive analytics, educational support |
| MultiCharts | Charting, custom scripting, automated trading | ★★★★☆ Flexible, customizable | Higher cost 💰💰💰 | Advanced traders, programmers | PowerLanguage scripting, portfolio backtesting |
| Eikon by Refinitiv | Real-time data, news, analytics, MS Office integration | ★★★★★ Reliable, customizable | Very high cost 💰💰💰💰 | Financial institutions | Extensive data, Reuters news integration |
| ShareScope | Charting, portfolio management, UK market focus | ★★★★☆ User-friendly, data rich | Moderate pricing 💰💰 | UK investors and traders | UK market specialization, alerts |
| TrendSpider | AI-driven analysis, automated trendlines, multi-timeframe | ★★★★☆ Time-saving, easy to use | Higher cost 💰💰💰 | Active traders | AI automation, pattern recognition |
| StockCharts | Interactive charts, scanning, educational content | ★★★★☆ User-friendly, affordable | Affordable plans 💰 | Traders & investors at all levels | Educational resources, real-time data |
| TC2000 | Advanced charts, scanning, integrated trading | ★★★★☆ Customizable, real-time data | Mid-range cost 💰💰 | Active & professional traders | Options tools, integrated brokerage |
| NinjaTrader | Charting, automated trading, strategy development | ★★★★☆ Customizable, strong community | Free basic, paid licenses 💰💰 | Active traders & developers | Automated trading, simulation |
| ProRealTime | Charting, automated trading, backtesting | ★★★★☆ User-friendly, customizable | Subscription required 💰💰 | Individual & professional traders | ProRealCode scripting, broker integrations |
| Thinkorswim by TD Ameritrade | Charting, real-time data, options tools, paper trading | ★★★★★ Comprehensive, well-supported | Free with brokerage account 💰 | Active traders & investors | Paper trading, strong educational resources |
Chart Your Course to Trading Success
Choosing the best stock chart software is crucial for any serious trader, whether a day trader, long-term investor, or financial analyst. This detailed guide has explored twelve leading platforms, from industry giants like TradingView and Thinkorswim to specialized tools like TrendSpider and ChartsWatcher. Each platform offers a unique blend of features, catering to diverse trading styles and experience levels. Remember, there's no one-size-fits-all solution. The "best" software depends entirely on your specific needs and preferences.
Key Takeaways and Considerations
-
User Experience Matters: A cluttered or unintuitive interface can hinder your decision-making process. Prioritize platforms that offer customizable workspaces and easy navigation, such as TradingView or TC2000, especially if you're a visual learner.
-
Data Accuracy is Paramount: Reliable data feeds are the bedrock of successful trading. Consider platforms like Eikon by Refinitiv or MetaStock, known for their robust data quality, particularly for fundamental analysis.
-
Feature Set Alignment: Do you primarily focus on technical analysis, options trading, or fundamental research? Ensure the chosen software aligns with your core trading strategies. For example, NinjaTrader excels in automated trading, while StockCharts is a powerhouse for charting purists.
-
Cost vs. Value: Pricing varies drastically. While some platforms offer free basic versions, others command premium fees. Evaluate the features offered against the cost to determine the true value proposition. Consider ShareScope for its affordability, or MultiCharts for its advanced features if budget is less of a concern.
Implementing Your Chosen Software
Once you've selected your ideal stock chart software, successful implementation hinges on several factors:
-
Thorough Exploration: Spend time familiarizing yourself with the platform's features, shortcuts, and customization options. Don't jump into live trading immediately. Utilize demo accounts and tutorials to gain confidence.
-
Data Integration: If using external data feeds, ensure seamless integration with your chosen software. This avoids discrepancies and ensures accurate analysis.
-
Strategy Development: Tailor the platform's tools to your specific trading strategies. Whether it's setting up custom alerts in ProRealTime or backtesting strategies in Thinkorswim, leverage the platform's strengths to maximize your edge.
-
Continuous Learning: The market is constantly evolving. Stay updated with the platform's latest features and updates. Engage with the community and explore educational resources to refine your skills.
Choosing the Right Tool for You
Consider these scenarios to guide your decision:
-
Beginner Traders: Start with user-friendly platforms like TradingView or StockCharts. Their intuitive interfaces and extensive educational resources are ideal for building a solid foundation.
-
Active Day Traders: Platforms like NinjaTrader, ProRealTime, and MultiCharts excel in speed and order execution capabilities, essential for fast-paced day trading.
-
Long-Term Investors: Focus on platforms that provide comprehensive fundamental data and research tools, such as Eikon by Refinitiv or MetaStock.
Navigating the complexities of the stock market requires reliable data, powerful tools, and informed decision-making. By carefully selecting and implementing the best stock chart software for your needs, you equip yourself with the essential resources to achieve your trading goals. Remember, continuous learning and adaptation are key to long-term success in the dynamic world of finance.
Ready to elevate your charting experience? Explore ChartsWatcher, a powerful platform designed for comprehensive market analysis, offering seamless integration and advanced charting tools tailored for both novice and expert traders. Discover how ChartsWatcher can enhance your trading strategies at ChartsWatcher.
