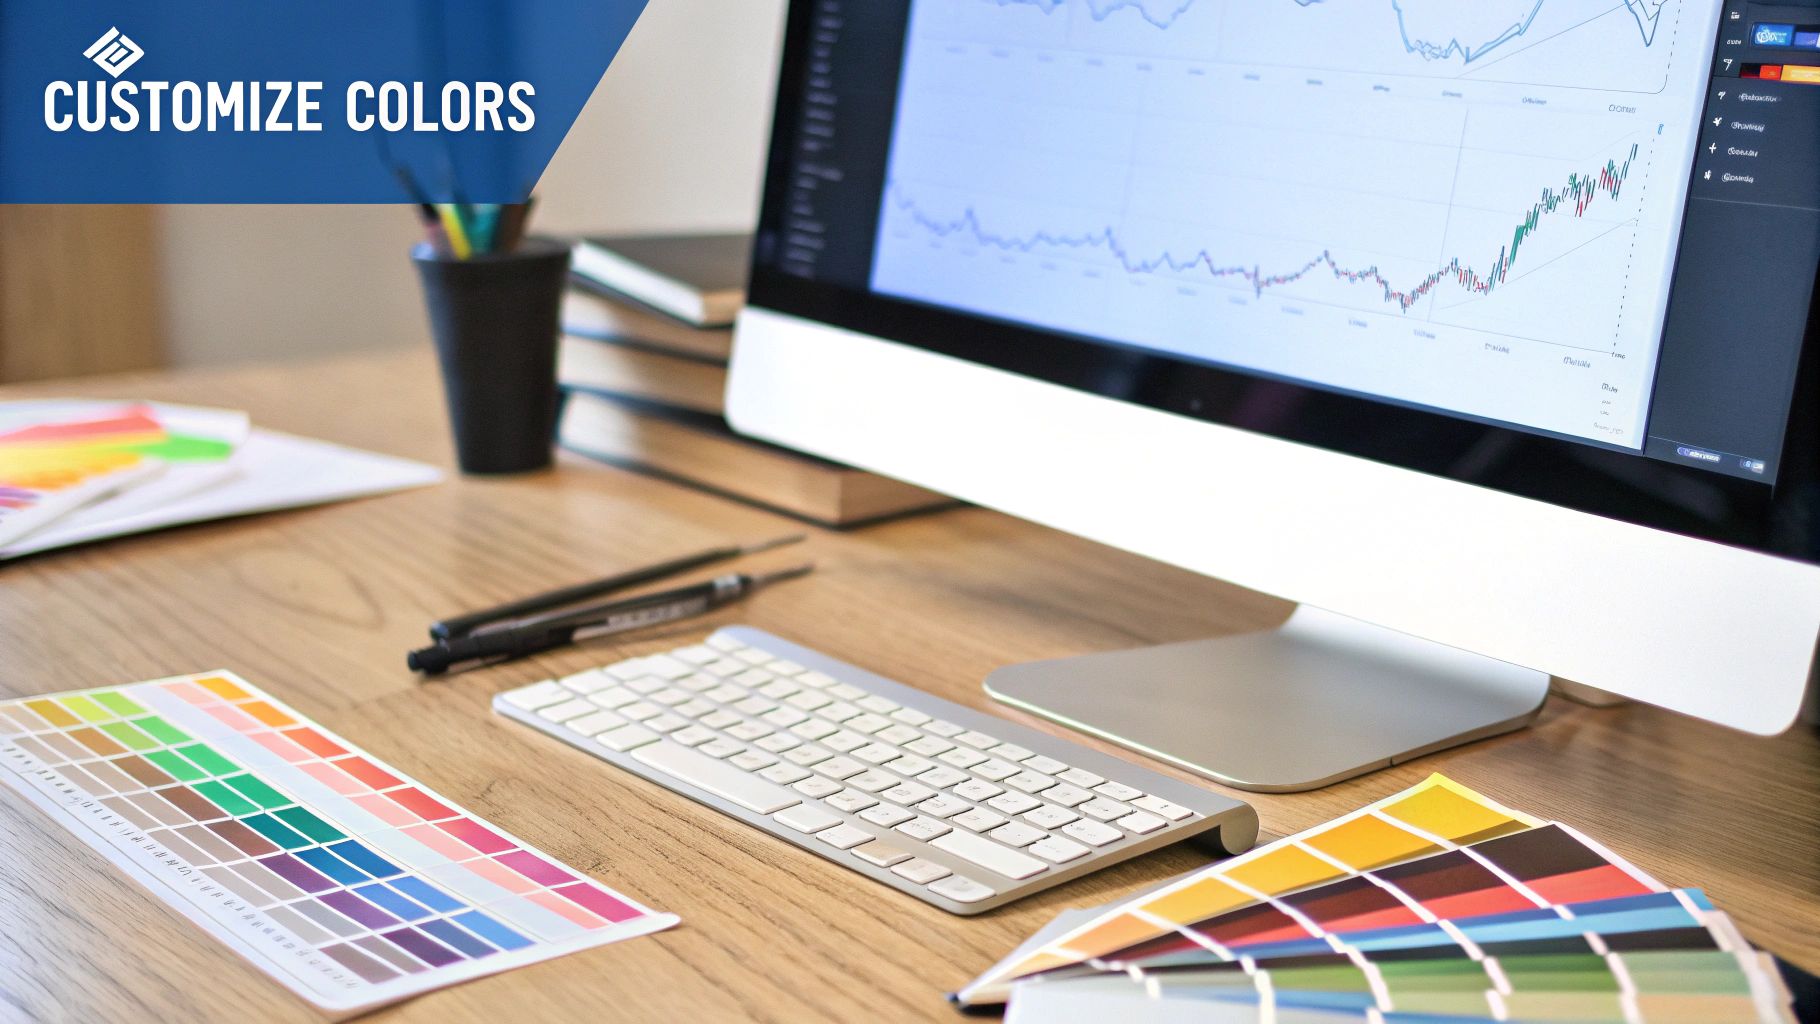
How to Customize Stock Charts for Smarter Trading Strategies
The Psychology Behind Powerful Chart Customization
Customizing stock charts isn't simply about making them look nice; it's about sharpening your analytical skills and making smarter trading decisions. Standard chart setups can often hide critical patterns and valuable information, limiting a trader's full potential. By adjusting charts to fit individual needs and strategies, traders can gain a much deeper understanding of how the market moves. Top fund managers know this and spend considerable time refining their chart setups to gain an advantage. This careful approach changes how they make decisions, allowing them to spot opportunities and manage risks better.
Eliminating Emotional Triggers and Cognitive Biases
A major psychological benefit of customized charts is the reduction of emotional trading. By highlighting key indicators and filtering out distracting information, traders can make more objective choices, minimizing the influence of fear and greed.
For example, customizing charts to show specific support and resistance levels can prevent impulsive trades driven by short-term market swings. Custom visuals also help reduce confirmation bias, a common thinking error where traders look for information that supports their existing beliefs and ignore evidence that contradicts them. Customized charts offer a clear and objective view of the market, helping traders base decisions on data, not emotions.
Enhancing Pattern Recognition and Trading Discipline
Customizing stock charts significantly improves pattern recognition. Imagine a personalized map: a standard map shows the general area, but a custom map highlights specific landmarks and routes relevant to your trip. Similarly, customized stock charts emphasize patterns and indicators that fit a trader's particular strategy, making them easier to see and understand. This improved pattern recognition lets traders spot potential opportunities and react faster to changing market conditions. This can lead to higher profits and lower risk.
Customizing stock charts is essential for investors and traders, allowing them to visualize data in a way that works for them. Platforms like Koyfin offer hundreds of technical analysis indicators that can be added to charts, giving users a complete view of market trends and potential investment opportunities.
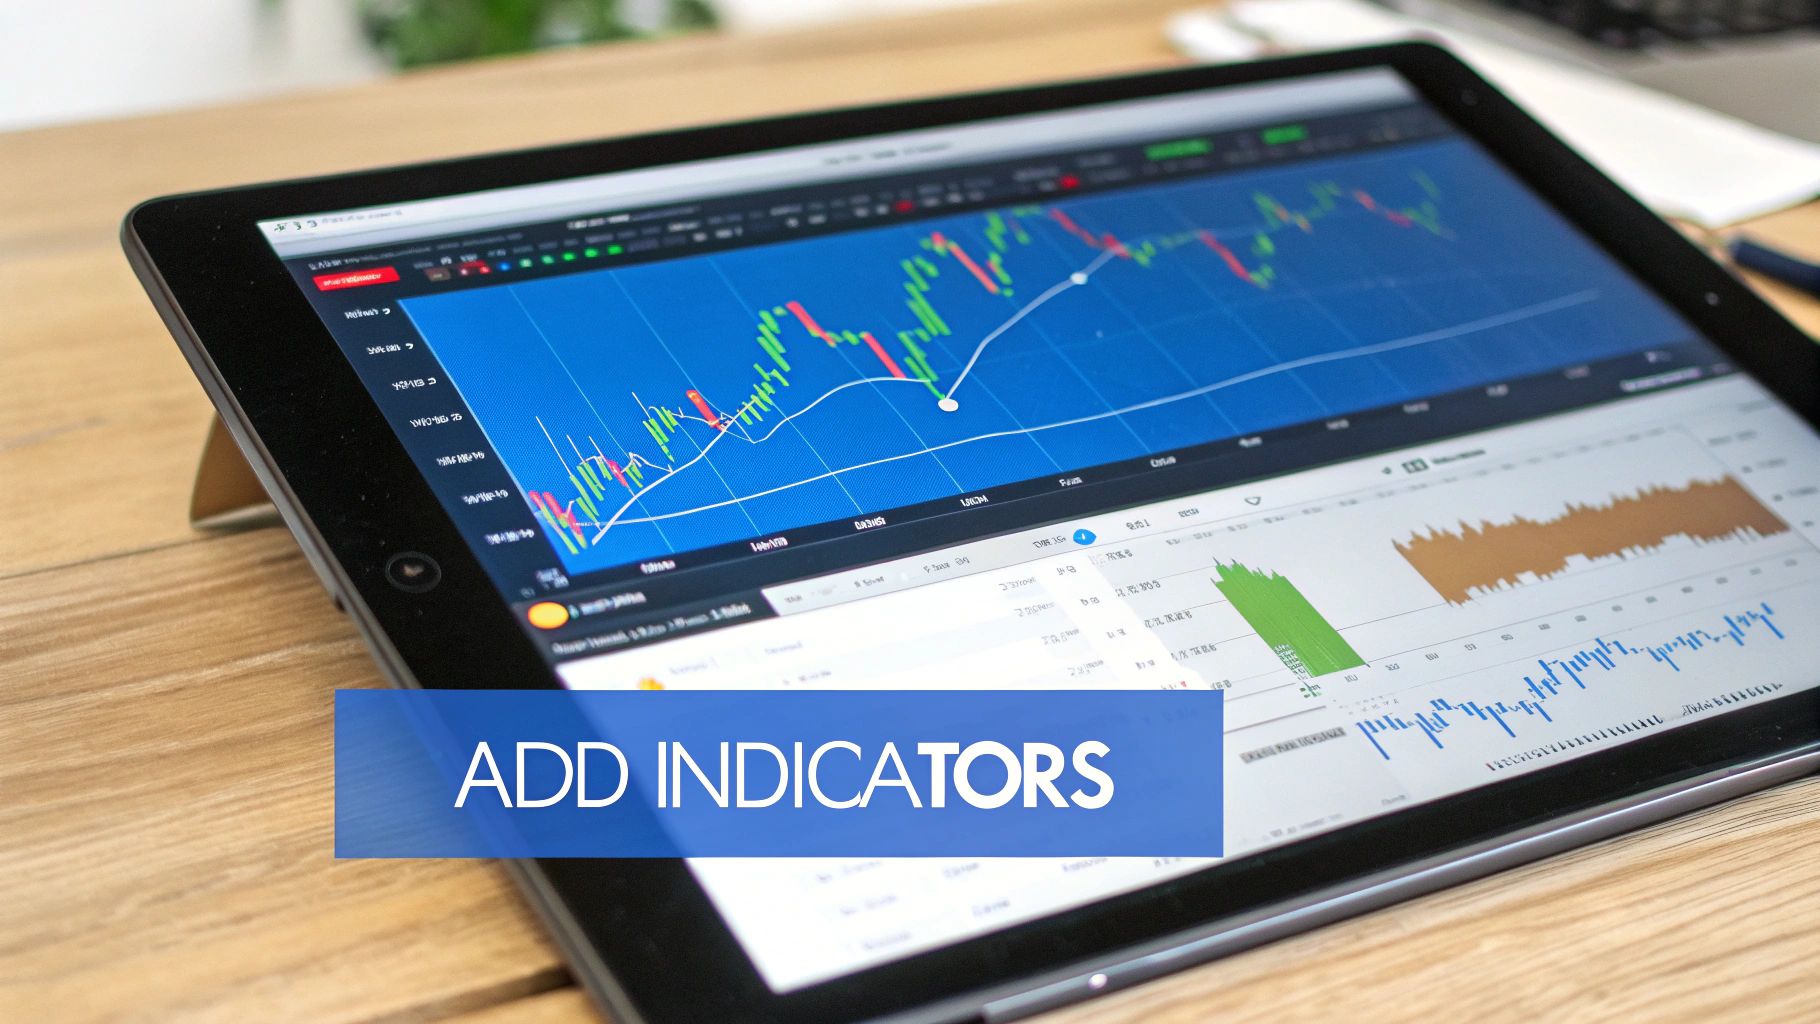
A chart might include indicators like Moving Averages, Relative Strength Index (RSI), and Bollinger Bands to help identify trends and predict future price movements. These indicators can be adjusted to different timeframes, like daily, weekly, or monthly charts, to suit different investment strategies. Using these tools allows investors to analyze market data more effectively, making informed decisions based on past performance and current market conditions. The ability to customize charts with specific indicators and timeframes helps users focus on the most relevant data for their investment goals, regardless of whether they are day traders or long-term investors. Discover more insights about stock chart customization.
Building a Visual Edge
Finally, customized charting encourages trading discipline. By clearly marking entry and exit points based on pre-set rules, traders can avoid emotional choices and stick to their trading plan. This improved discipline creates greater consistency and better long-term performance.
Developing a personalized visual way to analyze the market is a key step in achieving consistent trading success. The ability to quickly recognize important patterns and react decisively is what sets successful traders apart. By using the power of chart customization, you can develop a unique visual advantage, allowing you to make better trading choices and reach your financial goals.
High-Impact Indicators for Precision Trading
Elite traders understand that using a single indicator isn't enough for consistent success. They build robust systems by strategically combining indicators, much like verifying a news story with multiple sources for accuracy. This approach minimizes misleading signals and improves market analysis.
Unlocking Deeper Insights With Advanced Indicators
While common indicators like Moving Averages and the Relative Strength Index (RSI) have their uses, incorporating more advanced tools can unlock deeper insights. Consider adding Volume Profile, Market Profile, and Anchored VWAP to your arsenal.
Volume Profile reveals trading activity at specific price levels, pinpointing significant buying and selling pressure. Market Profile displays price and time information, visualizing value areas and potential turning points. Anchored VWAP provides a dynamic view of the average price, adaptable to specific starting points for trends or events.
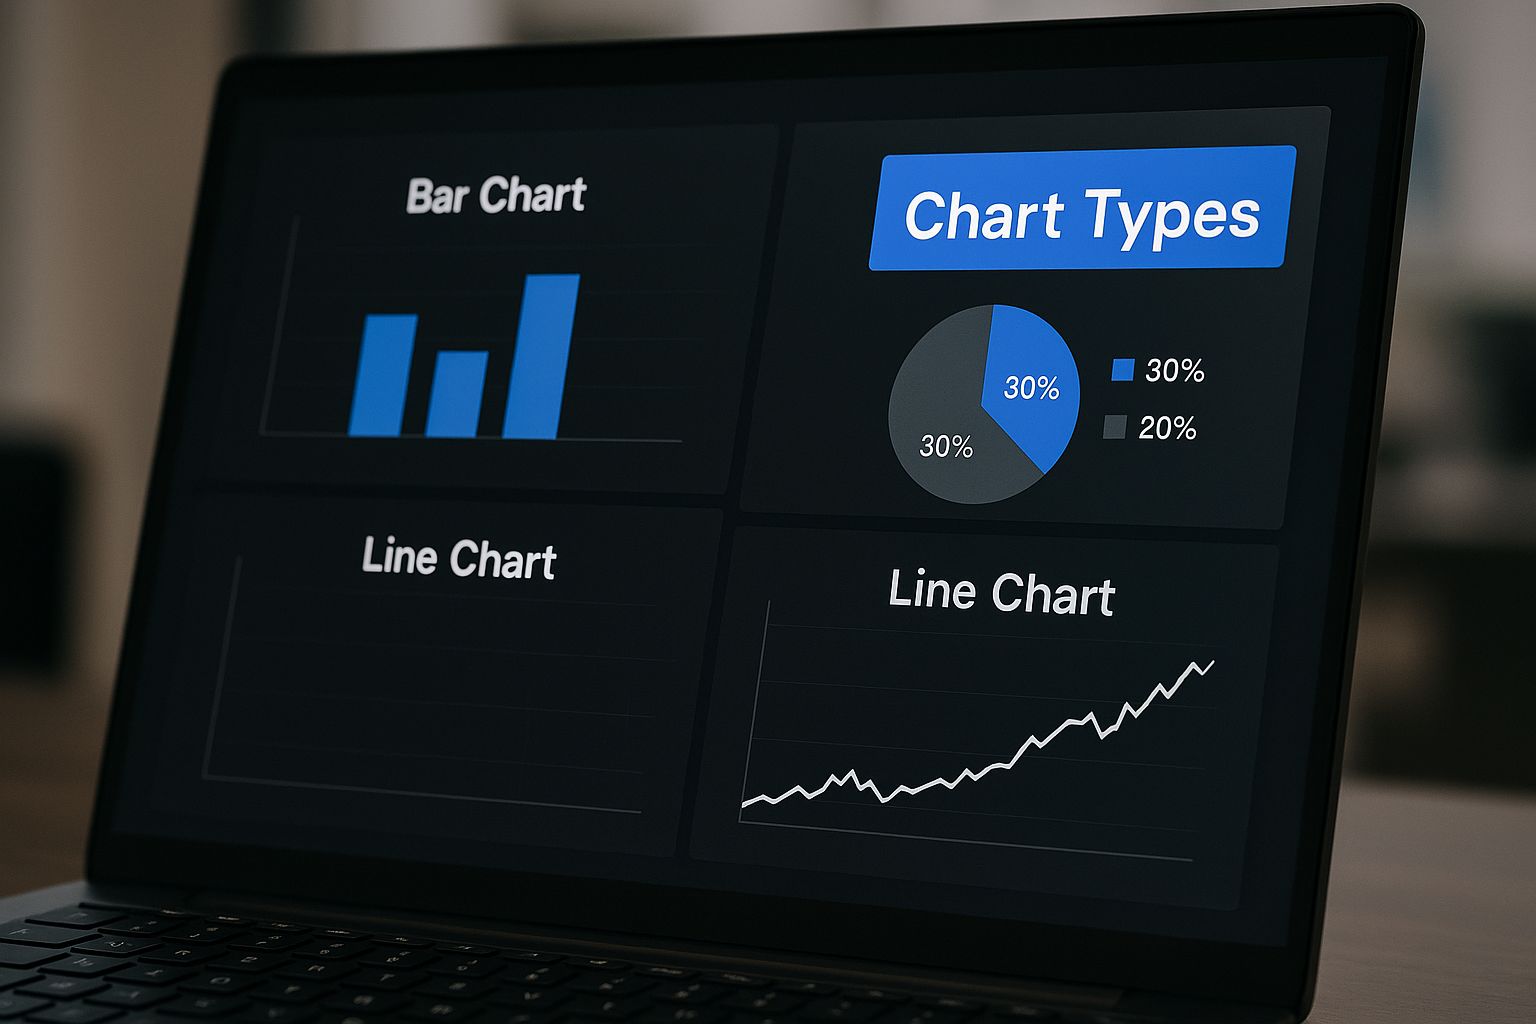
The infographic above showcases various stock chart setups, demonstrating the importance of customization. Tailoring charts to your trading style and preferences allows for faster, more accurate decisions based on relevant information.
Optimizing Traditional Indicators for Maximum Effectiveness
Even standard indicators benefit from customization. Using default settings can limit signal quality. Adjusting the periods of a Moving Average is a prime example.
A 5-day moving average, with its shorter period, reacts quickly to price changes, making it suitable for short-term traders. Conversely, a 200-day moving average identifies long-term trends, benefiting long-term investors.
Similar adjustments can be made to other indicators. Refining the overbought and oversold levels of the RSI can significantly enhance its effectiveness depending on the asset or market conditions.
Layering Indicators Without Information Overload
Combining multiple indicators doesn't have to be overwhelming. Focus on layering indicators from different categories: momentum, trend, and volatility. This confirms signals and provides a comprehensive view of market dynamics.
For example, combine a trend-following indicator like a Moving Average with a momentum indicator like the RSI, and a volatility indicator like Bollinger Bands.
This layered approach might involve looking for a stock trending upwards (Moving Average), showing increasing momentum (RSI), and breaking out of its volatility range (Bollinger Bands). This combined signal is stronger than relying on any single indicator.
To help you understand the various indicators, let's look at a comparison table.
The following table, "Popular Technical Indicators Comparison," compares widely used technical indicators based on their purpose, application, and typical settings. It provides a quick overview of the strengths and weaknesses of each indicator.
| Indicator | Purpose | Best For | Typical Settings | Signal Reliability |
|---|---|---|---|---|
| Moving Average | Identify trends | Trend following | 5, 20, 50, 100, 200 periods | Medium |
| RSI | Measure momentum and identify overbought/oversold | Momentum trading | 14 periods, 30/70 levels | Medium |
| Bollinger Bands | Measure volatility | Volatility breakout trading | 20 periods, 2 standard deviations | Medium |
| Volume Profile | Identify trading activity at price levels | Volume analysis | Variable | High |
| Market Profile | Visualize value areas | Day/Swing trading | Variable | High |
| Anchored VWAP | Identify average price relative to a point | Trend confirmation | Variable starting point | High |
This comparison highlights the importance of selecting the right indicator for your specific trading strategy. Each indicator offers unique insights, and combining them effectively can significantly enhance your trading edge. By customizing stock charts with a combination of indicators, traders gain a powerful and clear market view.
Chart Platform Showdown: Finding Your Perfect Match
The stock charting platform you select plays a crucial role in your ability to analyze market trends and make informed trading decisions. It's similar to selecting the proper tools for a job; a skilled craftsman wouldn't use a screwdriver when a hammer is required. Conversations with experienced traders from various sectors highlight the genuine strengths and weaknesses of different platforms, insights that are often overlooked in marketing materials.
Platform Strengths and Weaknesses: Beyond The Marketing Hype
Different trading strategies necessitate different platform features. Whether you're focused on in-depth order flow analysis or identifying specific chart patterns, some platforms are better suited to particular tasks. Certain platforms might excel at backtesting, while others prioritize real-time data. A platform specializing in options trading, for instance, might not offer the detailed charting tools needed for forex traders. Understanding these nuances is essential for selecting a platform that complements your trading style.
Even widely used platforms have hidden strengths and limitations. You might be missing out on valuable features that could improve your trading. TradingView, for example, is well-regarded for its social features and extensive scripting capabilities. However, many traders don't fully explore its advanced drawing tools for identifying potential price targets and support/resistance levels. Similarly, Koyfin offers a wealth of fundamental data alongside its charting, a feature often underutilized by traders focused solely on technical analysis. StockCharts.com is another popular platform providing advanced financial charts and technical analysis tools. The platform lets users compare symbols across various timeframes and offers a wide selection of technical indicators, enabling chart customization for different trading styles. This level of customization is invaluable for identifying complex setups that involve multiple indicators, helping traders pinpoint new trade targets or investment opportunities. An investor could, for example, utilize a combination of RSI and MACD indicators to identify potential buy and sell signals. Over two decades, millions of investors have relied on StockCharts for its thorough data and customizability. The platform also provides custom alerts for specific symbols, helping users stay on top of market movements.
Cost-To-Value Considerations: Beyond the Subscription Price
While the monthly or annual subscription fee is a consideration, remember to assess the platform's overall cost-to-value ratio. Data quality is paramount. A less expensive platform with inaccurate or delayed data can lead to costly trading errors. Seamless execution integration is equally crucial for active traders. A platform with excellent charting but poor order execution capabilities can hinder your ability to react quickly to market opportunities.
The Psychology of Platform Choice: Impact on Decision-Making
Your platform choice can also influence your trading psychology. A cluttered or unintuitive platform interface can lead to indecision and increased trading stress. Conversely, a clean, customizable platform can promote focus and confidence. This is particularly true in fast-moving markets where rapid decisions are essential. The ideal platform should feel like a natural extension of your thought process, enabling clear analysis and effective trade execution.
To help you choose the right platform, let's compare some popular options:
Stock Chart Platform Comparison
Detailed comparison of popular stock charting platforms based on features, pricing, and customization options
| Platform | Free Features | Premium Cost | Customization Options | Data Coverage | Best For |
|---|---|---|---|---|---|
| TradingView | Basic charting, some indicators, community features | $12.95 - $49.95/month | Extensive scripting, custom indicators, drawing tools | Global stocks, forex, crypto | Technical analysis, social trading |
| Koyfin | Basic charting, limited fundamental data | Varies | Limited | Primarily US equities | Fundamental analysis, casual investors |
| StockCharts.com | Limited charts, delayed data | Varies | Advanced charting tools, indicators | US stocks, some international | Technical analysis, long-term investors |
| Finviz | Basic screener, delayed data | $24.96 - $39.96/month | Pre-built screeners, some customization | US stocks, some forex and crypto | Fundamental and technical screening, beginners |
This table highlights some key differences in features, pricing, and data coverage across popular platforms. Consider your specific needs and trading style when making your decision.
Choosing the correct charting platform is a significant decision. By carefully considering the features, cost, and psychological impact of each option, you can select a platform that empowers you to achieve your trading goals.
Mastering Timeframes: The Hidden Edge of Elite Traders
Customizing stock charts goes far beyond simply adding indicators. The real power lies in understanding the interplay between different timeframes and how they can reveal hidden opportunities. Think of it like a skilled musician using different musical scales to compose a complex melody. Professional traders employ multi-timeframe analysis in much the same way, creating a comprehensive market view. Let's explore the techniques they use to identify high-probability setups and filter out market noise.
Understanding Multi-Timeframe Analysis
Multi-timeframe analysis involves examining the same asset across various time horizons. This might involve studying a stock on a daily chart to determine the overall trend, then switching to a 4-hour chart to pinpoint potential entry and exit points, and finally using a 15-minute chart for precise timing.
This multifaceted approach helps traders confirm signals and avoid being fooled by short-term market fluctuations. For instance, a trader might identify a bullish signal on a daily chart but notice a bearish signal on a 15-minute chart. This apparent contradiction requires careful interpretation. The daily chart suggests the long-term direction, while the 15-minute chart reflects momentary volatility. A prudent trader might wait for the 15-minute chart to align with the daily chart before entering a trade. New to trading? You might consider checking out resources like Compare Online Course Platforms to enhance your trading knowledge.
Timeframe Combinations for Different Trading Styles
Different trading styles benefit from specific timeframe combinations. Scalpers, holding trades for mere seconds or minutes, often use 1-minute and 5-minute charts. Day traders, who typically hold trades for hours, may prefer 5-minute, 15-minute, and hourly charts.
Meanwhile, swing traders and position traders, holding trades for days, weeks, or even months, frequently use daily, weekly, and monthly charts. This tailored approach allows traders to align their analysis with their holding period and specific trading goals. Naturally, a scalper wouldn't need to analyze monthly charts, just as a position trader might not find 1-minute charts particularly useful.
Identifying Your Optimal Primary Timeframe
Selecting a primary timeframe is essential for success. This timeframe becomes your central focus for identifying trends and making informed trading decisions. This choice depends on factors such as trading style, risk tolerance, and available capital.
- Trading Style: As discussed, different trading styles lean towards different timeframe preferences.
- Risk Tolerance: Shorter timeframes involve greater risk because of heightened price volatility. Longer timeframes offer more stability but may mean slower returns.
- Capital: Traders with smaller accounts might favor shorter timeframes to potentially maximize gains, whereas traders with larger accounts may opt for longer timeframes with a greater emphasis on capital preservation.
Practical Frameworks for Timeframe Mastery
Several practical frameworks help traders effectively use multi-timeframe analysis. The "top-down" approach is a popular method. This involves starting with the longest timeframe (e.g., monthly) to determine the overarching trend, then progressively moving down to shorter timeframes for precise entry and exit points.
Another effective strategy is the "triple screen" approach. This involves analyzing three timeframes: long-term, medium-term, and short-term. This provides a comprehensive market view, combining broad trend analysis with specific trade execution precision.
By mastering the interplay between different timeframes, traders can customize their stock charts for a significant advantage. This allows them to identify opportunities that single-timeframe traders might overlook. Understanding the long-term trend while precisely timing entries and exits is key to enhanced trading performance.
Beyond Bars and Candles: Advanced Visualization Tactics
Standard candlestick and bar charts are the foundation of technical analysis. However, they only offer a glimpse into market dynamics. Imagine trying to understand a complex engine by only examining a few gears. For a truly comprehensive understanding, professional traders use advanced visualization techniques.
Exploring Alternative Chart Types
These techniques go beyond basic chart types, incorporating alternative styles and specialized overlays to uncover hidden opportunities. Alternative chart types like Renko, Heikin-Ashi, and Point & Figure filter out market noise. They provide a cleaner view of price action.
Renko charts, for example, focus exclusively on price changes of a pre-defined amount. They disregard time and minor fluctuations, highlighting substantial trends. Heikin-Ashi charts smooth price data, reducing volatility and making trends more apparent. Point & Figure charts plot price using Xs and Os, emphasizing reversals and filtering out insignificant movements. Each offers a unique perspective on market behavior.
You might be interested in: 8 Day Trading Chart Patterns Every Trader Should Know
Integrating Advanced Overlays for Deeper Insights
Advanced overlays add another layer of analysis, enriching the information on your charts. The Volume Profile reveals trading activity at various price levels. This helps pinpoint key support and resistance areas. The Market Profile, originally designed for futures trading, shows the distribution of trading activity over time, revealing value areas and possible turning points. Order flow visualization, a tool often used by institutional traders, provides insights into order book dynamics, helping anticipate future price movements.
AmCharts and Stockdio offer significant flexibility in customizing stock charts. AmCharts features indicators, annotations, and comparison tools. Stockdio offers a complete user interface for historical price charts and technical indicators like MACD, Bollinger Bands, and Envelopes. This customization is crucial for embedding financial data into applications or dashboards. Explore this topic further.
Utilizing Specialized Drawing Tools
Specialized drawing tools offer a way to visually analyze price patterns and anticipate future movements. Fibonacci extensions and retracements, based on the Fibonacci sequence, pinpoint potential support and resistance levels from significant price swings. Harmonic patterns, like the Gartley and Bat patterns, suggest potential reversal zones based on specific price and time relationships. Pitchforks, also called median line studies, project potential price targets based on previous trends.
Used with other analytical methods, these tools can improve market analysis. This is especially helpful for identifying precise entry and exit points for trades. It ultimately enhances risk management and maximizes profit potential.
Building Your Trading Command Center
Professional traders approach the market with a structured, organized system. They build trading command centers, designed for rapid decision-making. This involves strategically arranging custom templates and workspaces. Think of it like a pilot's cockpit, meticulously organized for optimal control. Let's explore how institutional traders create these setups to improve both the speed and quality of their decisions.
Developing Specialized Chart Setups
Imagine having a pre-configured toolkit ready for any market scenario. That's the advantage of specialized chart setups. Professional traders develop templates for various market conditions, sectors, and specific strategies.
For example, a trader specializing in volatile tech stocks might prioritize a template with short-term moving averages and momentum indicators. A long-term investor focusing on blue-chip stocks might emphasize fundamental data and long-term trend indicators.
These templates allow for quick deployment when opportunities appear, saving valuable time and enabling decisive action. Think of it like having different blueprints for various building types–each tailored for a specific purpose and ready when needed.
Managing Multiple Watchlists and Analysis Screens
Managing multiple information streams is crucial for trading success. Professional traders utilize specific workspace configurations to combat information overload.
They might dedicate one screen to broad market analysis, another to specific sectors, and a third to individual stocks. Within each screen, meticulously organized watchlists track key symbols and their performance.
This segmented approach offers a clear market overview while allowing deep dives into specific assets. This enhances focus and facilitates quick, informed decisions. It's comparable to an air traffic controller managing flights with a system of organized screens and alerts.
Automating Your Customized Charts for Continuous Monitoring
Automating your charts frees you from routine tasks, enabling you to focus on analysis. Many charting platforms, like TradingView, offer alert functionalities. These let you set triggers based on specific criteria.
- Price Breakouts: Receive an alert when a stock breaks through a key resistance level.
- Indicator Crossovers: Get notified when an indicator crosses a pre-defined threshold.
These alerts act as automated sentinels, constantly monitoring the market for your specific setups. This lets you step away from your screens without missing opportunities. It also reduces emotional decision-making by alerting you only when pre-determined conditions are met.
By automating routine monitoring, you focus on higher-value analysis. It's similar to a CEO delegating daily operations to concentrate on strategic planning. This structured approach improves efficiency, accuracy, and ultimately, profitability. By implementing these techniques, traders create personalized command centers that optimize their ability to navigate the market effectively.
Breaking Through Advanced Customization Barriers
For traders looking to gain a real advantage in their analysis, customizing stock charts is much more than just picking indicators and colors. It's about building your own proprietary tools and incorporating sophisticated data sources to uncover insights that others overlook. This is how the best traders differentiate themselves. Let's delve into these advanced customization techniques.
Implementing Custom Indicators and Scripts
Imagine having indicators designed specifically for your trading strategy. Platforms like ChartsWatcher allow you to implement custom indicators and scripts. This opens up a world of possibilities, from developing your own unique algorithms to modifying existing indicators to fit your specific requirements. You might find this resource helpful: How to customize stock charts for optimal trading. For instance, you could build an indicator that blends volume, volatility, and price action into a single, insightful metric, providing a distinct perspective on the market.
Integrating Alternative Data Sources Through APIs
Application Programming Interfaces (APIs) unlock access to a vast amount of information beyond standard market data. Imagine incorporating options flow, insider transactions, and sentiment metrics directly into your charts. This enables you to analyze market dynamics from multiple perspectives, revealing hidden opportunities.
For example, by integrating an API, you could view unusual options activity alongside price action, hinting at potential significant price movements. Combining this with sentiment analysis from social media feeds creates a powerful data convergence, improving your grasp of market psychology.
Applying Machine Learning Without Advanced Coding
Machine learning (ML) is no longer just for data scientists. Many platforms are making ML accessible to traders without the need for extensive coding knowledge. Imagine utilizing ML to identify subtle price action patterns or predict future market moves based on historical data.
This could involve using ML algorithms to identify recurring chart formations that frequently precede large price swings. While still a developing area, ML holds immense potential for bolstering traditional technical analysis.
Leveraging Chart-Sharing Communities
Connecting with a network of traders who share similar goals is invaluable. Chart-sharing communities offer a platform to exchange strategies, explore new techniques, and discover innovative analysis approaches. Imagine having access to charts created by seasoned professionals, gleaning insights from their methods and broadening your own understanding.
This type of collaborative environment can significantly accelerate learning and expose you to perspectives you may not have considered. To track trading performance and overall market dynamics in real-time, consider integrating elements from robust executive dashboard examples into your trading setup. These tools allow you to visualize key performance indicators (KPIs) and effectively fine-tune your strategies.
These advanced customization methods allow you to create a truly personalized trading command center, tailored precisely to your analytical needs and market approach. Ready to take your trading analysis to the next level with a platform built for deep customization? ChartsWatcher provides the tools you need to build a truly unique and effective trading command center. Explore ChartsWatcher today and unlock your full trading potential.
