Technical Analysis for Beginners: Essential Chart Guide
The Real Power of Technical Analysis for Beginners
Technical analysis can feel overwhelming for new traders. The complex jargon and intricate charts can be intimidating. But at its core, technical analysis for beginners is all about understanding price action: how an asset's price moves over time. This approach helps traders make informed decisions based on historical data and noticeable trends. It offers a structured way to navigate the market's ups and downs.
Why Price Patterns Matter
Technical analysis assumes that all important market information is already reflected in the price. Instead of focusing on financial news and company reports, beginners can interpret the story told by the charts. Recurring price patterns, such as support and resistance levels, can suggest where the price might go next.
Volume, the amount of an asset traded in a specific period, helps confirm these patterns and reveals market sentiment. Beginners can identify important signals and filter out the noise.
Technical analysis has a rich history, dating back to 17th-century Japanese rice traders who developed candlestick charting. Its modern popularity increased after Charles Dow's early 20th-century Dow Theory. Today, over 70% of day traders use technical indicators. Moving averages, like the 50-day and 200-day, are the most popular tools for spotting trends.
A 2023 survey found that 85% of professional traders combine technical and fundamental analysis. Retail traders also use tools like Bollinger Bands and RSI in about 60-70% of their short-term trades globally. Even the S&P 500's history demonstrates the power of technical analysis: when its 200-day moving average acts as support, markets often rally by an average of 12% over six months. This shows how institutional algorithms can amplify technical patterns. For more detailed statistics, learn more about technical analysis statistics.
Psychological Advantages
Besides its analytical strength, technical analysis offers psychological benefits for beginners. By using quantifiable data and objective rules, traders can reduce emotional decision-making – a common trap for newcomers. This structured method helps manage fear and greed, encouraging discipline and patience.
Beginners can create consistent trading strategies, even when markets are volatile. Technical analysis helps manage risk and maintain a clear perspective on market conditions.

Chart Types That Actually Make Sense When You're Starting
So, you're ready to dive into the exciting world of technical analysis? Great! But with a dizzying array of chart types, knowing where to begin can be overwhelming. This section simplifies things by focusing on the most effective charts for beginners.
Candlestick Charts: Unveiling Market Psychology
Ditch the basic line charts. Candlestick charts are the gold standard for beginners in technical analysis. They offer a much richer view of market movements. Each "candle" provides a visual snapshot of a given period, showing the opening, closing, high, and low prices. This allows you to immediately see whether the period was bullish (closing higher than it opened) or bearish (closing lower than it opened).
The "wicks" at the top and bottom of each candle represent the price range, giving you a complete picture of the price action. A long green candle, for example, suggests strong buying pressure, while a long red candle indicates strong selling. This visual representation of market sentiment is incredibly helpful for new traders. You can delve deeper into chart reading with resources like How to master stock chart reading.
Why Candlesticks Trump Line Charts
Line charts simply connect closing prices. Candlestick charts, however, provide a more nuanced understanding of market psychology within each period. This is invaluable for beginners. While a line chart may show the general price direction, candlestick charts reveal the push and pull between buyers and sellers.
This deeper understanding allows you to make better trading decisions. By seeing how price action unfolds within each period, you're better equipped to anticipate potential reversals or continuations.
Keeping it Simple: Customizing for Clarity
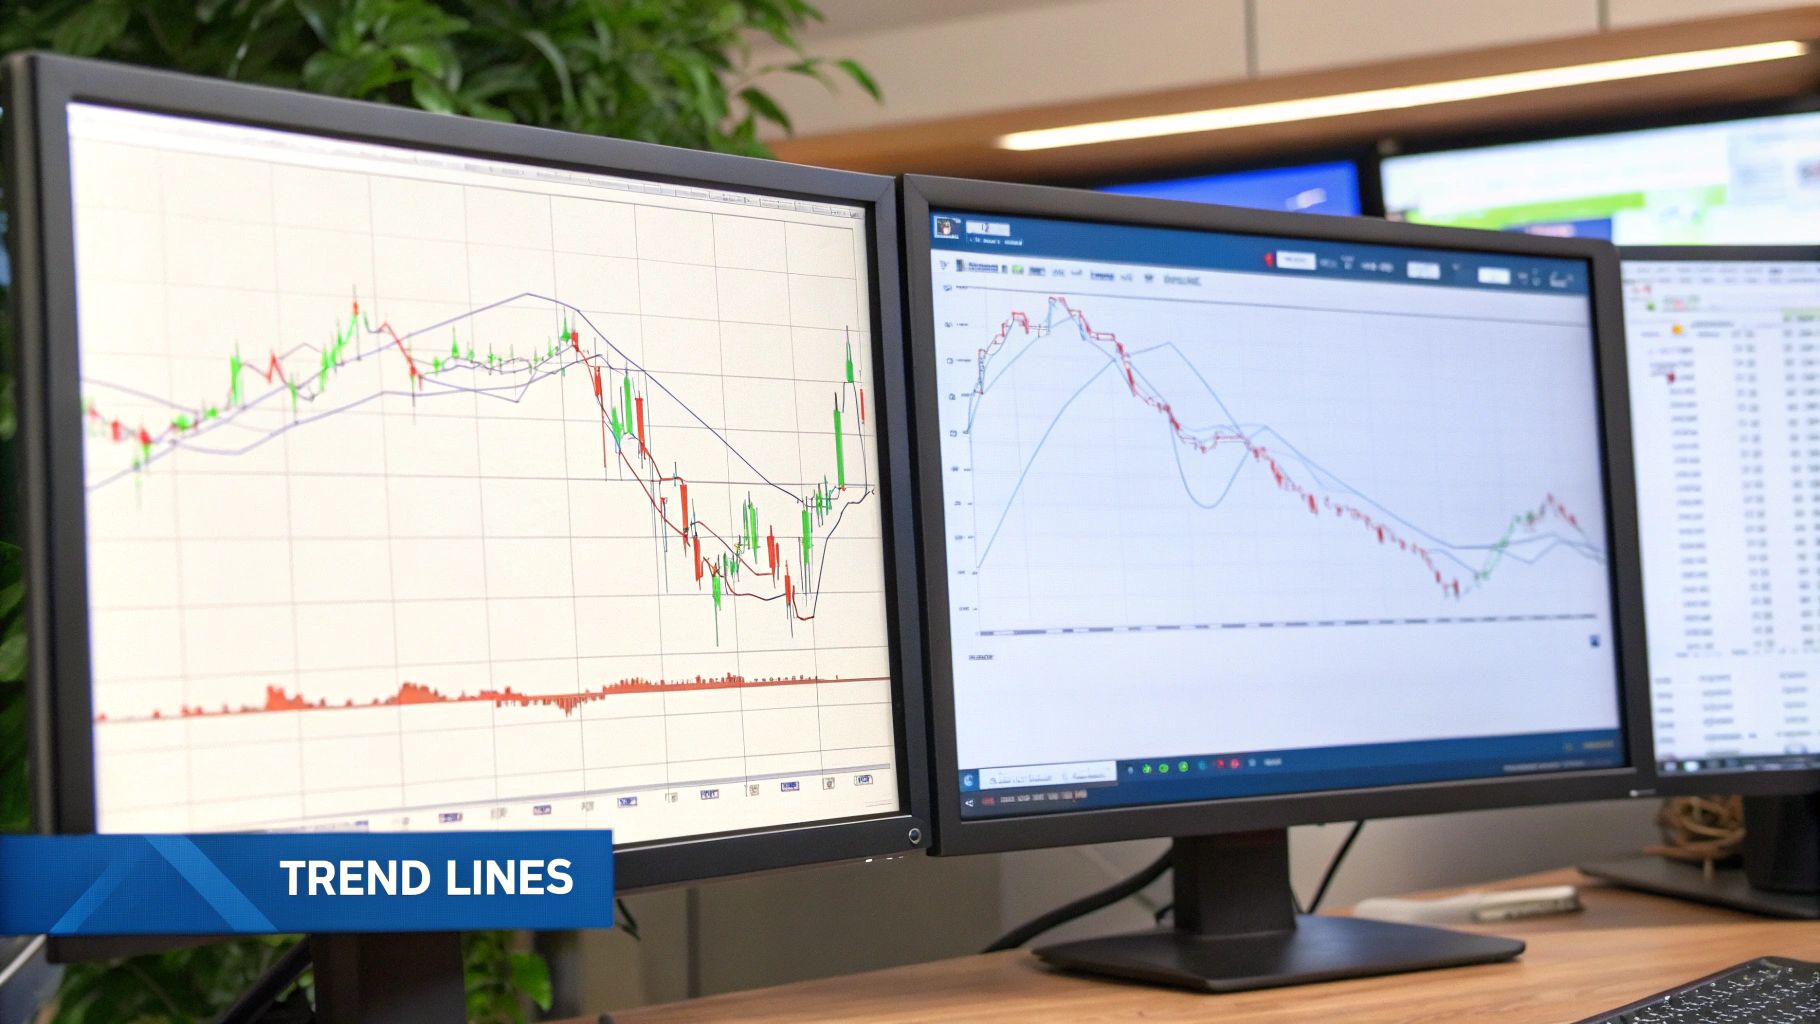
As a beginner, keeping your charts clean and uncluttered is essential. Don't overload them with indicators. Instead, focus primarily on price action. Customize your charts with key elements like support and resistance lines, trendlines, and perhaps a couple of moving averages. This focused approach prevents analysis paralysis and promotes confident decision-making based on clear signals.
As you become more experienced, you can gradually incorporate more advanced tools. But starting simple is crucial for building a solid foundation.
To further clarify the different chart types available, let's look at a comparison table. This table outlines the pros, cons, and best use cases for each, giving you a better idea of how to use them in your trading journey.
Chart Types Decoded: What Really Works for Beginners
A comparison of different chart types with their advantages, disadvantages, and best use cases for beginner traders.
| Chart Type | Information Provided | Complexity Level | Best For | Limitations |
|---|---|---|---|---|
| Line Chart | Closing prices over time | Very Simple | Showing overall trends | Lacks detail about price action within each period |
| Candlestick Chart | Open, high, low, and close prices for each period | Beginner-Friendly | Understanding market psychology and price action | Can be overwhelming for absolute beginners if overloaded with indicators |
| Bar Chart | Open, high, low, and close prices for each period (similar to candlestick but less visual) | Beginner-Friendly | Similar to candlesticks but less visually intuitive | Same limitations as candlesticks regarding information overload |
| Renko Chart | Price changes based on a fixed brick size, filtering out noise | Intermediate | Identifying strong trends and reversals | Doesn't show time-based price action, less suitable for short-term trading |
| Point & Figure Chart | Price changes based on a fixed box size, ignoring time | Intermediate | Long-term trend analysis and support/resistance identification | Similar to Renko, less focus on time makes it unsuitable for short-term strategies |
Understanding the nuances of each chart type empowers you to choose the right tool for your analysis. While line charts offer simplicity, candlestick charts provide a much more comprehensive view of price action, making them ideal for beginners learning to interpret market dynamics.
Remember, clarity is key when starting out. Focus on mastering one chart type—candlestick charts—and gradually explore other charting methods as you gain experience and confidence.
Technical Indicators That Actually Tell You Something

Now that we've covered different chart types, let's explore technical indicators. These tools offer valuable insights into price action and can help beginners spot potential trading opportunities. However, choosing the right indicators and keeping your charts clean is essential. This section focuses on the most effective indicators for newcomers to technical analysis.
Moving Averages: The Foundation of Trend Analysis
Moving averages smooth out price fluctuations to reveal the underlying trend. They are calculated by averaging a set number of past closing prices. For instance, a 50-day moving average averages the closing prices over the past 50 days. This is a fundamental indicator for beginners in technical analysis.
Common moving averages include the 20-day, 50-day, and 200-day. When the price trades above a moving average, it suggests an uptrend. Conversely, a price below the moving average indicates a downtrend.
Momentum Indicators: Avoiding Tops and Bottoms
Momentum indicators help identify the strength and speed of price changes. These indicators can warn you when a trend is weakening, preventing you from buying at the top or selling at the bottom.
The Relative Strength Index (RSI) is a popular momentum indicator. It fluctuates between 0 and 100. Readings above 70 generally signal overbought conditions, while readings below 30 signal oversold conditions.
Another useful momentum indicator is the Moving Average Convergence Divergence (MACD). The MACD measures the relationship between two moving averages. A crossover above the signal line is often a bullish signal, while a crossover below suggests a bearish signal. Read also: How to master technical analysis indicators.
Volume Indicators: Seeing What Others Don’t
Volume indicators offer insights into the conviction behind price moves. High volume during an uptrend confirms the move’s strength. Low volume, on the other hand, could signal weakness. On-Balance Volume (OBV) is a frequently used volume indicator. It tracks cumulative volume based on price changes. A rising OBV confirms a bullish trend, while a falling OBV might suggest a bearish divergence.
Combining Indicators for Powerful Signals
Successful beginners often combine two or three complementary indicators instead of overcrowding their charts. For example, a trader might use a moving average to identify the trend, RSI to gauge momentum, and OBV to confirm volume. This combined approach offers a more complete market picture.
Avoiding Indicator Dependency
While indicators are valuable tools, avoid over-reliance. Always prioritize price action and use indicators as confirmation, not the sole basis for trading decisions. Focus on the market psychology behind the indicators, not just the mathematical formulas.
The following table provides a quick overview of the key technical indicators beginners should focus on. It summarizes their purpose, typical settings, and how to interpret buy and sell signals.
The Only Technical Indicators Beginners Really Need: Summary of key technical indicators with their purposes, interpretations, and typical settings
| Indicator | Type | What It Measures | Common Settings | Buy Signal | Sell Signal |
|---|---|---|---|---|---|
| Moving Average | Trend | Average price over a period | 20, 50, 200 days | Price crosses above MA | Price crosses below MA |
| RSI | Momentum | Speed and change of price movements | 14 periods | Oversold (below 30) | Overbought (above 70) |
| MACD | Momentum | Relationship between two moving averages | 12, 26, 9 periods | Crossover above signal line | Crossover below signal line |
| OBV | Volume | Cumulative volume based on price changes | N/A | Rising OBV | Falling OBV |
This table offers a handy reference as you delve deeper into technical analysis. Remember, starting with a few core indicators and grasping their underlying principles is key to success.
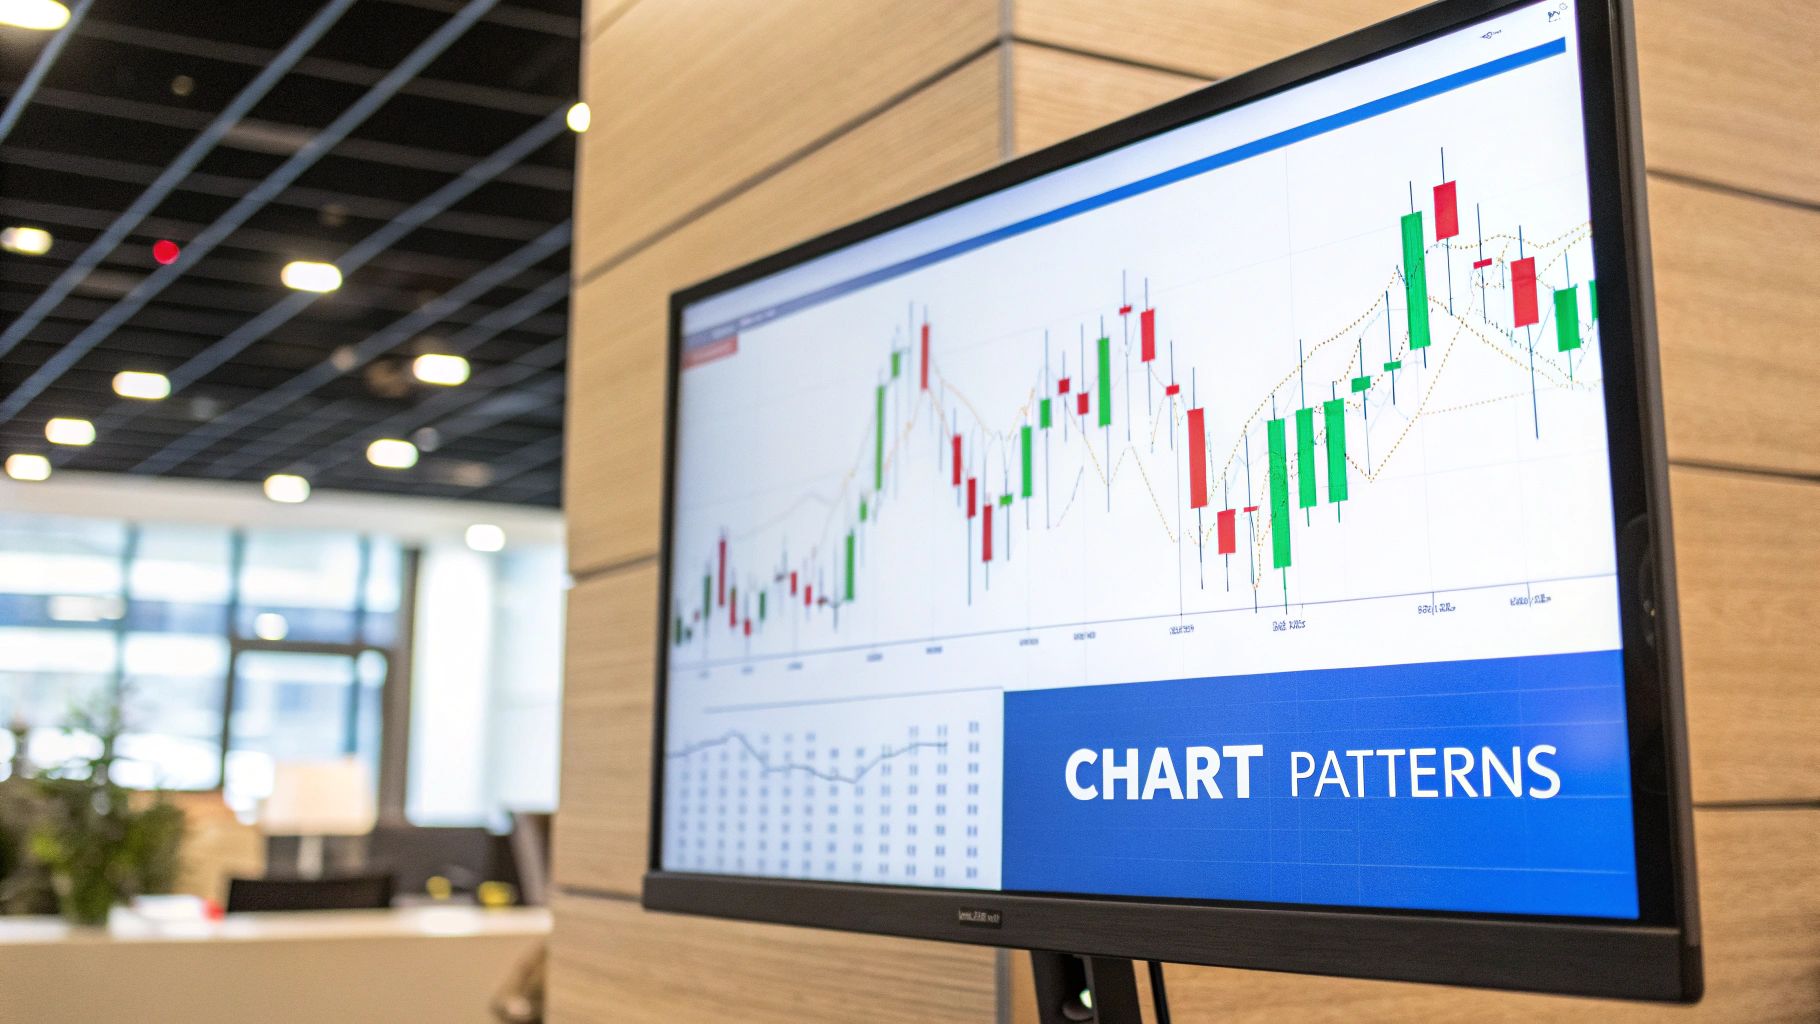
Spotting Chart Patterns That Actually Work
Technical analysis for beginners often starts with chart patterns. But it's important to go beyond the textbook and understand how these patterns play out in the real world. This section explores practical pattern recognition that beginners can use.
Textbook Patterns vs. Real Market Examples
It’s important to understand the difference between perfect textbook examples and real-world chart patterns. Textbooks often present clean, perfectly formed patterns. Real markets? Not so much.
For example, a double bottom in a textbook will show two symmetrical dips. Realistically, these dips will have slightly different depths and widths. Beginners need to be flexible when identifying patterns.
High-Probability Setups and Pattern-Hunting Traps
Some patterns, like double bottoms and head and shoulders, historically have higher success rates. This is partially because traders react predictably to support and resistance levels.
However, beware of pattern-hunting. Don’t force patterns onto charts where they don't exist. Focus on patterns that develop naturally within the market trend.
Volume Confirmation and Context
Volume is key to confirming chart patterns. A high-volume breakout from a pattern is more reliable than a low-volume one. Increased volume shows more conviction behind the price movement.
Market context is also critical. A pattern during a strong uptrend is more likely to result in gains than the same pattern during a downtrend. According to Fidelity's trading data, retail traders using basic trendlines on hourly charts improve entry timing by 30-40%. Fidelity also notes that patterns like head-and-shoulders and double tops have predictable outcomes. Breakout patterns, for instance, reached 68% success rates when combined with high volume in a study of over 5,000 U.S. stock trades. For more detailed statistics, check out their learning center.
Profit Targets and Protective Stops
After identifying a valid pattern, setting profit targets and protective stops is essential for risk management. With a double bottom, a common profit target is the distance between the pattern’s bottom and the neckline. A protective stop goes slightly below the second bottom. This helps maximize profits while limiting losses.
Psychology of Chart Patterns
Understanding the psychology behind chart patterns can significantly improve your analysis. Patterns often reflect changes in market sentiment, shifting between fear and greed. Recognizing these shifts can offer insights into future price movements.
Many traders know these patterns, yet they still work. They reflect human behavior in response to market changes. This makes chart pattern recognition a powerful tool for beginners.
Building Your First Technical Trading System That Works
As a new trader, constantly changing your strategies can hinder your success. This section outlines a framework to help you build a reliable technical trading system. This approach prioritizes consistent, sustainable growth over large, but often fleeting, profits.
Starting Simple: Market and Timeframe
New traders often find success by concentrating on a single market and timeframe. For example, focusing on the EUR/USD currency pair on the hourly chart provides a manageable amount of data to analyze and avoids feeling overwhelmed. Mastering one area first builds a strong foundation before branching out.
Selecting Complementary Indicators
Your chosen indicators should offer different perspectives. Combining a trend indicator, such as a moving average, with a momentum indicator like the RSI (Relative Strength Index), provides a more balanced view. Avoid using too many indicators that measure the same thing. This adds complexity without providing additional useful information. Fewer indicators mean fewer potentially conflicting signals.
Concrete Rules, Not Subjective Interpretations
Your system needs clear entry and exit rules. Don't rely on intuition. Define specific parameters. For example, entering a trade when the price crosses above the 50-day moving average and the RSI is below 30 offers an objective trigger. This structured approach helps to remove emotional decision-making.
Actionable Trading Templates
Here are some actionable trading templates to get you started. These are basic examples that you can adapt and customize:
-
Trend-Following Strategy: Enter a trade when the price moves above a key resistance level with rising volume and the 20-day moving average is trending upwards. Exit when the price closes below the 20-day moving average.
-
Breakout Strategy: Enter a trade when the price breaks out of a defined range with increasing volume and the RSI crosses above 50. Exit when the price falls back into the range or the RSI drops below 30.
-
Reversal Strategy: Enter a trade when the price forms a double bottom, confirmed by strong volume on the second bounce, and the MACD crosses above its signal line. Exit when the price drops below the low point of the double bottom pattern.
Position Sizing and Risk Management for Smaller Accounts
New traders should use small position sizes. Risking a small percentage of your account, such as 1-2%, on each trade protects your capital as you learn. This approach means that a string of losses won’t significantly impact your overall trading capital.
Emotional Discipline and Realistic Expectations
Technical analysis gives you a framework, but success depends on emotional discipline. Accepting losses and sticking to your system's rules are key. Don't chase quick wins. Instead, focus on consistent results over time. Trading is a long-term endeavor.
Building a robust trading system and following disciplined risk management practices sets you up for sustained success. Be patient and consistent. Building a winning trading system is an ongoing journey.
Avoiding the Technical Analysis Mistakes That Crush Beginners
Transitioning from learning about technical indicators and chart patterns to actually using them can be tricky. This section explores common pitfalls beginners often encounter and provides practical advice for avoiding them.
The Overtrading Trap: More Trades, More Problems
One of the biggest mistakes beginners make is overtrading. Seeing all those indicators and patterns can tempt you to take trades on every minor signal. This frequently leads to more losses than wins. It's like a surfer trying to catch every wave; they'll quickly tire out and wipe out more often.
Successful traders emphasize patience and discipline. Focus on quality setups that align with your trading system, not the sheer quantity of trades. This means waiting for the right signals, not jumping in on every price fluctuation.
Confirmation Bias: Seeing What You Want to See
Confirmation bias is another common issue. This is the tendency to favor information that confirms your pre-existing beliefs while ignoring contradictory evidence. For instance, if you're convinced a stock will go up, you might disregard bearish signals and focus only on the bullish ones.
This creates a distorted view of the market, often resulting in losses. To counter confirmation bias, actively look for evidence that challenges your initial bias. Challenge your assumptions and consider alternative scenarios. This helps develop a more objective perspective.
Indicator Addiction: Losing Your Market Intuition
Beginners sometimes become overly reliant on indicators, cluttering their charts with dozens, thinking more is better. This can lead to indicator addiction, where traders blindly follow signals without understanding the broader market context. This can obscure your true market intuition. It’s like relying solely on GPS while driving—you miss the scenery and don't learn the route.
Remember, indicators should confirm price action, not dictate it. Start with a few key indicators and concentrate on understanding price dynamics. This approach cultivates a deeper understanding of the market.
Practical Techniques for Avoiding Mistakes
-
Track Your Analysis: Record your reasoning for taking trades before entering them. Review your trades and analysis regularly to identify patterns in your successes and failures. It's like journaling your thoughts and feelings for better self-awareness.
-
Maintain Objectivity: Develop a trading plan with specific entry and exit rules. Stick to your plan. This helps minimize emotional decisions. Backtesting your strategy against historical data can also refine your plan and build confidence.
-
Separate Analysis from Execution: Analyze charts and identify potential setups away from the pressure of live trading. This helps avoid impulsive decisions. Treat analysis as its own process, then apply your trading plan when appropriate.
From Analysis Paralysis to Disciplined Execution
By understanding and avoiding these psychological pitfalls, you’ll transition from analysis paralysis to confident decision-making. Technical analysis for beginners isn't solely about indicators and patterns; it's about developing disciplined execution and maintaining objectivity. This journey requires self-awareness, ongoing learning, and the courage to challenge your assumptions.
Ready to take your technical analysis to the next level? Check out ChartsWatcher, stock market scanning software designed for professional traders. Explore ChartsWatcher and elevate your trading today.
